-
First-Principles Study on the Influence of Crystal Structures on the Interface Properties of Graphene/Titanium Composites
-
Laser Control of the Specular and Diffuse Reflectance of Aluminum Thin-Film–Isolator–Metal Structures
-
The Mechanical Properties and Wettability of Epoxy/Benzoxazine Composites in Acid Rain Conditions
Journal Description
Coatings
Coatings
is an international, peer-reviewed, open access journal on coatings and surface engineering published monthly online by MDPI. The Korean Tribology Society (KTS) and The Chinese Society of Micro-Nano Technology (CSMNT) are affiliated with Coatings and their members receive discounts on the article processing charges.
- Open Access— free for readers, with article processing charges (APC) paid by authors or their institutions.
- High Visibility: indexed within Scopus, SCIE (Web of Science), Inspec, CAPlus / SciFinder, and other databases.
- Journal Rank: JCR - Q2 (Physics, Applied) / CiteScore - Q2 (Surfaces, Coatings and Films)
- Rapid Publication: manuscripts are peer-reviewed and a first decision is provided to authors approximately 13.7 days after submission; acceptance to publication is undertaken in 2.6 days (median values for papers published in this journal in the first half of 2024).
- Recognition of Reviewers: reviewers who provide timely, thorough peer-review reports receive vouchers entitling them to a discount on the APC of their next publication in any MDPI journal, in appreciation of the work done.
- Sections: published in 14 topical sections.
- Testimonials: See what our editors and authors say about Coatings.
Impact Factor:
2.9 (2023);
5-Year Impact Factor:
3.1 (2023)
Latest Articles
Correction: Zhao et al. Plasma Spraying NiCoCrAlY-Cr2O3-AgMo Coatings: Fabrication and Tribological Mechanisms. Coatings 2024, 14, 1233
Coatings 2024, 14(12), 1477; https://doi.org/10.3390/coatings14121477 (registering DOI) - 22 Nov 2024
Abstract
In the published paper [...]
Full article
Open AccessArticle
Microstructure and Tribological Properties of FeCrCoMnSix High-Entropy Alloy Coatings
by
Shuling Zhang, Di Jiang, Shengdi Sun and Bo Zhang
Coatings 2024, 14(12), 1476; https://doi.org/10.3390/coatings14121476 (registering DOI) - 22 Nov 2024
Abstract
For shaft parts, 45 steel has been widely used due to its favorable mechanical properties and low cost. However, the relatively low wear resistance of 45 steel limits its application. In this work, high-entropy alloy of FeCrCoMnSix (x = 0, 0.3, 0.6,
[...] Read more.
For shaft parts, 45 steel has been widely used due to its favorable mechanical properties and low cost. However, the relatively low wear resistance of 45 steel limits its application. In this work, high-entropy alloy of FeCrCoMnSix (x = 0, 0.3, 0.6, 0.9, 1) coatings were prepared on the surface of a 45 steel substrate using laser cladding technology to improve the wear performance of 45 steel. The effect of the Si element on the microstructure and tribological property of these coatings is investigated. The results show that the structure of FeCrCoMn coatings is mainly an FCC + HCP dual-phase solid solution, grown in equiaxial crystals. When a small amount of Si (x = 0.3) is added, the BCC phase is generated in the coating; meanwhile, the microstructure is transformed into the divorced eutectic character. When the content of Si is x = 0.6, the eutectic structure is promoted, and the microstructure is refined and becomes denser. When the content of Si increases to x = 0.9 and 1.0, the metal silicate phase containing Mn and Cr is formed due to the precipitation of supersaturated solid solution. At the same time, the microstructure is transformed into dendritic crystals due to the composition super-cooling effect by the excessive Si element, inducing serious element segregation. The hardness of FeCrCoMnSix high-entropy alloy coatings increases to 425.8 HV when the Si content is 0.6 under the synergistic effect of the solid-solution and dense eutectic structure. The friction and wear analysis shows that the friction and wear mechanisms of the coating are mainly abrasive wear and oxidative wear. The coefficient of friction and the wear rate of the FeCrCoMnSix high-entropy alloy coating decreases to 0.202 and 4.06 × 10⁻⁵ mm3/N·m, respectively, when the content of Si is 0.6 due to the dense microstructure and high hardness. The above studies prove that the presence of Si in the FeCrCoMnSi0.6 high-entropy alloy coating induces a refined eutectic microstructure and improves the coating’s anti-wear properties by increasing hardness and decreasing the coefficient of friction.
Full article
(This article belongs to the Section Laser Coatings)
►▼
Show Figures
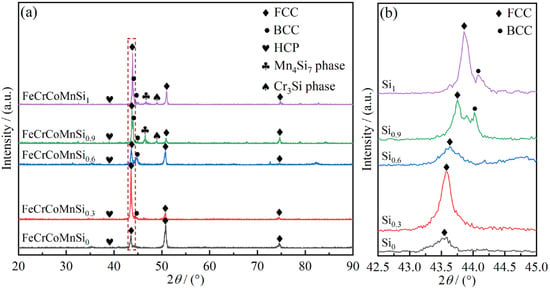
Figure 1
Figure 1
<p>XRD patterns of the FeCrCoMnSi<sub>x</sub> HEAs coating: (<b>a</b>) XRD pattern of the coatings; (<b>b</b>) magnification of the localized FCC phase.</p> Full article ">Figure 2
<p>Cross-sectional morphology of the FeCrCoMnSi<sub>x</sub> HEAs coating: (<b>a</b>) x = 0; (<b>b</b>) x = 0.3; (<b>c</b>) x = 0.6; (<b>d</b>) x = 0.9; (<b>e</b>) x = 1.0.</p> Full article ">Figure 3
<p>SEM diagram of the surface micro structure of the FeCrCoMnSi<sub>x</sub> HEAs coating: (<b>a</b>) x = 0; (<b>b</b>) x = 0.3; (<b>c</b>) x = 0.6; (<b>d</b>) x = 0.9; (<b>e</b>) x = 1.0.</p> Full article ">Figure 4
<p>The EDS results of FeCrCoMnSi<sub>x</sub> HEAs coating: (<b>a</b>) x = 0; (<b>b</b>) x = 0.3; (<b>c</b>) x = 0.6; (<b>d</b>) x = 0.9; (<b>e</b>) x = 1.0.</p> Full article ">Figure 5
<p>Hardness of the FeCrCoMnSi<sub>x</sub> HEAs coating: (<b>a</b>) hardness distribution curves; (<b>b</b>) average hardness of the coating surface.</p> Full article ">Figure 6
<p>Coefficient of friction and wear rate of the FeCrCoMnSi<sub>x</sub> HEAs coating: (<b>a</b>) coefficient of friction; (<b>b</b>) wear rate.</p> Full article ">Figure 7
<p>The three-dimensional contours topographies of the worn scars for the FeCrCoMnSi<sub>x</sub> HEAs coating: (<b>a</b>) x = 0; (<b>b</b>) x = 0.3; (<b>c</b>) x = 0.6; (<b>d</b>) x = 0.9; (<b>e</b>) x = 1.0.</p> Full article ">Figure 8
<p>The micro-wear morphology of the FeCrCoMnSi<sub>x</sub> HEAs coating: (<b>a</b>) x = 0; (<b>b</b>) x = 0.3; (<b>c</b>) x = 0.6; (<b>d</b>) x = 0.9; (<b>e</b>) x = 1.0; (<b>a1</b>–<b>e1</b>) Small multiple wear morphology.</p> Full article ">Figure 9
<p>O element distribution on the worn surface of the FeCrCoMnSi<sub>x</sub> HEAs coating: (<b>a</b>) x = 0; (<b>b</b>) x = 0.3; (<b>c</b>) x = 0.6; (<b>d</b>) x = 0.9; (<b>e</b>) x = 1.0.</p> Full article ">Figure 10
<p>The element distribution on the worn surface of the FeCrCoMnSi<sub>x</sub> HEAs coating.</p> Full article ">
Open AccessReview
Solid–Liquid Composite Lubrication (SLCL) Based on Diamond-Like Carbon (DLC) Coatings and Lubricating Oils: Properties and Challenges
by
Wei Qi, Lei Chen, Hui Li, Lieming Tang and Zhiliang Xu
Coatings 2024, 14(12), 1475; https://doi.org/10.3390/coatings14121475 - 21 Nov 2024
Abstract
►▼
Show Figures
In the field of industrial lubrication, solid–liquid composite lubrication (SLCL) techniques based on diamond-like carbon (DLC) coatings and lubricating oils are emerging recently, which may be applied in many fields in the near future, especially automotive industries. The tribological behaviors of SLCL systems
[...] Read more.
In the field of industrial lubrication, solid–liquid composite lubrication (SLCL) techniques based on diamond-like carbon (DLC) coatings and lubricating oils are emerging recently, which may be applied in many fields in the near future, especially automotive industries. The tribological behaviors of SLCL systems depend strongly on the compatibility between DLC coatings and oils. This review describes the advantages of SLCL techniques by pointing out the synergistic effects between DLC coatings and lubricating oils. Then the main factors determining the tribological performance of SLCL systems are discussed in detail. Finally, a conclusion about the characteristics of reported SLCL systems is made, and a prospect about the potential development of SLCL technology is proposed. On the basis of the relevant literature, it could be found that the tribological properties of SLCL systems were influenced by many more factors compared with individual DLC lubrication or individual oil lubrication due to the complicated tribo-chemical reactions involving DLC and oil during friction. And under some optimized working conditions, the tribological performances of SLCL systems (friction and wear reduction) are superior to individual DLC lubrication and individual oil lubrication. However, the tribological performance of SLCL systems needs to be further improved (for example, to achieve superlubricity and ultra-low wear simultaneously) by adjusting the structures of DLC coatings, regulating the compositions of oils, and most importantly, enhancing the physicochemical and tribological synergies between DLC coatings and oils. This review provides a comprehensive understanding of the SLCL technology, which may be very helpful for the researchers and engineers in the field of industrial lubrication and tribology.
Full article
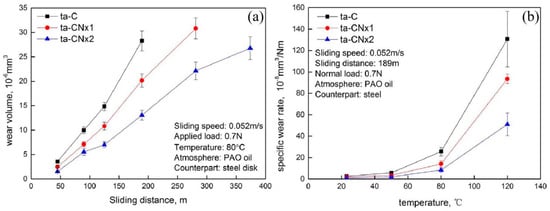
Figure 1
Figure 1
<p>Wear properties of ta-C and ta-CNx coatings against steel under PAO base oil as a function of sliding distance (<b>a</b>) and as a function of oil temperature (<b>b</b>) [<a href="#B65-coatings-14-01475" class="html-bibr">65</a>].</p> Full article ">Figure 2
<p>Comparison of composite wear coefficients for different types of DLC/DLC tribo-pairs tested in base oil (an API group III oil) and ZDDP solution. DLC 1 is a-C, DLC 2~6 mean a-C:H coatings with increasing hydrogen concentrations (17~25 at.%), and DLC 7~10 mean a-C:H:W coatings with a fixed hydrogen concentration (15 at.%) and increasing W concentrations (12~21 at.%) [<a href="#B58-coatings-14-01475" class="html-bibr">58</a>].</p> Full article ">Figure 3
<p>Schematic flow diagram for the DLC/substrate interface functionalization: (<b>a</b>) HSS substrate with an adhesion layer Cr/WC/W, (<b>b</b>) drop cast spin coating of GNP suspension on the surface (GNP was dispersed in N-methyl-2-pyrrolidone, NMP), (<b>c</b>) Teflon tape pressed on the GNP-coated surface and then heated at 200 °C for 3 h to improve the adhesion of GNP to the substrate, (<b>d</b>) tape removal, (<b>e</b>) DLC deposition by PECVD, and (<b>f</b>) the structure of the product in which the DLC/substrate interface was functionalized by GNP discrete islands [<a href="#B90-coatings-14-01475" class="html-bibr">90</a>].</p> Full article ">Figure 4
<p>Composite wear of DLC/DLC tribo-pairs (<b>left</b>) and DLC/steel tribo-pairs (<b>right</b>) tested in base oil (BO) and MoDTC solutions [<a href="#B111-coatings-14-01475" class="html-bibr">111</a>].</p> Full article ">Figure 5
<p><span class="html-italic">I</span><sub>D</sub>/<span class="html-italic">I</span><sub>G</sub> ratios, wear widths of the coatings, and COF of the DLC coating/steel pairs lubricated by PAO, PAO+MoDTC, or PAO+MoDTC+ZDDP as a function of sliding time [<a href="#B113-coatings-14-01475" class="html-bibr">113</a>].</p> Full article ">Figure 6
<p>Schematic diagram of the mechanism of the wear acceleration of a-C:H films lubricated with MoDTC solution. In the right image, part (1) means the tribochemical reactions between Mo and DLC surfaces produce both graphitic carbons and Mo-carbides; part (2) means the hard Mo-carbides lead to the abrasive wear of DLC films [<a href="#B116-coatings-14-01475" class="html-bibr">116</a>].</p> Full article ">Figure 7
<p>Schematic diagram of the MoDTC-induced wear mechanisms. (1) and (2) represent the first and the second stage of the wear mechanism. CI means cast iron, and a-C:15H represents 15 at.% hydrogenated DLC. The plate is made of high-speed steel [<a href="#B117-coatings-14-01475" class="html-bibr">117</a>].</p> Full article ">Figure 8
<p>Schematic diagrams of the wear acceleration mechanism of a-C:H films lubricated with MoDTC solution and the inhibiting action of ZDDP on the wear acceleration [<a href="#B113-coatings-14-01475" class="html-bibr">113</a>].</p> Full article ">Figure 9
<p>Schematic representation of interaction mechanism for IL on the W-DLC surface [<a href="#B131-coatings-14-01475" class="html-bibr">131</a>].</p> Full article ">
Open AccessArticle
Comprehensive Study on the Thrust Estimation and Anti-Freezing Lubricant of Pipe Jacking in Frozen Soil
by
Kai Wen, Wei Zeng, Qing Ye, Hideki Shimada, Siliang Qin and Benhao Fu
Coatings 2024, 14(12), 1474; https://doi.org/10.3390/coatings14121474 - 21 Nov 2024
Abstract
Recent advancements in underground construction have led to the widespread utilization of pipe jacking. However, the engineering challenges posed by frozen ground in pipe jacking projects have not been extensively studied. This research aims to address the critical challenges linked to employing pipe
[...] Read more.
Recent advancements in underground construction have led to the widespread utilization of pipe jacking. However, the engineering challenges posed by frozen ground in pipe jacking projects have not been extensively studied. This research aims to address the critical challenges linked to employing pipe jacking in frozen ground for underground construction. It is widely recognized that the accurate calculation of jacking thrust and mitigation of pipe–soil interaction plays a crucial role in determining the success or failure of pipe jacking operations. To explore these issues, this study conducted numerical simulations and comparative analyses, considering various factors such as soil properties, geometric dimensions, and burial depth, to assess their influence on jacking thrust. Additionally, the study also examines the freeze–thaw effect on concrete pipes and the injected lubricant. The results indicate that the numerical model, which considers the temperature effects and static friction instead of sliding friction, provides a more reliable estimation of jacking thrust in frozen ground compared to traditional theoretical models. Furthermore, the freezing point depression method was successfully employed in the development of an anti-freezing lubricant, which can effectively reduce pipe–soil interaction even at extremely low temperatures of up to −10 °C.
Full article
(This article belongs to the Section Environmental Aspects in Colloid and Interface Science)
►▼
Show Figures
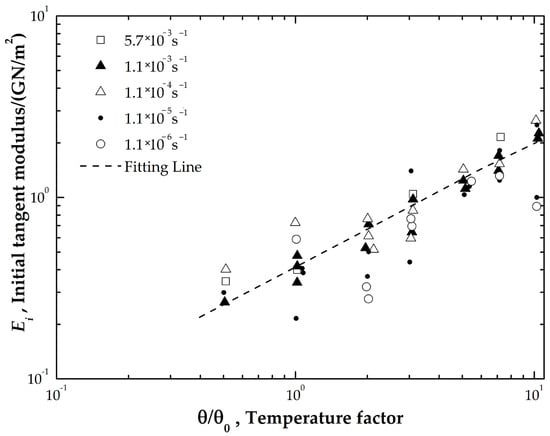
Figure 1
Figure 1
<p>Initial tangent modulus vs. temperature in logarithm [<a href="#B22-coatings-14-01474" class="html-bibr">22</a>].</p> Full article ">Figure 2
<p>Schematic diagram of pipe–soil interaction.</p> Full article ">Figure 3
<p>Contact between frozen soil and concrete pipe. (<b>a</b>) Full contact, (<b>b</b>) half contact and (<b>c</b>) one-third contact.</p> Full article ">Figure 4
<p>Numerical models. (<b>a</b>) Thermal model, (<b>b</b>) perspective view, (<b>c</b>) front view, and (<b>d</b>) contact interface.</p> Full article ">Figure 5
<p>Jacking force vs. distance under full-contact conditions. (<b>a</b>) Temperature, (<b>b</b>) cohesion, (<b>c</b>) friction angle, (<b>d</b>) diameter and (<b>e</b>) cover depth.</p> Full article ">Figure 5 Cont.
<p>Jacking force vs. distance under full-contact conditions. (<b>a</b>) Temperature, (<b>b</b>) cohesion, (<b>c</b>) friction angle, (<b>d</b>) diameter and (<b>e</b>) cover depth.</p> Full article ">Figure 6
<p>Relationships between thrust force and influencing factors with three contact ranges. (<b>a</b>–<b>c</b>) Temperature, (<b>d</b>–<b>f</b>) cohesion, (<b>g</b>–<b>i</b>) friction angle, (<b>j</b>–<b>l</b>) diameter, and (<b>m</b>–<b>o</b>) cover depth.</p> Full article ">Figure 6 Cont.
<p>Relationships between thrust force and influencing factors with three contact ranges. (<b>a</b>–<b>c</b>) Temperature, (<b>d</b>–<b>f</b>) cohesion, (<b>g</b>–<b>i</b>) friction angle, (<b>j</b>–<b>l</b>) diameter, and (<b>m</b>–<b>o</b>) cover depth.</p> Full article ">Figure 7
<p>Relationships between maximum jacking length and influencing factors with three contact ranges. (<b>a</b>) Temperature, (<b>b</b>) cohesion, (<b>c</b>) friction angle, (<b>d</b>) diameter and (<b>e</b>) cover depth.</p> Full article ">Figure 8
<p>Comparative analysis between numerical and theoretical results. (<b>a</b>) Without and (<b>b</b>) with lubricant.</p> Full article ">Figure 8 Cont.
<p>Comparative analysis between numerical and theoretical results. (<b>a</b>) Without and (<b>b</b>) with lubricant.</p> Full article ">Figure 9
<p>Temperature distribution. (<b>a</b>) Without thawing effect, (<b>b</b>) with thawing effect.</p> Full article ">Figure 10
<p>Comparative analysis of jacking force and maximum jacking length with and without thawing effect. (<b>a</b>,<b>d</b>) Full contact, (<b>b</b>,<b>e</b>) half contact, and (<b>c</b>,<b>f</b>) one-third contact.</p> Full article ">Figure 11
<p>Phase diagram showing the effect of a nonvolatile solute on freezing point and boiling point [<a href="#B37-coatings-14-01474" class="html-bibr">37</a>].</p> Full article ">Figure 12
<p>Relationship between temperature and molarity of sodium chloride.</p> Full article ">Figure 13
<p>Experimental devices. (<b>a</b>) Temperature and humidity chamber and (<b>b</b>) viscometer.</p> Full article ">Figure 14
<p>Relationship between gelling time and temperature.</p> Full article ">Figure 15
<p>Viscosity of developed anti-freezing lubricant with (<b>a</b>) No NaCl, (<b>b</b>) 1.34 mol/Kg of NaCl, and (<b>c</b>) 2.69 mol/Kg of NaCl.</p> Full article ">Figure 15 Cont.
<p>Viscosity of developed anti-freezing lubricant with (<b>a</b>) No NaCl, (<b>b</b>) 1.34 mol/Kg of NaCl, and (<b>c</b>) 2.69 mol/Kg of NaCl.</p> Full article ">Figure 16
<p>The gelling states with different sodium chloride concentrations.</p> Full article ">
Open AccessArticle
TiO2 Coated with Carbon via Chemical Vapor Deposition as Li-Ion Batteries Anode
by
Bin Zhu, Wenjun Li, Wu Tang and Hui Tang
Coatings 2024, 14(11), 1473; https://doi.org/10.3390/coatings14111473 - 20 Nov 2024
Abstract
With the increasing demand for renewable energy and sustainable technologies, lithium-ion batteries (LIBs) have become crucial energy storage components. Despite the promising properties of the high capacity and stability of TiO2, its large-scale application as an anode for LIBs is hindered
[...] Read more.
With the increasing demand for renewable energy and sustainable technologies, lithium-ion batteries (LIBs) have become crucial energy storage components. Despite the promising properties of the high capacity and stability of TiO2, its large-scale application as an anode for LIBs is hindered by challenges like poor conductivity and volumetric changes during cycling. Here, a rutile TiO2 composite material with a thinned carbon coating (TiO2@TC) was synthesized through chemical vapor deposition (CVD) and a subsequent annealing process, which significantly improved the reversibility, cycling stability, and rate performance of the TiO2 anode materials. The thickness of the carbon layer on TiO2 was precisely controlled and thinned from 4.2 nm to 1.9 nm after secondary annealing treatment, leading to a smaller steric hindrance and an improved conductivity while serving as protective coatings by preventing the electrochemical degradation of the TiO2 surface and hindering volumetric changes during cycling. The resulting TiO2@TC with the thin carbon layer demonstrated a high specific capacity of 167 mAh g−1 at 0.5 C in Li-based half cells, which could stably run for 200 cycles with nearly 100% capacity retention. The thin carbon layer also contributes to an improved rate performance of 90 mAh g−1 at even 20 C. This work provides an innovational strategy for improving the conductivity and volumetric changes during the cycling of TiO2 anodes.
Full article
(This article belongs to the Special Issue Recent Progress in Advanced Materials for Solid-State Lithium Batteries)
►▼
Show Figures
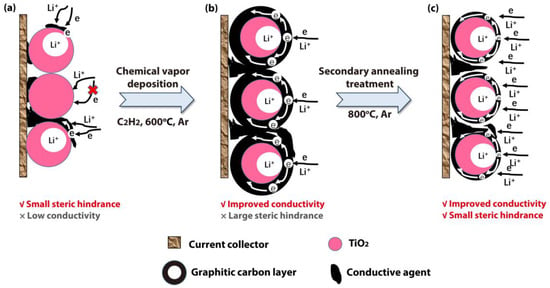
Figure 1
Figure 1
<p>Reaction mechanism of (<b>a</b>) TiO<sub>2</sub>, (<b>b</b>) TiO<sub>2</sub>@C, and (<b>c</b>) TiO<sub>2</sub>@TC in electrochemical reactions.</p> Full article ">Figure 2
<p>(<b>a</b>) The XRD spectra of TiO<sub>2</sub>, TiO<sub>2</sub>@C, and TiO<sub>2</sub>@TC; (<b>b</b>) the fine XRD spectra of the (110) and (101 peaks) in TiO<sub>2</sub>, TiO<sub>2</sub>@C, and TiO<sub>2</sub>@TC.</p> Full article ">Figure 3
<p>(<b>a</b>) The Raman spectra of TiO<sub>2</sub>, TiO<sub>2</sub>@C, and TiO<sub>2</sub>@TC; (<b>b</b>) the fine Raman spectra of the D and G bands in TiO<sub>2</sub>@C and TiO<sub>2</sub>@TC.</p> Full article ">Figure 4
<p>The SEM images of (<b>a</b>) TiO<sub>2</sub>, (<b>b</b>) TiO<sub>2</sub>@C, and (<b>c</b>) TiO<sub>2</sub>@TC; the TEM results of (<b>d</b>,<b>e</b>) TiO<sub>2</sub>@C and (<b>f</b>,<b>g</b>) TiO<sub>2</sub>@TC.</p> Full article ">Figure 5
<p>Electrochemical performance of the TiO<sub>2</sub>@TC anode in Li-based half cells: (<b>a</b>) the CV curves at 0.2 mV s<sup>−1</sup> in 1.0–3.0 V; (<b>b</b>) the charge–discharge curves at different current densities; (<b>c</b>) the charge–discharge curve at 0.5 C; (<b>d</b>) the long-cycle profiles at 0.5 C; (<b>e</b>) the rate performance; (<b>f</b>) the EIS tests for TiO<sub>2</sub>, TiO<sub>2</sub>@C, and TiO<sub>2</sub>@TC.</p> Full article ">
Open AccessArticle
The Influence of Nano-Silicon Carbide on the Properties of Aluminum Alloy Under Salt Dry–Wet Alternations
by
Shengpeng Song, Chuanyuan Liu, Wentao Chen, Zhen Wang, Chuanyin Wang, Zihao Cao, Hui Wang and Feiting Shi
Coatings 2024, 14(11), 1472; https://doi.org/10.3390/coatings14111472 - 20 Nov 2024
Abstract
In this study, the influence of silicon carbide on an aluminum alloy’s yield tensile strength, ultimate tensile strength, compressive strength, tensile toughness and impact toughness were investigated. Meanwhile, the aluminum alloy specimens were exposed to the dry–wet alternations with a 3% NaCl solution
[...] Read more.
In this study, the influence of silicon carbide on an aluminum alloy’s yield tensile strength, ultimate tensile strength, compressive strength, tensile toughness and impact toughness were investigated. Meanwhile, the aluminum alloy specimens were exposed to the dry–wet alternations with a 3% NaCl solution or 3% Na2SO4 solution. Scanning electron microscope (SEM) photos and scanning electron microscopy energy spectra (SEM-EDS) were obtained. The results indicate that the silicon carbide with a mass ratio of 0%~8% of the total mass of the aluminum alloy can increase the yield tensile strength, the ultimate tensile strength, and the compressive strength by rates of 0%~30.4%, 0%~14.1% and 0%~13.1%. However, when the mass ratio of the silicon carbide increased from 8% to 10%, the yield tensile strength, the ultimate tensile strength and the compressive strength decreased by rates of 0%~3.2%, 0%~2.6% and 0%~0.43%. The tensile toughness and the impact toughness decreased when silicon carbide was added, with reduction rates of 0%~15.3% and 0%~12.8%. The NaCl dry–wet alternations led to decreases in the yield tensile strength, the ultimate tensile strength, the compressive strength, the tensile toughness and the impact toughness by rates of 0%~7.3%, 0%~6.7%, 0%~13.9%, 0%~12.7% and 0%~11.2%, respectively. After the Na2SO4 dry–wet alternations, the corresponding decreasing rates were 0%~5.1%, 0%~5.4%, 0%~1.73%, 0%~11.4% and 0%~9.7%. The addition of silicon carbide resulted in a decrease in the effect on the mechanical strength by the NaCl and Na2SO4 dry–wet alternations. The elements carbon, oxygen, magnesium, aluminum and silicon were observed in the aluminum alloy. The structures of the aluminum alloy with 8% silicon carbide were the highest.
Full article
(This article belongs to the Special Issue Mechanical Properties and Tribological Behavior of Alloy/Coatings, 2nd Edition)
►▼
Show Figures
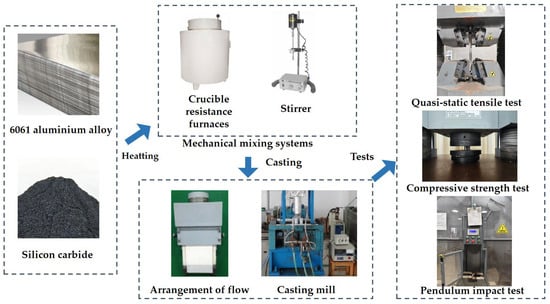
Figure 1
Figure 1
<p>The preparation procedure.</p> Full article ">Figure 2
<p>The dimensions of the specimens.</p> Full article ">Figure 3
<p>The equipment used for the pendulum impact test.</p> Full article ">Figure 4
<p>The aluminum alloy’s yield and ultimate tensile strengths. (<b>a</b>) The yield tensile strength. (<b>b</b>) Decreasing rate of yield tensile strength. (<b>c</b>) The ultimate tensile strength. (<b>d</b>) Decreasing rate of yield ultimate strength.</p> Full article ">Figure 5
<p>The aluminum alloy’s compressive strength. (<b>a</b>) The compressive strength. (<b>b</b>) Decreasing rate of compressive strength.</p> Full article ">Figure 6
<p>The aluminum alloy’s compressive strength (<b>a</b>) before dry–wet alternations; (<b>b</b>) after NaCl dry–wet alternations; (<b>c</b>) after Na<sub>2</sub>SO<sub>4</sub> dry–wet alternations.</p> Full article ">Figure 7
<p>The aluminum alloy’s tensile toughness. (<b>a</b>) The tensile toughness. (<b>b</b>) Decreasing rate of tensile toughness.</p> Full article ">Figure 8
<p>The aluminum alloy’s impact toughness. (<b>a</b>) The impact toughness. (<b>b</b>) Decreasing rate of impact toughness.</p> Full article ">Figure 9
<p>The aluminum alloy’s mass loss rate vs. the mass ratio of SiC after 30 dry–wet alternations with NaCl or Na<sub>2</sub>SO<sub>4</sub> solution.</p> Full article ">Figure 10
<p>The SEM photos of the aluminum alloy with silicon carbide. (<b>a</b>) Specimen with 2% silicon carbide. (<b>b</b>) Specimen with 8% silicon carbide. (<b>c</b>) Specimen with 10% silicon carbide.</p> Full article ">Figure 11
<p>The SEM-EDS photos of the aluminum alloy with silicon carbide. (<b>a</b>) Specimen with 2% silicon carbide. (<b>b</b>) Specimen with 8% silicon carbide. (<b>c</b>) Specimen with 10% silicon carbide.</p> Full article ">
Open AccessArticle
Preparation and Properties of Thick Tungsten Coating Electrodeposited from Na2WO4-WO3-KCl-NaF Molten Salt System
by
Yusha Li, Xiaoxu Dong, Qing Liu, Yajie You, Zeyu Gao and Yingchun Zhang
Coatings 2024, 14(11), 1471; https://doi.org/10.3390/coatings14111471 - 20 Nov 2024
Abstract
The pulsed current electrodeposition method was employed for the first time to achieve tungsten coating with a thickness of 433.72 μm on a CuCrZr alloy from Na2WO4-WO3-KCl-NaF molten salt. The microstructure of the coating was observed and
[...] Read more.
The pulsed current electrodeposition method was employed for the first time to achieve tungsten coating with a thickness of 433.72 μm on a CuCrZr alloy from Na2WO4-WO3-KCl-NaF molten salt. The microstructure of the coating was observed and the coating density, porosity, hardness, bonding strength, residual stress and oxygen content were tested. The results revealed that the tungsten coating exhibited desirable characteristics such as high density, absence of impurities, excellent adhesion to the matrix (53.16 MPa), residual compressive stress as surface stress, and good stability and durability. Moreover, this thick tungsten coating possesses high density and hardness, low oxygen content and porosity. This offers a novel solution to solve the challenging issue of the connection between tungsten material and heat sink material.
Full article
(This article belongs to the Special Issue New Functional Coatings and Thin Films for Sensor and Green Energy Technologies)
►▼
Show Figures
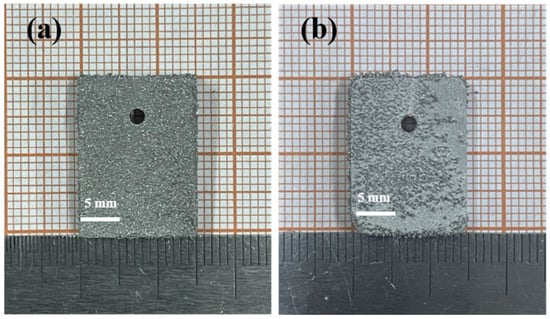
Figure 1
Figure 1
<p>Macroscopic morphology of tungsten coatings at different deposition times: (<b>a</b>) 50 h, (<b>b</b>) 100 h.</p> Full article ">Figure 2
<p>Surface SEM images of the tungsten coatings at different deposition times: (<b>a</b>) 50 h, (<b>b</b>) 100 h.</p> Full article ">Figure 3
<p>Laser confocal image of tungsten coating surface: (<b>a</b>) 50 h, 2D, (<b>b</b>) 50 h, 3D, (<b>c</b>) 100 h, 2D, (<b>d</b>) 100 h, 3D.</p> Full article ">Figure 4
<p>XRD patterns of tungsten coatings at different deposition times: (<b>a</b>) 50 h, (<b>b</b>) 100 h.</p> Full article ">Figure 5
<p>Cross-sectional SEM images of tungsten coatings at different deposition times: (<b>a</b>) 50 h, (<b>b</b>) 100 h.</p> Full article ">Figure 6
<p>The sectional line scanning of the coating obtained after 100 h.</p> Full article ">Figure 7
<p>Linear fitting curve of peak 2θ and sin<sup>2</sup>(Ψ).</p> Full article ">
Open AccessArticle
Effect of Humidity on Interfacial Debonding Behavior Between Larger Graphene Sheet and Cement-Based Composites
by
Yongliang Han, Yongzhe Zhao, Yijie Wang and Tong Chen
Coatings 2024, 14(11), 1470; https://doi.org/10.3390/coatings14111470 - 20 Nov 2024
Abstract
This paper investigates the interface debonding behavior of graphene (G) on a calcium silicate hydrate (C-S-H) substrate using molecular dynamics (MD) simulations. The effect of interfacial water content on the debonding behavior of graphene on cement-based composites was studied. Simulation results reveal that
[...] Read more.
This paper investigates the interface debonding behavior of graphene (G) on a calcium silicate hydrate (C-S-H) substrate using molecular dynamics (MD) simulations. The effect of interfacial water content on the debonding behavior of graphene on cement-based composites was studied. Simulation results reveal that there is only a van der Waals force between G and C-S-H; the interface bonding strength is weak; and the debonding properties (maximum peeling force (Fmax) and work (W)) are low. The debonding energy of graphene decreases with an increase in interfacial water content, indicating that water intrusion will weaken the binding effect of G and C-S-H, and reduce the difficulty of graphene’s debonding on a C-S-H substrate. Exploring the adhesion behavior of graphene on C-S-H under the influence of humidity at the nanoscale is of great significance for understanding the basic adhesion mechanism, optimizing composite material properties, and promoting the development of related disciplines.
Full article
(This article belongs to the Special Issue Recent Progress in Surface and Interface Properties of Nanostructures)
►▼
Show Figures
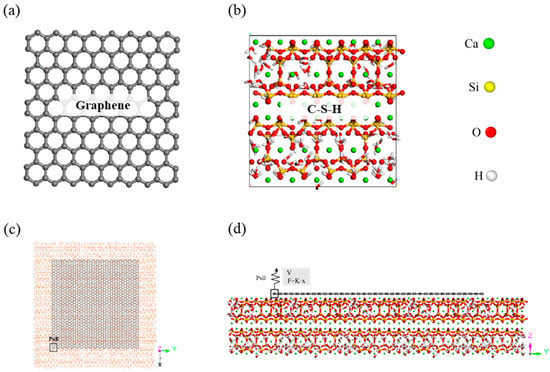
Figure 1
Figure 1
<p>Atomic structures of (<b>a</b>) the graphene sheet, (<b>b</b>) C-S-H gel model, (<b>c</b>) debonding model—top view, and (<b>d</b>) debonding model—front view.</p> Full article ">Figure 2
<p>Schematic diagram of detachment model of G on C-S-H substrate. The yellow area is the C-S-H substrate, the gray area is the graphene layer, and the stress area is indicated by the red arrow.</p> Full article ">Figure 3
<p>(<b>a</b>) Atomic density distribution of G and C-S-H composites along the z direction, (<b>b</b>) G interface structure.</p> Full article ">Figure 4
<p>(<b>a</b>) Change of <span class="html-italic">F</span> with time, (<b>b</b>) change of <span class="html-italic">W</span> with time. Gray is graphene, which undergoes the following four processes on a CSH substrate, a: flat spreading, b: slow peeling of the plane, c: edge peeling, and d: complete peeling.</p> Full article ">Figure 5
<p>(<b>a</b>) Change of potential energy with time, (<b>b</b>) binding energy and binding energy decomposition of G/C-S-H.</p> Full article ">Figure 6
<p>Initial structure of (<b>a</b>) a dry condition model, (<b>b</b>) one-layer water molecular model, (<b>c</b>) two-layers water molecular model, and (<b>d</b>) three-layers water molecular model. Graphene is gray, which is on a C-S-H substrate.</p> Full article ">Figure 7
<p>(<b>a</b>) Change of <span class="html-italic">F</span> with time and (<b>b</b>) change of <span class="html-italic">W</span> with time under different water contents.</p> Full article ">Figure 8
<p>(<b>a</b>) <span class="html-italic">F</span><sub>max</sub> and (<b>b</b>) <span class="html-italic">W</span><sub>max</sub> at different water contents.</p> Full article ">
Open AccessArticle
Ball-on-Disk Wear Maps for Bearing Steel–Hard Anodized EN AW-6082 Aluminum Alloy Tribocouple in Dry Sliding Conditions
by
Enrico Baroni, Annalisa Fortini, Lorenzo Meo, Chiara Soffritti, Mattia Merlin and Gian Luca Garagnani
Coatings 2024, 14(11), 1469; https://doi.org/10.3390/coatings14111469 - 19 Nov 2024
Abstract
In recent years, Golden Hard Anodizing (G.H.A.®) has been developed as a variant of the traditional hard anodizing process with the addition of Ag+ ions in the nanoporous structure. The tribological properties of this innovative surface treatment are still not
[...] Read more.
In recent years, Golden Hard Anodizing (G.H.A.®) has been developed as a variant of the traditional hard anodizing process with the addition of Ag+ ions in the nanoporous structure. The tribological properties of this innovative surface treatment are still not well understood. In this study, ball-on-disk tests were conducted in dry sliding conditions using 100Cr6 (AISI 52100) bearing steel balls as a counterbody and GHA®-anodized EN AW-6082 aluminum alloy disks. The novelty of this work lies in the mapping of the wear properties of the tribocouple under different test conditions for a better comparison of the results. Three different normal loads (equal to 5, 10, and 15 N) and three different reciprocating frequencies (equal to 2, 3, and 4 Hz) were selected to investigate a spectrum of operating conditions for polished and unpolished G.H.A.®-anodized EN AW-6082 aluminum alloy. Quantitative wear maps were built based on the resulting wear rate values to define the critical operating limits of the considered tribocouple. The results suggest that the coefficient of friction (COF) was independent of test conditions, while different wear maps were found for polished and non-polished surfaces. Polishing before anodizing permitted the acquisition of lower wear for the anodized disks and the steel balls.
Full article
(This article belongs to the Special Issue Mechanical Properties and Tribological Behavior of Alloy/Coatings, 2nd Edition)
►▼
Show Figures
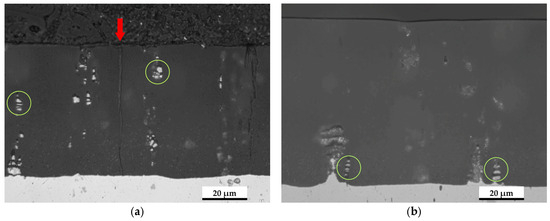
Figure 1
Figure 1
<p>Optical micrographs in cross-section of the anodized layers before wear tests for (<b>a</b>) UP. (<b>b</b>) P.</p> Full article ">Figure 2
<p>COF evolution during distance for UP (unpolished substrate) and P (previously polished substrate) anodic layers at the different investigated loads: (<b>a</b>) 5 N, (<b>b</b>) 10 N, and (<b>c</b>) 15 N.</p> Full article ">Figure 3
<p>Representative VPSEM micrographs of wear tracks of the G.H.A.<sup>®</sup>-anodized disk (<b>a</b>) after 50 m, (<b>b</b>) after 100 m, (<b>c</b>) after 150 m, and (<b>d</b>) after 200 m. The orange arrow indicates the direction of reciprocating sliding.</p> Full article ">Figure 4
<p>VPSEM micrograph at high magnification of the wear tracks of the disk together with semi-quantitative EDS spectra (<b>a</b>). The solid red arrow indicates the area of revelation for the semi-quantitative EDS analysis (<b>b</b>). The red-edged arrow indicates the new deposition of material, while the yellow-edged arrow indicates the removal of a part of the anodic layer with its corresponding EDS spectra (<b>c</b>).</p> Full article ">Figure 5
<p>Contact pressure evolution during sliding distance for the different applied loads: (<b>a</b>) 5 N, (<b>b</b>) 10 N, and (<b>c</b>) 15 N. <span class="html-italic">Y</span>-axis is reported in logarithmic scale.</p> Full article ">Figure 6
<p>Worn volume of material from both the counterbodies at the different investigated loads in the case of sliding against UP samples together with a shape factor for the wear scar diameters on the 100Cr6 steel balls at (<b>a</b>) 5 N, (<b>b</b>) 10 N, and (<b>c</b>) 15 N.</p> Full article ">Figure 7
<p>Quantitative wear maps for 100Cr6 ball and UP anodized disks.</p> Full article ">Figure 8
<p>Worn volume of material from both the counterbodies at the different investigated loads in the case of sliding against P samples together with a shape factor for the wear scar diameters on the 100Cr6 steel balls at (<b>a</b>) 5 N, (<b>b</b>) 10 N, and (<b>c</b>) 15 N.</p> Full article ">Figure 9
<p>Quantitative wear maps for 100Cr6 ball and P anodized disks.</p> Full article ">
Open AccessArticle
Influence of Construction Process on Aggregate Spalling Behavior on Ultrathin Waterborne Epoxy Resin Layer
by
Jiaquan Yuan, Yifan Zhang, Haoyang Huang, Gang Zhou, Chaoliang Fu, Wenhong Duan, Weihong Jiang, Li Xiong, Huimei Li, Xiaohua Yang and Chuanqiang Li
Coatings 2024, 14(11), 1468; https://doi.org/10.3390/coatings14111468 - 18 Nov 2024
Abstract
The waterborne epoxy resin (WER) colored antiskid thin layer has been widely used in asphalt pavement to improve driving safety. The tectonic depth determines the antiskid performance of aparticle antiskid type thin layer. The spalling of aggregate from a thin layer may reduce
[...] Read more.
The waterborne epoxy resin (WER) colored antiskid thin layer has been widely used in asphalt pavement to improve driving safety. The tectonic depth determines the antiskid performance of aparticle antiskid type thin layer. The spalling of aggregate from a thin layer may reduce the tectonic depth, thus damaging antiskid performance. The spreading process of aggregate on the WER binder surface plays an important role in the spalling behavior of the thin layer. Herein, the influence of spreading processes on the ceramic aggregate spalling behavior on the WER thin layer was investigated based on laboratory experiments. The abrasion and British Pendulum Number (BPN) tests were employed to evaluate the antispalling and antiskid properties of the WER thin layers with different amounts of WER mortar, coverage rates of first-spread aggregate, and spreading orders of coarse/fine aggregates. Moreover, the tectonic depths of the layers before/after the spalling test were also investigated. The results indicated that the optimal dosage of WER mortar is 2.8 kg/m2. The WER thin layer exhibited better anti-striping property when coarse ceramic aggregate was spread first. The first-spread coverage rate of the aggregate on the WER surface is 70%. The thin layer exhibited a superior antispalling performance according to the resulting scheme, with a spalling rate of 3.77%. The tectonic depth only decreased from 1.87 to 1.80 mm after the spalling test.
Full article
(This article belongs to the Special Issue Green Asphalt Materials—Surface Engineering and Applications)
►▼
Show Figures
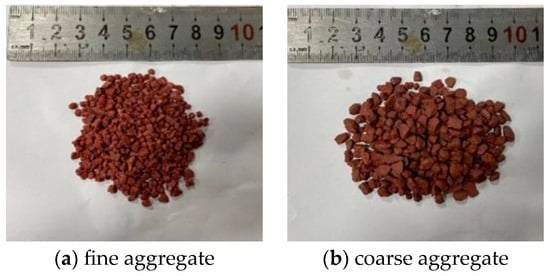
Figure 1
Figure 1
<p>Colored ceramic particles.</p> Full article ">Figure 2
<p>The photographs of WER thin layer specimens.</p> Full article ">Figure 3
<p>Spalling rate of the seven antiskid thin layer specimens after 5 min of abrasion.</p> Full article ">Figure 4
<p>Pendulum values of the antiskid thin layer specimens before (<b>a</b>) and after abrasion (<b>b</b>).</p> Full article ">Figure 5
<p>Texture depth of the antiskid thin layer specimens before (<b>a</b>) and after abrasion (<b>b</b>).</p> Full article ">Figure 6
<p>Spalling rate of the antiskid thin layer specimens under different coverage rate of the first-spread aggregate.</p> Full article ">Figure 7
<p>Pendulum values of the antiskid thin layer specimens before (<b>a</b>) and after abrasion (<b>b</b>).</p> Full article ">Figure 8
<p>Texture depth of the antiskid thin layer specimens before (<b>a</b>) and after abrasion (<b>b</b>).</p> Full article ">Figure 9
<p>Spalling rate of the antiskid thin layer specimens under different order of aggregate spreading. cx: spreading coarse aggregate first and then fine aggregate; xc: spreading fine aggregate first and then coarse aggregate.</p> Full article ">Figure 10
<p>Pendulum values of the thin layer specimens before (<b>a</b>) and after abrasion (<b>b</b>).</p> Full article ">Figure 11
<p>Texture depth of the antiskid thin layer specimens before (<b>a</b>) and after abrasion (<b>b</b>).</p> Full article ">
Open AccessArticle
Aloe Vera as a Printed Coating to Mitigate the Wear of Textiles
by
Michail Karypidis, Amalia Stalika, Maria Zarkogianni, Apostolos Korlos and Eleftherios G. Andriotis
Coatings 2024, 14(11), 1467; https://doi.org/10.3390/coatings14111467 - 18 Nov 2024
Abstract
Aloe vera is well known for its biological properties as a bioflavonoid anti-inflammatory and antibacterial agent. It has been used frequently in the food sector as a food coating due to its hygroscopic properties and as an ingredient in the lucrative cosmetic industry.
[...] Read more.
Aloe vera is well known for its biological properties as a bioflavonoid anti-inflammatory and antibacterial agent. It has been used frequently in the food sector as a food coating due to its hygroscopic properties and as an ingredient in the lucrative cosmetic industry. Studies have also included aloe vera as an eco-friendly green solution based on these properties. The current research focuses on the use of aloe vera gel in printing pastes as an alternative sustainable solution to synthetic thickeners, evaluating its wet performance and ease of fabric stitching, and has been inspired by studies that similarly used this substance and measured its effect on the fabric’s coefficient of friction and antimicrobial action. In the current study, printing pastes with natural colourants, such as saffron, curcumin, and annatto, and aloe vera gel thickener derived from natural leaves from Crete increased the fabric’s mechanical resistance to abrasion compared to the untreated pastes. The measured performance did not differ substantially from prints with traditional synthetic pastes, hence tolerating the substitution with the non-contaminant variant. The enhanced resistance to abrasion and wear extends the fabric’s serviceable life and resulting garments, decreasing the need for high industry processing volumes and, as a result, reducing pollution. The resistance to wear was evaluated using the dominant method in textile testing of the Martindale apparatus, which measured the cycles to failure, weight loss, and general appearance deterioration using the official photographic standards.
Full article
(This article belongs to the Special Issue Coatings for Antimicrobial Textiles)
►▼
Show Figures
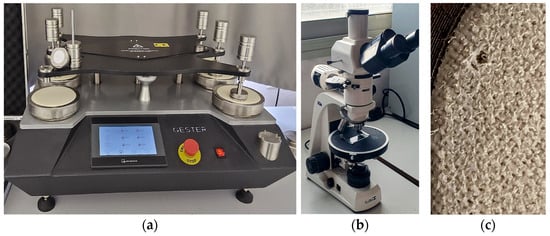
Figure 1
Figure 1
<p>Experimental set up of (<b>a</b>) abrasion resistance on Martindale abrasion apparatus, (<b>b</b>) microscope, and (<b>c</b>) test specimen failing point.</p> Full article ">Figure 2
<p>Abrasion resistance cycles to failure for knitted fabric.</p> Full article ">Figure 3
<p>Abrasion resistance cycles to failure for woven fabric.</p> Full article ">Figure 4
<p>Percentage mass loss due to abrasion for knitted fabric.</p> Full article ">Figure 5
<p>Percentage mass loss due to abrasion for woven fabric.</p> Full article ">Figure 6
<p>Surface fuzzing of fabric samples comes at a later stage in the coated samples. (<b>a</b>) Untreated knitted fabric; (<b>b</b>) printed knitted fabric; (<b>c</b>) untreated woven fabric; (<b>d</b>) printed woven fabric.</p> Full article ">Figure 7
<p>Longer fibrils protruding from the surface of the knitted (<b>a</b>) untreated samples compared to (<b>b</b>) aloe-treated pastes coated samples, after 6000 rubbing cycles.</p> Full article ">Figure 8
<p>Abrasion resistance cycles to failure plot of knitted fabric substrates for stepwise statistical analysis.</p> Full article ">Figure 9
<p>Abrasion resistance cycles to failure plot of woven fabric substrates for stepwise statistical analysis.</p> Full article ">Figure A1
<p>The abraded fabric under SEM analysis. (<b>a</b>) Low magnification (<b>b</b>) and high magnification at 5000 cycles.</p> Full article ">
Open AccessArticle
Investigating the Surface Damage to Fuzhou’s Ancient Houses (Gu-Cuo) Using a Non-Destructive Testing Method Constructed via Machine Learning
by
Lei Zhang, Yile Chen, Liang Zheng, Binwen Yan, Jiali Zhang, Ali Xie and Senyu Lou
Coatings 2024, 14(11), 1466; https://doi.org/10.3390/coatings14111466 - 18 Nov 2024
Abstract
As an important part of traditional Chinese architecture, Fuzhou’s ancient houses have unique cultural and historical value. However, over time, environmental factors such as efflorescence and plant growth have caused surface damage to their gray brick walls, leading to a decline in the
[...] Read more.
As an important part of traditional Chinese architecture, Fuzhou’s ancient houses have unique cultural and historical value. However, over time, environmental factors such as efflorescence and plant growth have caused surface damage to their gray brick walls, leading to a decline in the quality of the buildings’ structure and even posing a threat to the buildings’ safety. Traditional damage detection methods mainly rely on manual labor, which is inefficient and consumes a lot of human resources. In addition, traditional non-destructive detection methods, such as infrared imaging and laser scanning, often face difficulty in accurately identifying specific types of damage, such as efflorescence and plant growth, on the surface of gray bricks and are easily hampered by diverse surface features. This study uses the YOLOv8 machine learning model for the automated detection of two common types of damage to the gray brick walls of Fuzhou’s ancient houses: efflorescence and plant growth. We establish an efficient gray brick surface damage detection model through dataset collection and annotation, experimental parameter optimization, model evaluation, and analysis. The research results reveal the following. (1) Reasonable hyperparameter settings and model-assisted annotation significantly improve the detection accuracy and stability. (2) The model’s average precision (AP) is improved from 0.30 to 0.90, demonstrating good robustness in detecting complex backgrounds and high-resolution real-life images. The F1 value of the model’s gray brick detection efficiency is improved (classification model performance index) from 0.22 to 0.77. (3) The model’s ability to recognize the damage details of gray bricks under high-resolution conditions is significantly enhanced, demonstrating its ability to cope with complex environments. (4) The simplified data enhancement strategy effectively reduces the feature extraction interference and enhances the model’s adaptability in different environments.
Full article
(This article belongs to the Special Issue Advanced Technology in Surface Characterization and Conservation for Architectural and Archaeological Heritage)
►▼
Show Figures
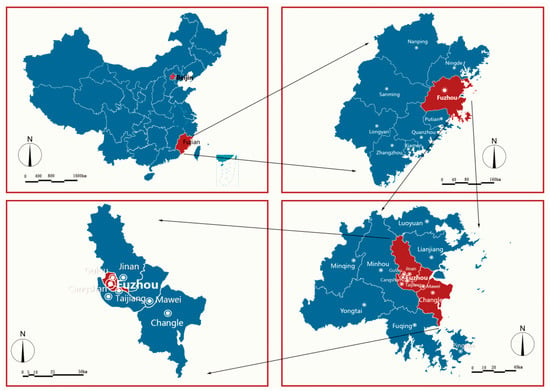
Figure 1
Figure 1
<p>Scope of the research and investigation (image source: drawn by the author).</p> Full article ">Figure 2
<p>The locations where the photos were collected. The numbers in the figure represent the following: 1 is No. 108 Wushan Road; 2 is No. 151 Baima South Road; 3 is No. 169 Baima South Road; 4 is No. 17 Tianhuangling Lane; 5 is No. 20 Daguangli; 6 is No. 250 Dongguan Street; 7 is No. 254 Dongguan Street; 8 is No. 172 Heping Street; 9 is No. 44 Jing Street; 10 is Jiuyan Gong Dacuo; 11 is Kaiyinglu; 12 is No. 50 Nanhou Street; 13 is No. 174 Nanhou Street; 14 is Shangbao Qizhu Hall; 15 is No. 4 Weicuoli; 16 is No. 8 Weicuoli; 17 is the former residence of the Wei family; 18 is No. 135 Wushan Village; 19 is Wushan Mansion, Wushan Village; 20 is No. 1 Chiqian, Yijing Village; 21 is No. 9 Chiqian, Yijing Village; 22 is No. 11 Zhonglie Road; 23 is No. 50 Zhuzifang; 24 is No. 58 Taibaojing Lane; 25 is No. 6 Wenrufang; 26 is No. 42 Nanhou Street; 27 is No. 20 Daguangli; 28 is No. 2 Longjin Yizhi Lane; 29 is the former site of Yihua Photo Studio; 30 is No. 78–84 Zhongping Road; 31 is No. 88–98 Zhongping Road; and 32 is No. 53 Dongxing (image source: drawn by the author).</p> Full article ">Figure 3
<p>Research methods and steps (image source: drawn by the author).</p> Full article ">Figure 4
<p>We used the LabelImg tool to label the collected images. Since the author uses the simplified Chinese version of the software, the Chinese displayed in the screenshot is that which comes with the LabelImg tool. The red box in the figure represents the marked range. (image source: screenshot from LabelImg tool).</p> Full article ">Figure 5
<p>Design of the YOLOv8 architecture used in this study (image source: drawn by the author).</p> Full article ">Figure 6
<p>Climate analysis of Fuzhou City (image source: drawn by the author via Ladybug).</p> Full article ">Figure 7
<p>Analysis of the annual wind frequency rise in Fuzhou (image source: drawn by the author via Ladybug).</p> Full article ">Figure 8
<p>Analysis of the enthalpy–humidity diagram for Fuzhou (image source: drawn by the author via Climate Consultant).</p> Full article ">Figure 9
<p>The location of gray brick in an ancient Fuzhou house (image source: drawn by the author).</p> Full article ">Figure 10
<p>Ancient houses in Fuzhou feature gray brick on their façade (image source: drawn by the author).</p> Full article ">Figure 11
<p>The location of gray bricks in the saddle fire wall (image source: drawn by the author).</p> Full article ">Figure 12
<p>The location of gray bricks in the arched fire wall (image source: drawn by the author).</p> Full article ">Figure 13
<p>The location of gray bricks in the herringbone fire wall (image source: drawn by the author).</p> Full article ">Figure 14
<p>The distribution of gray bricks in the walls of Western-style buildings (image source: drawn by the author).</p> Full article ">Figure 15
<p>Schemes follow the same formatting, all images are normalized to 512 × 512 pixels. (image source: drawn by the author).</p> Full article ">Figure 16
<p>The mAP numerical statistics of the first ten epochs of ten model optimization experiments (image source: drawn by the author).</p> Full article ">Figure 17
<p>Loss value change trend during model training (image source: drawn by the author).</p> Full article ">Figure 18
<p>Performance statistics of the models at different epochs. (asterisk * in the figure indicates the median). In the figure, F1* indicates score threshold = 0.5; Recall* indicates score threshold = 0.5; Precision* indicates score threshold = 0.5. (image source: drawn by the author).</p> Full article ">Figure 19
<p>Confusion matrix of the 23rd epoch model (image source: drawn by the author).</p> Full article ">Figure 20
<p>Confusion matrix of the 170th epoch model (image source: drawn by the author).</p> Full article ">Figure 21
<p>Confusion matrix of the 204th epoch model (image source: drawn by the author).</p> Full article ">Figure 22
<p>Confusion matrix of the 300th epoch model (image source: drawn by the author).</p> Full article ">Figure 23
<p>Analysis of the detection results of the different epoch models (image source: drawn by the author).</p> Full article ">Figure 24
<p>Feature map analysis of the model in the process of gray brick efflorescence detection (image source: drawn by the author).</p> Full article ">Figure 25
<p>Feature map analysis of the model in the process of gray brick plant growth detection (image source: drawn by the author).</p> Full article ">Figure 26
<p>Feature map of the model’s original image detection process for gray brick efflorescence (image source: drawn by the author).</p> Full article ">Figure 27
<p>Feature map of the model’s original image detection process for gray brick plant growth (image source: drawn by the author).</p> Full article ">Figure 28
<p>Testing of the model in field applications (image source: drawn by the author).</p> Full article ">
Open AccessArticle
Embedment of Molybdenum Disulfide in Electrospun Fibers as an Integrated Cathode for Lithium-Ion Batteries
by
Jiaqi Pan, Zhen Liu, Baoyan Zhang, Meili Qi and Yao Feng
Coatings 2024, 14(11), 1465; https://doi.org/10.3390/coatings14111465 - 18 Nov 2024
Abstract
As an important component of LIBs, the electrode material plays a crucial role in determining the lithium (Li) storage performance in LIBs. In this study, MoS2 nano-flowers were synthesized using a one-pot hydrothermal method. The resulting MoS2 nano-flower, along with PAN,
[...] Read more.
As an important component of LIBs, the electrode material plays a crucial role in determining the lithium (Li) storage performance in LIBs. In this study, MoS2 nano-flowers were synthesized using a one-pot hydrothermal method. The resulting MoS2 nano-flower, along with PAN, were used as raw materials for electrospinning. After annealing treatment, MoS2/(carbon nanofibers) CNFs nano-composites coated with carbon fibers were formed. The CNFs coating exhibited electrical conductivity and enhanced structural stability of the MoS2 due to the stabilizing effect of the carbon fibers. Additionally, electrochemical tests, including CV and GCD, indicated that the optimal capacity and cycling stability were achieved when the MoS2 content was 10%. The results indicated that the charge/discharge capacity of MoS2/CNFs-10% at a current density of 100 mA/g was ~650 mAh/g. After the cycling current returned to 100 mA/g, the current recovery was ~600 mAh/g, thereby indicating outstanding cycling stability. Accordingly, our fabrication technique and new insight could both widen design strategy of multicomponent composite electrode materials and promote the practical applications of the latest emerging transition metal sulfides in next-generation high-performance lithium-ion batteries.
Full article
(This article belongs to the Special Issue Surface Modification of Advanced Transition Metal-Based Materials for Electrochemical Energy Storage)
►▼
Show Figures
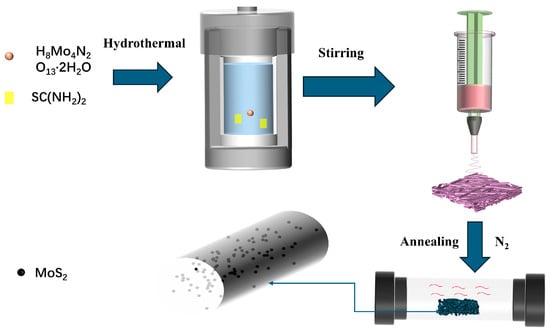
Figure 1
Figure 1
<p>Schematic of the synthesis procedure of the MoS<sub>2</sub>/CNFs.</p> Full article ">Figure 2
<p>Structure characterization and morphology of MoS<sub>2</sub>/CNFs: (<b>a</b>) SEM images of MoS<sub>2</sub>/CNFs-15%, (<b>b</b>) SEM images of MoS<sub>2</sub>/CNFs-10%, (<b>c</b>) SEM images of MoS<sub>2</sub>/CNFs-10%, (<b>d</b>) SEM images of carbonated MoS<sub>2</sub>/CNFs-5%, (<b>e</b>) SEM images of carbonated MoS<sub>2</sub>/CNFs-5%, and (<b>f</b>) SEM images of carbonated MoS<sub>2</sub>/CNFs-10%; (<b>g</b>) EDSelemental mapping images of MoS<sub>2</sub>/CNFs-10%, (<b>h</b>) XRD characterization of MoS<sub>2</sub>/CNFs-15%, MoS<sub>2</sub>/CNFs-10%, MoS<sub>2</sub>/CNFs-5%, and CNFs.</p> Full article ">Figure 3
<p>Raman spectra of MoS<sub>2</sub>/CNFs-5%, MoS<sub>2</sub>/CNFs-10%, and MoS<sub>2</sub>/CNFs-15%.</p> Full article ">Figure 4
<p>Electrochemical performance: (<b>a</b>) CV curves of MoS<sub>2</sub>/CNFs-10%. (<b>b</b>) GCD curves of MoS<sub>2</sub>/CNFs-10%.</p> Full article ">Figure 5
<p>Electrochemical performance: (<b>a</b>) Cycling performance of MoS<sub>2</sub>/CNFs-15%, MoS<sub>2</sub>/CNFs10, and MoS<sub>2</sub>/CNFs-5%. (<b>b</b>) Rate performance of MoS<sub>2</sub>/CNFs-15%, MoS<sub>2</sub>/CNFs10, and MoS<sub>2</sub>/CNFs-5%.</p> Full article ">Figure 6
<p>Electrochemical performance: (<b>a</b>) EIS spectra of MoS<sub>2</sub>/CNFs-15%, MoS<sub>2</sub>/CNFs-10%, and MoS<sub>2</sub>/CNFs-5%. (<b>b</b>) Equivalent circuit model of MoS<sub>2</sub>/CNFs.</p> Full article ">
Open AccessArticle
Optical Properties of Yttrium Ferrite Films Prepared by Pulse Laser Deposition
by
Dinara Sobola, Saleh H. Fawaeer, Pavla Kočková, Richard Schubert, Rashid Dallaev and Tomáš Trčka
Coatings 2024, 14(11), 1464; https://doi.org/10.3390/coatings14111464 - 18 Nov 2024
Abstract
This study investigates the optical properties of yttrium ferrite thin films fabricated via pulse laser deposition. Yttrium orthoferrite, a ferrimagnetic material known for its potential applications in spintronics and photonics, was deposited on single-crystal substrates under controlled conditions to analyze its optical characteristics.
[...] Read more.
This study investigates the optical properties of yttrium ferrite thin films fabricated via pulse laser deposition. Yttrium orthoferrite, a ferrimagnetic material known for its potential applications in spintronics and photonics, was deposited on single-crystal substrates under controlled conditions to analyze its optical characteristics. The influence of deposition time on the film quality and optical properties was examined. Atomic force microscopy in contact mode revealed surface roughness variations up to 35 nm, indicating the films’ ability to cover substrate defects. Reflectance measurements determined the optical band gap, which decreased from 3.17 eV for thinner films (44 nm) to 2.91 eV for thicker films (93 nm). Forbidden electronic transitions were also observed, attributed to heteroepitaxial growth and phonon interactions. These results demonstrate the effect of film thickness on morphology and optical properties, making YFeO3 films promising for a range of optoelectronic applications.
Full article
(This article belongs to the Special Issue Advances in Deposition and Surface Modification of Oxide Thin Films and Nanocoatings)
►▼
Show Figures
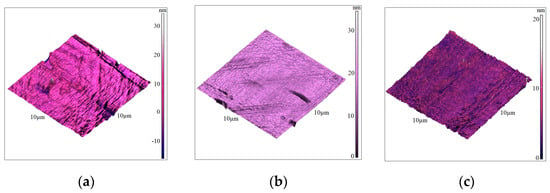
Figure 1
Figure 1
<p>AFM images of the films surfaces of 10 × 10 µm. (<b>a</b>) S1; (<b>b</b>) S2; (<b>c</b>) S3.</p> Full article ">Figure 2
<p>XPS Survey spectra of the films. (<b>a</b>) S1; (<b>b</b>) S2; (<b>c</b>) S3.</p> Full article ">Figure 2 Cont.
<p>XPS Survey spectra of the films. (<b>a</b>) S1; (<b>b</b>) S2; (<b>c</b>) S3.</p> Full article ">Figure 3
<p>XPS detailed spectra of the films (red—S1, black—S2, green—S3): (<b>a</b>) C1s; (<b>b</b>) O1s; (<b>c</b>) Fe2p; (<b>d</b>) Fe3p; (<b>e</b>) Y3p; (<b>f</b>) VB.</p> Full article ">Figure 4
<p>Optical image of the films with magnification 50× (<b>a</b>) and Raman spectra (<b>b</b>).</p> Full article ">Figure 5
<p>SEM images of S1 (<b>a</b>), S2 (<b>c</b>), and S3 (<b>e</b>) samples and cross-sections of the samples with thickness 93 nm—S1 (<b>b</b>), 66 nm—S2 (<b>d</b>), and 44 nm—S3 (<b>f</b>).</p> Full article ">Figure 5 Cont.
<p>SEM images of S1 (<b>a</b>), S2 (<b>c</b>), and S3 (<b>e</b>) samples and cross-sections of the samples with thickness 93 nm—S1 (<b>b</b>), 66 nm—S2 (<b>d</b>), and 44 nm—S3 (<b>f</b>).</p> Full article ">Figure 6
<p>FTIR reflectance spectra of S1, S2, and S3 samples.</p> Full article ">Figure 7
<p>Photoluminescence measurement of the YFO films.</p> Full article ">Figure 8
<p>Ellipsometry spectra of the films. (<b>a</b>) S1; (<b>b</b>) S2; (<b>c</b>) S3.</p> Full article ">Figure 9
<p>Optical and electrical characteristics recalculated from ellipsometry spectra of the films. (<b>a</b>,<b>b</b>) S1; (<b>c</b>,<b>d</b>) S2; (<b>e</b>,<b>f</b>) S3.</p> Full article ">Figure 10
<p>Reflectance of the films: (<b>a</b>), direct allowed transitions (<b>b</b>), indirect allowed transition (<b>c</b>), and forbidden transitions (<b>d</b>,<b>e</b>).</p> Full article ">Figure 11
<p>Electronic transitions: (a) allowed direct, (b) forbidden direct, (c) allowed indirect, and (d) forbidden indirect [<a href="#B25-coatings-14-01464" class="html-bibr">25</a>].</p> Full article ">
Open AccessCorrection
Correction: Chen et al. High-Sensitivity and -Stability Thin-Film Heat Flux Sensor Based on Transverse Thermoelectric Effect. Coatings 2023, 13, 1610
by
Hao Chen, Yong Wang, Zao Yi, Bo Dai, Bin Tang, Xibin Xu and Yougen Yi
Coatings 2024, 14(11), 1463; https://doi.org/10.3390/coatings14111463 - 18 Nov 2024
Abstract
►▼
Show Figures
In the original publication [...]
Full article
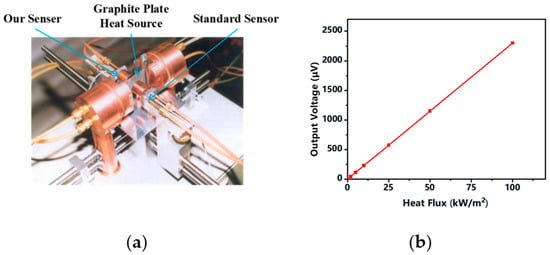
Figure 4
Figure 4
<p>(<b>a</b>) is a schematic diagram of the device calibration test system by graphite flat plate heating method, and (<b>b</b>) is the calibration curve of the device in the range of 0~100 kW/m<sup>2</sup>.</p> Full article ">Figure 6
<p>(<b>a</b>–<b>d</b>) show the V-T variation curve of the output of the heat flow sensor when the power of a single quartz lamp array is 0.2 kW, 0.3 kW, 0.4 kW and 0.5 kW, respectively.</p> Full article ">Figure 7
<p>(<b>a</b>) The output V-q curve of the heat flow sensor, (<b>b</b>) the repeated characteristic curve of the heat flow sensor.</p> Full article ">Figure 8
<p>(<b>a</b>) The schematic diagram of the laser transient heat flow calibration facility, (<b>b</b>) the V-T dynamic curve under the irradiation of the laser frequency of 500 kHz, (<b>c</b>) the V-T dynamic curve under the irradiation of the sample laser frequency of 1000 kHz.</p> Full article ">Figure 9
<p>Repetition response curve of the component under 1000 kHz laser frequency irradiation.</p> Full article ">
Open AccessArticle
Study on Mechanism of Microstructure Refinement by Ultrasonic Cavitation Effect
by
Chang Li, Shuchao Li, Jiabo Liu, Yichang Sun, Yuhao Wang and Fanhong Kong
Coatings 2024, 14(11), 1462; https://doi.org/10.3390/coatings14111462 - 17 Nov 2024
Abstract
During the solidification process of the alloy, the temperature lies in the range between the solid-phase line and the liquidus. Dendrite growth exhibits high sensitivity to even slight fluctuations in temperature, thereby significantly influencing the tip growth rate. The increase in temperature can
[...] Read more.
During the solidification process of the alloy, the temperature lies in the range between the solid-phase line and the liquidus. Dendrite growth exhibits high sensitivity to even slight fluctuations in temperature, thereby significantly influencing the tip growth rate. The increase in temperature can result in a reduction in the rate of tip growth, whereas a decrease in temperature can lead to an augmentation of the tip growth rate. In cases where there is a significant rise in temperature, dendrites may undergo fracture and subsequent remelting. Within the phenomenon of ultrasonic cavitation, the release of internal energy caused by the rupture of cavitation bubbles induces a substantial elevation in temperature, thereby causing both dendrite remelting and fracture phenomena. This serves as the main mechanism behind microstructure refinement induced by ultrasonic cavitation. Although dendrite remelting and fracture exert significant influences on the solidification process of alloys, most studies primarily focus on microscopic characterization experiments, which fail to unveil the transient evolution law governing dendrite remelting and fracture processes. Numerical simulation offers an effective approach to address this gap. The existing numerical models primarily focus on predicting the dendrite growth process, while research on remelting and fracture phenomena remains relatively limited. Therefore, a dendrite remelting model was established by incorporating the phase field method (PFM) and finite element difference method (FDM) into the temperature-induced modeling, enabling a comprehensive investigation of the entire process evolution encompassing dendrite growth and subsequent remelting.
Full article
(This article belongs to the Special Issue Effects of Laser Treatment on Surface Characterization and Mechanical Properties of Alloys, 2nd Edition)
►▼
Show Figures
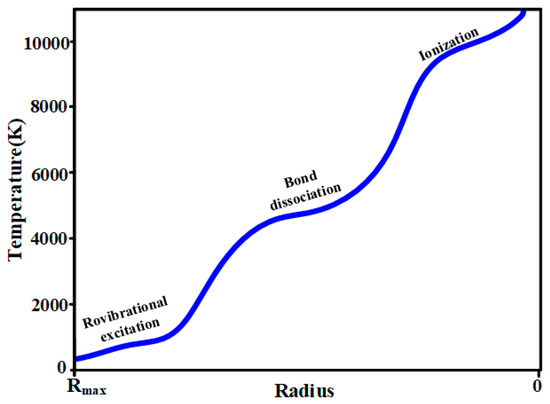
Figure 1
Figure 1
<p>Relationship between cavitation bubble rupture temperature and bubble radius.</p> Full article ">Figure 2
<p>Cladding test block.</p> Full article ">Figure 3
<p>Nucleation positions and boundary conditions of dendrite remelting settings.</p> Full article ">Figure 4
<p>Normal dendrite growth in 3000 Δ<span class="html-italic">t</span>; (<b>a</b>) dendrite morphology at 1000 Δ<span class="html-italic">t</span>; and (<b>b</b>) dendrite morphology at 3000 Δ<span class="html-italic">t</span>.</p> Full article ">Figure 5
<p>The process of large dendrite melting after 3000 Δ<span class="html-italic">t</span>; (<b>a</b>) dendrite morphology at 3005 Δ<span class="html-italic">t</span>; (<b>b</b>) dendrite morphology at 3020 Δ<span class="html-italic">t</span>; (<b>c</b>) dendrite morphology at 3030 Δ<span class="html-italic">t</span>; and (<b>d</b>) dendrite morphology at 3040 Δ<span class="html-italic">t</span>.</p> Full article ">Figure 6
<p>Dendrite morphology of lateral branches that were not completely melted and began to regenerate; (<b>a</b>) dendrite morphology at 0 Δ<span class="html-italic">t</span>; and (<b>b</b>) dendrite morphology at 50 Δ<span class="html-italic">t</span>.</p> Full article ">Figure 7
<p>Microstructure refinement process of dendrite regrowth by remelting; (<b>a</b>) dendrite morphology at 100 Δ<span class="html-italic">t</span>; (<b>b</b>) dendrite morphology at 200 Δ<span class="html-italic">t</span>; (<b>c</b>) dendrite morphology at 500 Δ<span class="html-italic">t</span>; and (<b>d</b>) dendrite morphology at 1000 Δ<span class="html-italic">t</span>.</p> Full article ">Figure 8
<p>Dendrite morphology of main dendrites that did not completely melt and began to regenerate; (<b>a</b>) dendrite morphology at 0 Δ<span class="html-italic">t</span>; and (<b>b</b>) dendrite morphology at 20 Δ<span class="html-italic">t</span>.</p> Full article ">Figure 9
<p>Microstructure refinement process of main dendrite regrowth by remelting; (<b>a</b>) dendrite morphology at 50 Δ<span class="html-italic">t</span>; (<b>b</b>) dendrite morphology at 200 Δ<span class="html-italic">t</span>; (<b>c</b>) dendrite morphology at 400 Δ<span class="html-italic">t</span>; and (<b>d</b>) dendrite morphology at 1000 Δ<span class="html-italic">t</span>.</p> Full article ">Figure 10
<p>Main dendrite fragments and the morphologies of dendrites beginning to regrow; (<b>a</b>) dendrite morphology at 0 Δ<span class="html-italic">t</span>; and <span class="html-italic">(</span><b>b</b>) dendrite morphology at 50 Δ<span class="html-italic">t</span>.</p> Full article ">Figure 11
<p>Multinucleate regrowth of main dendrite fragments; (<b>a</b>) dendrite morphology at 100 Δ<span class="html-italic">t</span>; (<b>b</b>) dendrite morphology at 300 Δ<span class="html-italic">t</span>; (<b>c</b>) dendrite morphology at 600 Δ<span class="html-italic">t</span>; and (<b>d</b>) dendrite morphology at 1000 Δ<span class="html-italic">t</span>.</p> Full article ">Figure 11 Cont.
<p>Multinucleate regrowth of main dendrite fragments; (<b>a</b>) dendrite morphology at 100 Δ<span class="html-italic">t</span>; (<b>b</b>) dendrite morphology at 300 Δ<span class="html-italic">t</span>; (<b>c</b>) dendrite morphology at 600 Δ<span class="html-italic">t</span>; and (<b>d</b>) dendrite morphology at 1000 Δ<span class="html-italic">t</span>.</p> Full article ">Figure 12
<p>Morphology of dendrites regenerated by dendrite fragments and crystal nuclei; (<b>a</b>) dendrite morphology at 0 Δ<span class="html-italic">t</span>; (<b>b</b>) dendrite morphology at 100 Δ<span class="html-italic">t</span>; (<b>c</b>) dendrite morphology at 1000 Δ<span class="html-italic">t</span>; and (<b>d</b>) dendrite morphology at 3000 Δ<span class="html-italic">t</span>.</p> Full article ">Figure 12 Cont.
<p>Morphology of dendrites regenerated by dendrite fragments and crystal nuclei; (<b>a</b>) dendrite morphology at 0 Δ<span class="html-italic">t</span>; (<b>b</b>) dendrite morphology at 100 Δ<span class="html-italic">t</span>; (<b>c</b>) dendrite morphology at 1000 Δ<span class="html-italic">t</span>; and (<b>d</b>) dendrite morphology at 3000 Δ<span class="html-italic">t</span>.</p> Full article ">Figure 13
<p>Microstructure of the cladding layer under ultrasonic vibration. (<b>a</b>) Heterogeneous microstructure of secondary dendrite arms. (<b>b</b>) Locally refined microstructure of the main dendrite arm.</p> Full article ">
Open AccessArticle
Self-Etching Ceramic Primer Application Time Influences Durability of Bonding to Lithium Disilicate and Advanced Lithium Disilicate Ceramics
by
Ashwaq Alsolami and Khaled M. Alzahrani
Coatings 2024, 14(11), 1461; https://doi.org/10.3390/coatings14111461 - 17 Nov 2024
Abstract
Background: Monobond Etch & Prime (MEP; Ivoclar) has a material-dependent effect on dental ceramics. This study evaluated the impact of MEP application time on the resin–ceramic shear bond strength (SBS) of lithium disilicate (LD) and advanced lithium disilicate (ALD) ceramics. Methods: LD and
[...] Read more.
Background: Monobond Etch & Prime (MEP; Ivoclar) has a material-dependent effect on dental ceramics. This study evaluated the impact of MEP application time on the resin–ceramic shear bond strength (SBS) of lithium disilicate (LD) and advanced lithium disilicate (ALD) ceramics. Methods: LD and ALD discs were distributed into four groups (n = 20): no surface treatment; 5% HF etching followed by the application of a silane-containing primer (S); MEP applied for 40 s and maintained for 20 s; MEP applied for 2 min and maintained for 40 s. Resin–ceramic SBS was evaluated at 24 h and after thermocycling. The statistical analysis of SBS was performed by using the three-way ANOVA and Tukey’s multiple comparisons tests. Additional ceramic samples were prepared to assess the surface topography. Results: There was no statistically significant difference in the SBS of the MEP groups (20 s and 2 min) and HF + S. However, only the HF + S and MEP (2 min) groups showed durable adhesion after thermocycling. MEP resulted in less distinct surface alterations compared with HF etching. Conclusion: Increasing the application time of MEP to 2 min resulted in more durable resin–ceramic adhesion compared with the application time (40 s) recommended by the manufacturer. The adhesion of resin–ceramic to LD and ALD did not significantly differ.
Full article
(This article belongs to the Special Issue Advanced Biomaterials, Coatings and Techniques: Applications in Medicine and Dentistry)
►▼
Show Figures
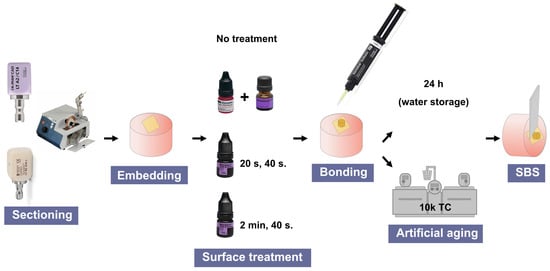
Figure 1
Figure 1
<p>Study design.</p> Full article ">Figure 2
<p>Bar chart of mean and standard deviation of resin–ceramic shear bond strength (SBS) following different surface treatments of lithium disilicate (LD) and advanced lithium disilicate (ALD) ceramics. Different letters indicate statistically significant differences between the groups. * indicates a statistically significant difference between immediate (24 h) and aged (TC) bond strength.</p> Full article ">Figure 3
<p>Representative images of different failure modes examined under digital microscope (<b>A</b>–<b>C</b>): (<b>A</b>) adhesive failure, (<b>B</b>) cohesive failure within resin, and (<b>C</b>) mixed failure. (i) Resin–ceramic interface, (re) resin cement, and (ce) ceramic surface.</p> Full article ">Figure 4
<p>Representative SEM micrographs (10,000×) of lithium disilicate and advanced lithium disilicate: (<b>a</b>,<b>e</b>) control (no treatment); (<b>b</b>,<b>f</b>) hydrofluoric acid etching; (<b>c</b>,<b>g</b>) Monobond Etch & Prime (MEP) applied following the manufacturer’s instructions (rubbed for 20 s and left on ceramic surface for 40 s); (<b>d</b>,<b>h</b>) MEP extended application time (rubbed for 2 min and left on ceramic surface for 40 s).</p> Full article ">
Open AccessArticle
Ceria-Stabilized Zirconia/Alumina Nanocomposite (NANO-Zr) Surface Enhances Osteogenesis Through Regulation of Macrophage Polarization
by
Yuan Tian, Yunjia Song, Suli Lan, Ruoting Geng, Muxiang Wang, Sanwen Li, Jianmin Han, Hong Bai, Guang Hong and Ying Li
Coatings 2024, 14(11), 1460; https://doi.org/10.3390/coatings14111460 - 17 Nov 2024
Abstract
Zirconia implants are recognized for their excellent biocompatibility, aesthetics, and favorable mechanical properties. However, the effects of zirconia surfaces on osteogenesis, particularly in the presence of macrophages, are still not well understood. This study compares two types of zirconia surfaces—ceria-stabilized zirconia/alumina nanocomposite (NANO-Zr)
[...] Read more.
Zirconia implants are recognized for their excellent biocompatibility, aesthetics, and favorable mechanical properties. However, the effects of zirconia surfaces on osteogenesis, particularly in the presence of macrophages, are still not well understood. This study compares two types of zirconia surfaces—ceria-stabilized zirconia/alumina nanocomposite (NANO-Zr) and 3 mol% yttria-stabilized tetragonal zirconia polycrystal (3Y-TZP)—with titanium (Ti) substrates. Both zirconia surfaces promoted macrophage adhesion and proliferation, facilitated a shift from M1 to M2 polarization, and created an immune microenvironment conducive to osteogenesis by downregulating IL-6 and TNF-α and upregulating IL-10 and TGF-β gene expression. In macrophage co-cultures, both zirconia surfaces also supported osteoblast adhesion and proliferation, with NANO-Zr notably enhancing osteogenic differentiation and mineralization. These results highlight NANO-Zr as a promising candidate for future dental and orthopedic implant applications.
Full article
(This article belongs to the Collection Feature Paper Collection in 'Surface Coatings for Biomedicine and Bioengineering')
►▼
Show Figures
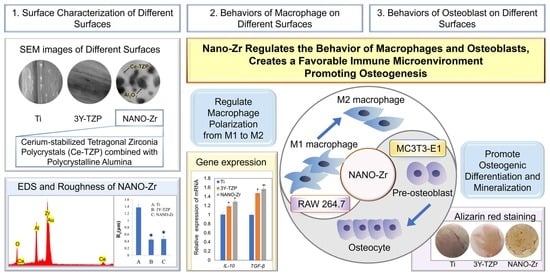
Graphical abstract
Graphical abstract
Full article ">Figure 1
<p>Representative SEM images of Ti (<b>A</b>–<b>C</b>), 3Y-TZP (<b>D</b>–<b>F</b>), and NANO-Zr (<b>G</b>–<b>I</b>) samples with different magnifications. Bars indicate 10 µm (<b>A</b>,<b>D</b>,<b>G</b>), 2 µm (<b>B</b>,<b>E</b>,<b>H</b>), and 400 nm (<b>C</b>,<b>F</b>,<b>I</b>), respectively.</p> Full article ">Figure 2
<p>Sample surface characterization. EDS elemental mapping of Ti (<b>A</b>), 3Y-TZP (<b>B</b>), and NANO-Zr (<b>C</b>) respectively. EDS energy spectrum (<b>D</b>), surface roughness (<b>E</b>,<b>F</b>), and contact angle detection (<b>G</b>) of different samples. Data are expressed as the mean ± standard deviation (<span class="html-italic">n</span> = 3). * indicates statistical significance <span class="html-italic">p</span> < 0.05 vs. Ti groups.</p> Full article ">Figure 3
<p>Macrophage adhesion and morphology on the surface of different samples. (<b>A</b>) Fluorescent staining of the cytoskeleton. (<b>B</b>) 24-h adherent cell counting. (<b>C</b>) 2-h cell adhesion rate. (<b>D</b>) Morphological observation. Panels d1, d3, and d5 represented macrophages on the Ti, 3Y-TZP, and NANO-Zr surfaces, respectively, while d2, d4, and d6 showed correspondingly higher magnification images. Data are expressed as the mean ± standard deviation (<span class="html-italic">n</span> = 3). * and <sup>#</sup> indicate statistical significance <span class="html-italic">p</span> < 0.05 vs. Ti and 3Y-TZP groups, respectively.</p> Full article ">Figure 4
<p>Macrophage proliferation and polarization on the surface of different samples. (<b>A</b>) Cell proliferation of macrophages. Pro-inflammatory (<b>B</b>) and pro-restorative (<b>C</b>) gene expression levels in macrophages. Data are expressed as the mean ± standard deviation (<span class="html-italic">n</span> = 3). * and <sup>#</sup> indicate statistical significance <span class="html-italic">p</span> < 0.05 vs. Ti and 3Y-TZP groups, respectively.</p> Full article ">Figure 5
<p>Osteoblast adhesion and morphology cultured with different samples in macrophage CM for 1 day. (<b>A</b>) Fluorescent staining of cytoskeleton. (<b>B</b>) Adherent cell counting. (<b>C</b>) Morphological observation. Panels c1, c3, and c5 showed the morphology of MC3T3-E1 cells on Ti, 3Y-TZP, and NANO-Zr surfaces, respectively. Panels c2, c4, and c6 were high-magnification images of panels c1, c3, and c5, respectively. Data are expressed as the mean ± standard deviation (<span class="html-italic">n</span> = 3). * indicates statistical significance <span class="html-italic">p</span> < 0.05 vs. Ti groups.</p> Full article ">Figure 6
<p>Osteoblast proliferation, differentiation, and mineralization performance of different samples in macrophage CM. (<b>A</b>) Cell proliferation. (<b>B</b>) Quantitative analysis of alkaline phosphatase (ALP). Images (<b>C</b>) and semi-quantitative analysis (<b>D</b>) of Alizarin red staining. Data are expressed as the mean ± standard deviation (<span class="html-italic">n</span> = 3). * and <sup>#</sup> indicate statistical significance <span class="html-italic">p</span> < 0.05 vs. Ti and 3Y-TZP groups, respectively.</p> Full article ">
Open AccessArticle
The Influence of Homogenous Magnetic Field Intensity on Surface Properties of Ni Thin Films Deposited from Citrate Baths and Their Role in Hydrogen Production
by
Safya Elsharkawy, Dawid Kutyła and Piotr Żabiński
Coatings 2024, 14(11), 1459; https://doi.org/10.3390/coatings14111459 - 16 Nov 2024
Abstract
Magnetic fields influence the deposition process and its current efficiency. They have a remarkable influence on thin films’ surface characteristics and catalytic properties. Here, we study the correlation between the magnetic flux density and the current efficiency of the deposition process in the
[...] Read more.
Magnetic fields influence the deposition process and its current efficiency. They have a remarkable influence on thin films’ surface characteristics and catalytic properties. Here, we study the correlation between the magnetic flux density and the current efficiency of the deposition process in the presence of a magnetic field with different intensities in different directions: the directions parallel and perpendicular to the electrode surface. We also show how the magnetic field direction impacts the surface roughness. Furthermore, we also analyze the impact of these synthesized films on the hydrogen evolution reaction (HER) when using them as electrocatalysts and how the application of a magnetic field in two dissimilar orientations influences the surface roughness and wettability. The synthesized Ni films are characterized using a scanning electron microscope (SEM), X-ray diffraction (XRD), and atomic force microscopy (AFM).
Full article
(This article belongs to the Special Issue Design of Nanostructures for Energy and Environmental Applications)
►▼
Show Figures
Figure 1
Figure 1
<p>SEM images of Ni deposits without B (<b>a</b>), existence of B<sub>⟂</sub> (<b>b</b>–<b>e</b>), (<b>f</b>–<b>i</b>) presence of B<sub>‖</sub> with different intensities ranging from (0.1–0.5 T), respectively. The red circles represent the holes appear in the surface.</p> Full article ">Figure 2
<p>XRD spectrum of fabricated Ni (JCDPS card no. 00-001-1242) in the presence of B<sub>‖</sub> and B<sub>⟂</sub>. <a href="#coatings-14-01459-f002" class="html-fig">Figure 2</a> is reproduced according to our data, which are published in ref. [<a href="#B39-coatings-14-01459" class="html-bibr">39</a>].</p> Full article ">Figure 3
<p>Current efficiency and magnetic flux density are related in both parallel and perpendicular directions.</p> Full article ">Figure 4
<p>Contact angle–magnetic field flux density correlation.</p> Full article ">Figure 5
<p>AFM 3D images for (<b>a</b>) fabricated Ni thin films in absence of B, (<b>b</b>) in presence of B<sub>‖</sub>, (<b>c</b>) and in presence of B<sub>⟂</sub>. (<b>d</b>–<b>f</b>) are their line scans, respectively.</p> Full article ">Figure 6
<p>(<b>a</b>) LSV for 1 M NaOH at nickel layers deposited from citrate electrolyte under the influence of B<sub>⟂</sub> with different magnetic flux densities and (<b>b</b>) their Tafel plots.</p> Full article ">Figure 7
<p>(<b>a</b>) Cathodic polarization curves for 1 M NaOH at 5 mV s<sup>−1</sup> after 1 and 1000 cycles. (<b>b</b>) Chronoamperometric stability curve over 24 h.</p> Full article ">Figure 8
<p>SEM images of Ni film fabricated from citrate under the influence of B<sub>⟂</sub> at 0.5 T (<b>a</b>) before the stability measurement and (<b>b</b>) after the stability measurement.</p> Full article ">
Open AccessArticle
Effect of Surface-Textured AlSiTiN Coating Parameters on the Performance of Ball-End Milling Cutter in Titanium Alloy Milling
by
Shucai Yang, Dongqi Yu and Dawei Wang
Coatings 2024, 14(11), 1458; https://doi.org/10.3390/coatings14111458 - 15 Nov 2024
Abstract
In the high-speed milling of titanium alloys, the combined application of surface texture and coatings can significantly enhance the performance of cemented carbide tools. Investigating the synergistic effect of surface texture and AlSiTiN coating on tool performance is crucial for advancing the development
[...] Read more.
In the high-speed milling of titanium alloys, the combined application of surface texture and coatings can significantly enhance the performance of cemented carbide tools. Investigating the synergistic effect of surface texture and AlSiTiN coating on tool performance is crucial for advancing the development of their integrated preparation process. Therefore, in this study, a cemented carbide ball-end milling cutter is taken as the research object, and a surface-textured AlSiTiN coating is applied to the rake face. The effects of texture and coating parameters on the milling performance of titanium alloys are analyzed, and a regression model is developed to optimize the relevant parameters. The results indicate that the surface texture effectively reduces the actual contact area between the tool and the chip, serves as a storage space for chips, and enhances the wear resistance of the AlSiTiN coating. The coating thickness significantly affects milling force, milling temperature, and surface wear. An increase in coating thickness improves the hardness and integrity of the coating surface, and it also strengthens the adhesion of the texture to the coating. Additionally, precise control of the laser power plays a key role in reducing the milling temperature, while both the number of scans and the scanning speed significantly influence surface wear. Furthermore, maintaining an appropriate distance from the edge is crucial for enhancing the surface roughness of the workpiece. The optimized parameters for surface texture and coating preparation are as follows: coating thickness (h) = 3.0 µm, laser power (p) = 40 W, scanning speed (v) = 1590 µm/min, number of scans (n) = 6, texture diameter (d) = 42 µm, texture spacing (l) = 143 µm, and distance from the edge (l1) = 104 µm. The optimized milling performance of the milling cutter shows a significant improvement.
Full article
(This article belongs to the Special Issue Cutting Performance of Coated Tools)
►▼
Show Figures
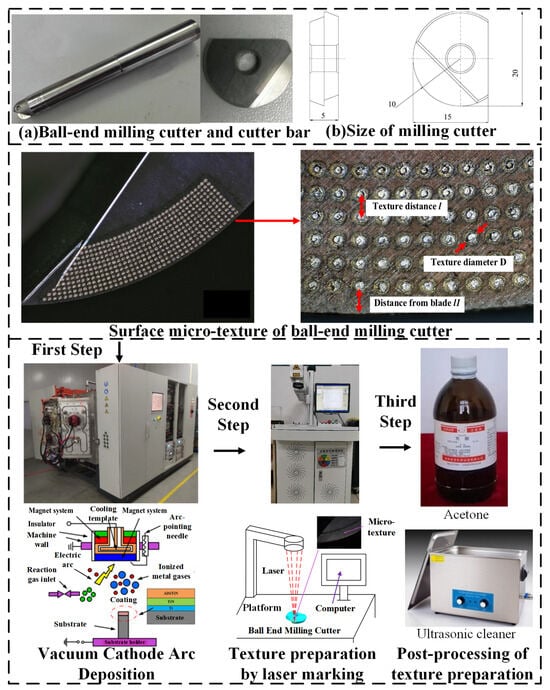
Figure 1
Figure 1
<p>Coating deposition and surface texture preparation of ball-end milling cutter.</p> Full article ">Figure 2
<p>Test equipment and data measuring device.</p> Full article ">Figure 3
<p>Significant findings and the influence trends of each parameter on the milling force.</p> Full article ">Figure 4
<p>Mechanism diagram of the influence of coating and texture preparation parameters on milling force.</p> Full article ">Figure 5
<p>Significant findings and the influence trends of each parameter on the milling temperature.</p> Full article ">Figure 6
<p>Mechanism diagram of the influence of coating and texture preparation parameters on milling temperature.</p> Full article ">Figure 7
<p>Part of ball-end milling cutter wear morphology of the rake face tool–chip contact area.</p> Full article ">Figure 8
<p>Significant findings and the influence trends of each parameter on the surface wear of ball-end milling cutter.</p> Full article ">Figure 9
<p>Mechanism diagram of the influence of coating and texture preparation parameters on the surface wear of ball-end milling cutter.</p> Full article ">Figure 10
<p>Significant findings and the influence trends of each parameter on the surface roughness of workpieces.</p> Full article ">Figure 11
<p>Different evaluation index regression model residual Quantile–Quantile plot.</p> Full article ">Figure 12
<p>Flow chart of artificial bee colony algorithm optimization parameters and comparison of milling performance results before and after optimization of coating and texture parameters.</p> Full article ">
Journal Menu
► ▼ Journal Menu-
- Coatings Home
- Aims & Scope
- Editorial Board
- Reviewer Board
- Topical Advisory Panel
- Instructions for Authors
- Special Issues
- Topics
- Sections & Collections
- Article Processing Charge
- Indexing & Archiving
- Editor’s Choice Articles
- Most Cited & Viewed
- Journal Statistics
- Journal History
- Journal Awards
- Society Collaborations
- Conferences
- Editorial Office
Journal Browser
► ▼ Journal BrowserHighly Accessed Articles
Latest Books
E-Mail Alert
News
Topics
Topic in
Coatings, JMMP, Materials, Metals, Nanomaterials
Laser Processing of Metallic Materials
Topic Editors: Liang-Yu Chen, Lai-Chang Zhang, Shengfeng ZhouDeadline: 30 November 2024
Topic in
Alloys, Coatings, Crystals, Materials, Metals
Microstructure and Properties in Metals and Alloys, 3rd Volume
Topic Editors: Andrea Di Schino, Claudio Testani, Robert BidulskýDeadline: 31 December 2024
Topic in
Coatings, Dentistry Journal, JFB, Materials, Polymers
Surfaces in Healthcare Bridging Medicine and Dentistry with Material Science
Topic Editors: Luminiţa Andronic, Alina VladescuDeadline: 8 January 2025
Topic in
Coatings, JMMP, Materials, Metals, Processes
Alloys and Composites Corrosion and Mechanical Properties
Topic Editors: Jingxiang Xu, Zhenhua Chu, Xingwei ZhengDeadline: 28 February 2025
Conferences
Special Issues
Special Issue in
Coatings
Advances in Two-Dimensional Materials: From Synthesis to Applications
Guest Editor: Liang XuDeadline: 28 November 2024
Special Issue in
Coatings
Research and Application of High Entropy Alloys
Guest Editor: Fanli KongDeadline: 29 November 2024
Special Issue in
Coatings
Sputtering Deposition for Advanced Materials and Interfaces
Guest Editors: Yaowei Wei, Kalpathy B. SundaramDeadline: 30 November 2024
Special Issue in
Coatings
Thin-Film Synthesis, Characterization and Properties
Guest Editor: Waseem HaiderDeadline: 30 November 2024
Topical Collections
Topical Collection in
Coatings
Feature Paper Collection (9) of Topic Editors
Collection Editor: Fengwei (David) Xie
Topical Collection in
Coatings
Feature Paper Collection (2) for Topic Editors
Collection Editor: Ioannis Karapanagiotis
Topical Collection in
Coatings
Strong, Ductile and Corrosion-Resistant High-Entropy Alloys
Collection Editors: Kaisheng Ming, Bin Miao
Topical Collection in
Coatings
Feature Paper Collection (5) of Topic Editors
Collection Editor: Petrica Vizureanu