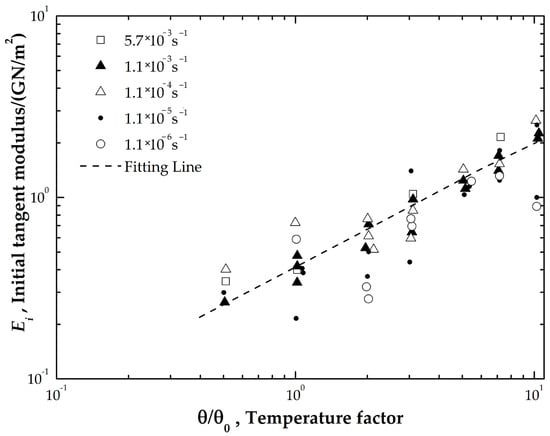
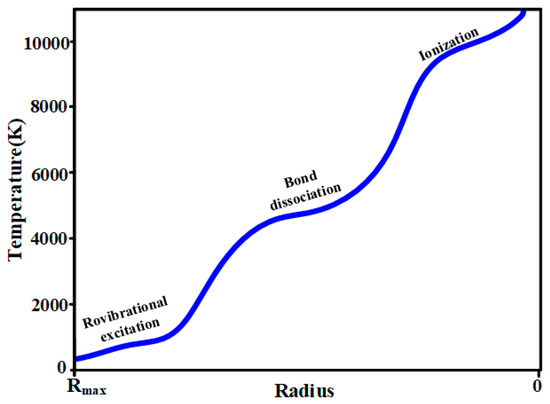
<p>Initial tangent modulus vs. temperature in logarithm [<a href="#B22-coatings-14-01474" class="html-bibr">22</a>].</p> Full article ">Figure 2
<p>Schematic diagram of pipe–soil interaction.</p> Full article ">Figure 3
<p>Contact between frozen soil and concrete pipe. (<b>a</b>) Full contact, (<b>b</b>) half contact and (<b>c</b>) one-third contact.</p> Full article ">Figure 4
<p>Numerical models. (<b>a</b>) Thermal model, (<b>b</b>) perspective view, (<b>c</b>) front view, and (<b>d</b>) contact interface.</p> Full article ">Figure 5
<p>Jacking force vs. distance under full-contact conditions. (<b>a</b>) Temperature, (<b>b</b>) cohesion, (<b>c</b>) friction angle, (<b>d</b>) diameter and (<b>e</b>) cover depth.</p> Full article ">Figure 5 Cont.
<p>Jacking force vs. distance under full-contact conditions. (<b>a</b>) Temperature, (<b>b</b>) cohesion, (<b>c</b>) friction angle, (<b>d</b>) diameter and (<b>e</b>) cover depth.</p> Full article ">Figure 6
<p>Relationships between thrust force and influencing factors with three contact ranges. (<b>a</b>–<b>c</b>) Temperature, (<b>d</b>–<b>f</b>) cohesion, (<b>g</b>–<b>i</b>) friction angle, (<b>j</b>–<b>l</b>) diameter, and (<b>m</b>–<b>o</b>) cover depth.</p> Full article ">Figure 6 Cont.
<p>Relationships between thrust force and influencing factors with three contact ranges. (<b>a</b>–<b>c</b>) Temperature, (<b>d</b>–<b>f</b>) cohesion, (<b>g</b>–<b>i</b>) friction angle, (<b>j</b>–<b>l</b>) diameter, and (<b>m</b>–<b>o</b>) cover depth.</p> Full article ">Figure 7
<p>Relationships between maximum jacking length and influencing factors with three contact ranges. (<b>a</b>) Temperature, (<b>b</b>) cohesion, (<b>c</b>) friction angle, (<b>d</b>) diameter and (<b>e</b>) cover depth.</p> Full article ">Figure 8
<p>Comparative analysis between numerical and theoretical results. (<b>a</b>) Without and (<b>b</b>) with lubricant.</p> Full article ">Figure 8 Cont.
<p>Comparative analysis between numerical and theoretical results. (<b>a</b>) Without and (<b>b</b>) with lubricant.</p> Full article ">Figure 9
<p>Temperature distribution. (<b>a</b>) Without thawing effect, (<b>b</b>) with thawing effect.</p> Full article ">Figure 10
<p>Comparative analysis of jacking force and maximum jacking length with and without thawing effect. (<b>a</b>,<b>d</b>) Full contact, (<b>b</b>,<b>e</b>) half contact, and (<b>c</b>,<b>f</b>) one-third contact.</p> Full article ">Figure 11
<p>Phase diagram showing the effect of a nonvolatile solute on freezing point and boiling point [<a href="#B37-coatings-14-01474" class="html-bibr">37</a>].</p> Full article ">Figure 12
<p>Relationship between temperature and molarity of sodium chloride.</p> Full article ">Figure 13
<p>Experimental devices. (<b>a</b>) Temperature and humidity chamber and (<b>b</b>) viscometer.</p> Full article ">Figure 14
<p>Relationship between gelling time and temperature.</p> Full article ">Figure 15
<p>Viscosity of developed anti-freezing lubricant with (<b>a</b>) No NaCl, (<b>b</b>) 1.34 mol/Kg of NaCl, and (<b>c</b>) 2.69 mol/Kg of NaCl.</p> Full article ">Figure 15 Cont.
<p>Viscosity of developed anti-freezing lubricant with (<b>a</b>) No NaCl, (<b>b</b>) 1.34 mol/Kg of NaCl, and (<b>c</b>) 2.69 mol/Kg of NaCl.</p> Full article ">Figure 16
<p>The gelling states with different sodium chloride concentrations.</p> Full article ">
