What is Sigma in Six Sigma?
The Greek Letter Sigma σ
The Greek letter sigma (σ), in both its uppercase and lowercase forms, holds profound significance in various domains, including mathematics and the renowned Six Sigma methodology. The meaning of sigma and its symbol represents mathematical concepts AND embodies the pursuit of perfection and quality that is the heart of the practice known as Six Sigma.
Sigma in Mathematics
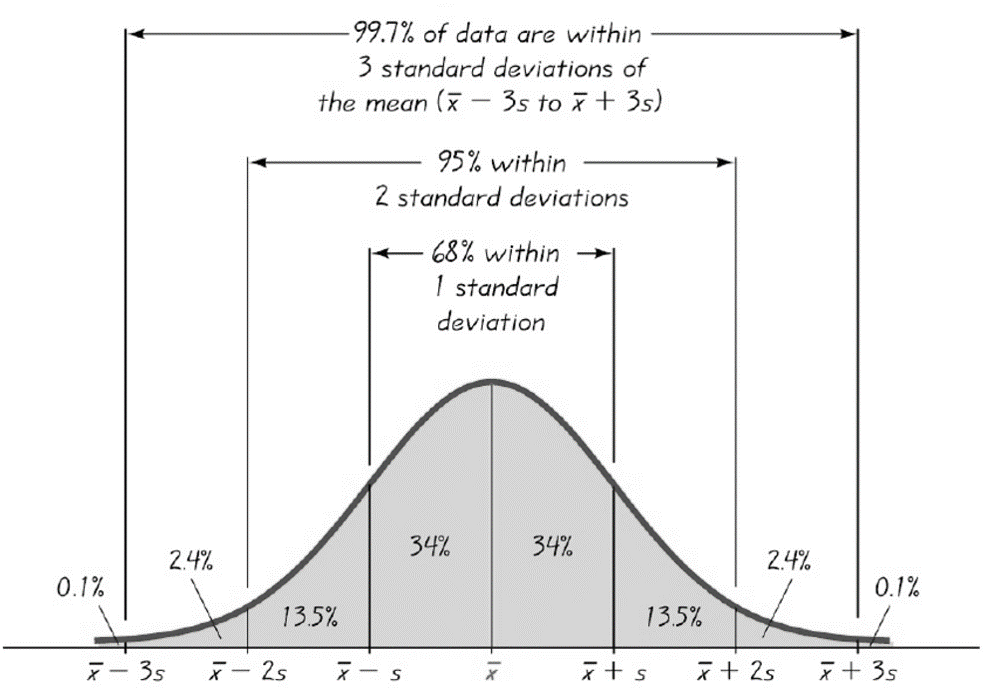
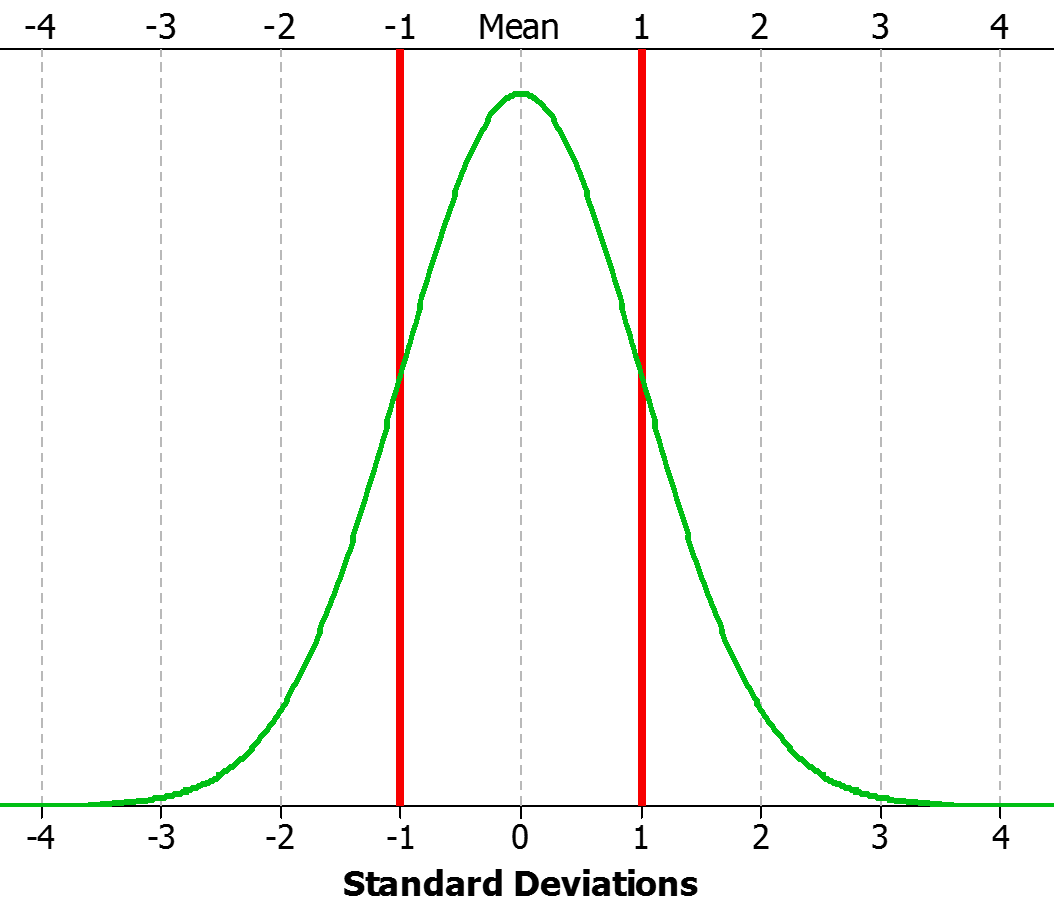
In mathematics, the lowercase sigma (σ) is commonly used to denote the standard deviation of a data set. It quantifies the extent of variability or dispersion within a set of values. The standard deviation is a fundamental statistical measure that aids in understanding the distribution of data. Standard deviation becomes a valuable tool when applied to quality control and process improvement.
Sigma in Six Sigma
In the context of Six Sigma, the lowercase sigma (σ) is intrinsically linked to the methodology's goal of minimizing process defects and variations. The sigma meaning, represented by sigma levels and this symbol, (σ), serves as a metric for process performance. It signifies the number of standard deviations that can fit within the allowable tolerance limits established by either the customer or the business.
Mathematics Meets Six Sigma
The mathematical concept of standard deviation, denoted by σ, directly applies to Six Sigma practices. Practitioners gain insights into process variation by analyzing process data and calculating standard deviations. Reducing this variation is a central objective of Six Sigma, as it leads to improved quality and customer satisfaction. Let's take a look at how this sigma applies in the practice of Six Sigma...
Understanding Levels of Sigma in Six Sigma
Levels of Sigma in Six Sigma reflect process performance and quality. The lower the sigma level, the higher the process variation, and therefore, the higher the defect rate, signifying a less efficient process. As sigma levels increase, processes become more consistent and reliable. Here's a brief overview:
- One Sigma (1σ): Processes at this level are highly variable, with many defects. Operating at One Sigma, a process will generate nearly 70% defects with a DPMO (Defects per Million Opportunities) of 697,612. In layman's terms, this process is brutally bad.
- Two Sigma (2σ): A process operating at 2σ performs over two times better than 1σ with variability decreasing substantially. However, defects persist at unacceptable rates, with a DPMO of 308,770 or a 30.87% defect rate.
- Three Sigma (3σ): This level represents more than a moderate reduction in defects. This process yields over 93% success and is more predictable, with a DPMO of 66,810 or a defect rate of 6.68%. Still, however, not desirable.
- Four Sigma (4σ): Processes operating at 4σ are very consistent and predictable with a yield of 99.4%. Yet, when considering business operations producing hundreds of thousands or more products, there is still a considerable amount of opportunity to reduce waste, cost, and defects. At this level, DPMO is 6,209 with a defect rate of 0.62%.
- Five Sigma (5σ): Quality is significantly enhanced, with minimal defects with a DPMO of only 232 and yield of 99.98%. The processes operating here are highly efficient.
- Six Sigma (6σ): This is the pinnacle of quality, where processes produce an astonishingly low rate of defects, equivalent to just 3.4 defects per million opportunities. Yield at this level is 99.9997%. This process is exceptional and represents the ultimate in performance with a defect rate of 0.00034%.
Sigma Levels Summarized
| Sigma Level | DPMO | Yield | Defect Rate |
|---|---|---|---|
| 1 | 697,612 | 30.24% | 69.76% |
| 2 | 308,770 | 69.12% | 30.88% |
| 3 | 66,810 | 93.32% | 6.68% |
| 4 | 6,209 | 99.38% | 0.621% |
| 5 | 232 | 99.98% | 0.023% |
| 6 | 3.4 | 99.9997% | 0.00034% |
The Reason Sigma Level and Defect Rates are Not Consistent with the Empirical Rule
Many observant and astute students often pose the following question. (the question comes in many forms, but the crux is something like): "I'm just working through Sigma Levels here, and you're saying that one sigma yields 70% defects. But, my understanding is that based on the empirical rule, 68% of the data will fall within +/- 1 standard deviation. That would suggest that nearly 70% of the process is good, with only a 30% defect rate. What gives?"
This is a very good question and poses one of the more disputed questions surrounding the principle of Six Sigma. How does a 1 Sigma process have a 70% defect rate when nearly 70% of the data lie within +/- 1 standard deviation?
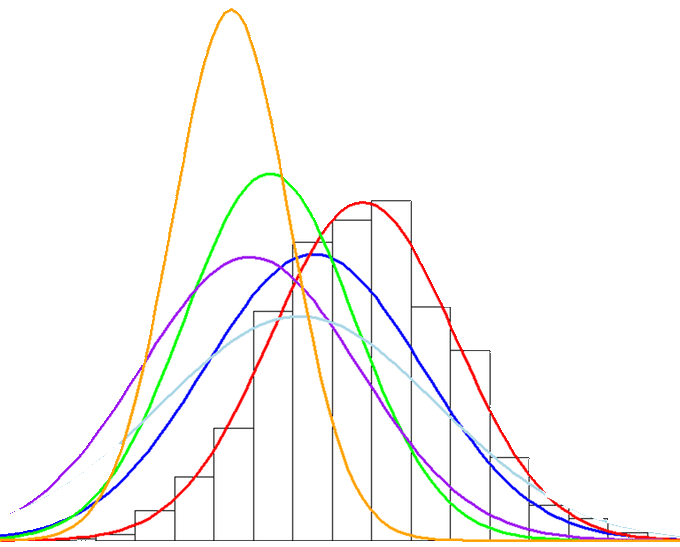
A one (1) Sigma-level process does have a defect rate of 69.76%. To explain this, we must refer to the now old and seemingly arbitrary industry standard, the 1.5 sigma shift. What the engineers at Motorola observed when studying their process performance data was that over time, their distribution of interest might maintain similar variance measurement characteristics (variance, range, stdev, min, max, etc.), but the distribution itself would "shift" or "drift" over time (long term), kind of like what is represented by the image below.
So, it was determined that Motorola's process performance distributions shift or drift over time... what does that mean? Well, they concluded that in live operations, they should expect an actual defect rate equivalent to about 1.5 sigma levels worse than the sigma level estimated from their initial, single, and static process performance distribution. Therefore, they determined for Sigma levels and DPMO, they would apply a 1.5 sigma shift to all DPMO Sigma Level estimates.
You can try it yourself in Excel...in the Six Sigma world, 6 Sigma equals 3.4 defects per million opportunities. That is 3.4/1,000,000 for a defect rate of 0.00034%. Enter this equation in excel =NORMSINV(1-0.0000034)
What did you get in return??
You should have gotten 4.4998 or 4.5, which is 1.5 less than the assumed sigma level 6 for the DPMO of 3.4.
Not everyone agrees with this "shift" theory. And, it's difficult to explain for even experienced Six Sigma instructors. In truth, it can largely be accepted with no relevant implications. In most cases. this conversation detracts from Six Sigma's intent, purpose, and value as a process improvement methodology. If you have a process yielding 99.73% (roughly 3 Sigma without the shift and almost 4.5 with the shift), it's a capable process that most businesses aspire to. Seeking higher performance yields is worthy, regardless of whether the debate is 4.5 or 6 Sigma.
6 is the Goal, Sigma (σ) is the Measure
Coming full circle, the lowercase Greek letter sigma (σ) transcends the boundaries of mathematics to become a symbol of precision, quality, and continuous improvement in the realm of Six Sigma. Its mathematical roots in standard deviation align seamlessly with the methodology's pursuit of minimizing defects and variations. By embracing the principles represented by this humble symbol and following the methodology it embodies (D.M.A.I.C), organizations and professionals can learn to use and apply Six Sigma concepts and tools to elevate their processes to the highest levels of efficiency and excellence.


