Structured analysis

In software engineering, structured analysis (SA) and structured design (SD) are methods for analyzing business requirements and developing specifications for converting practices into computer programs, hardware configurations, and related manual procedures.
Structured analysis and design techniques are fundamental tools of systems analysis. They developed from classical systems analysis of the 1960s and 1970s.[2]
Objectives of structured analysis
[edit]Structured analysis became popular in the 1980s and is still in use today. [citation needed] Structured analysis consists of interpreting the system concept (or real world situations) into data and control terminology represented by data flow diagrams. The flow of data and control from bubble to the data store to bubble can be difficult to track and the number of bubbles can increase.
One approach is to first define events from the outside world that require the system to react, then assign a bubble to that event. Bubbles that need to interact are then connected until the system is defined. Bubbles are usually grouped into higher level bubbles to decrease complexity. Data dictionaries are needed to describe the data and command flows, and a process specification is needed to capture the transaction/transformation information.[3]
SA and SD are displayed with structure charts, data flow diagrams and data model diagrams, of which there were many variations, including those developed by Tom DeMarco, Ken Orr, Larry Constantine, Vaughn Frick, Ed Yourdon, Steven Ward, Peter Chen, and others.
These techniques were combined in various published system development methodologies, including structured systems analysis and design method, profitable information by design (PRIDE), Nastec structured analysis & design, SDM/70 and the Spectrum structured system development methodology.
History
[edit]Structured analysis is part of a series of structured methods that represent a collection of analysis, design, and programming techniques that were developed in response to the problems facing the software world from the 1960s to the 1980s. In this timeframe most commercial programming was done in Cobol and Fortran, then C and BASIC. There was little guidance on "good" design and programming techniques, and there were no standard techniques for documenting requirements and designs. Systems were getting larger and more complex, and the information system development became harder and harder to do so."[4]
As a way to help manage large and complex software, the following structured methods emerged since the end of the 1960s:[4]
- Structured programming in circa 1967 with Edsger Dijkstra - "Go To Statement Considered Harmful"
- Niklaus Wirth Stepwise design in 1971
- Nassi–Shneiderman diagram in 1972
- Warnier/Orr diagram in 1974 - "Logical Construction of Programs"
- HIPO in 1974 - IBM Hierarchy input-process-output (though this should really be output-input-process)
- Structured design around 1975 with Larry Constantine, Ed Yourdon and Wayne Stevens.[5][6]
- Jackson structured programming in circa 1975 developed by Michael A. Jackson
- Structured analysis in circa 1978 with Tom DeMarco, Edward Yourdon, Gane & Sarson, McMenamin & Palmer.
- Structured analysis and design technique (SADT) developed by Douglas T. Ross
- Yourdon structured method developed by Edward Yourdon.
- Structured analysis and system specification published in 1978 by Tom DeMarco.
- Structured systems analysis and design method (SSADM) first presented in 1983 developed by the UK Office of Government Commerce.
- Essential Systems Analysis, proposed by Stephen M. McMenamin and John F. Palmer[7]
- IDEF0 based on SADT, developed by Douglas T. Ross in 1985.[8]
- Hatley-Pirbhai modeling, defined in "Strategies for Real-Time System Specification" by Derek J. Hatley and Imtiaz A. Pirbhai in 1988.
- Modern Structured Analysis, developed by Edward Yourdon, after Essential System Analysis was published, and published in 1989.[9]
- Information technology engineering in circa 1990 with Finkelstein and popularised by James Martin.
According to Hay (1999) "information engineering was a logical extension of the structured techniques that were developed during the 1970s. Structured programming led to structured design, which in turn led to structured systems analysis. These techniques were characterized by their use of diagrams: structure charts for structured design, and data flow diagrams for structured analysis, both to aid in communication between users and developers, and to improve the analyst's and the designer's discipline. During the 1980s, tools began to appear which both automated the drawing of the diagrams, and kept track of the things drawn in a data dictionary".[10] After the example of computer-aided design and computer-aided manufacturing (CAD/CAM), the use of these tools was named computer-aided software engineering (CASE).
Structured analysis topics
[edit]Single abstraction mechanism
[edit]
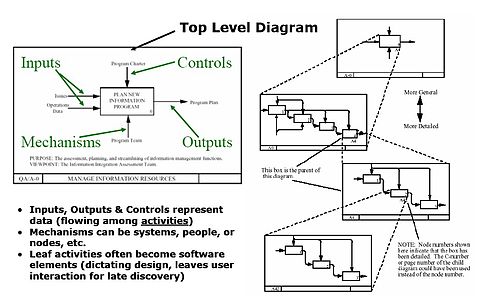
Structured analysis typically creates a hierarchy employing a single abstraction mechanism. The structured analysis method can employ IDEF (see figure), is process driven, and starts with a purpose and a viewpoint. This method identifies the overall function and iteratively divides functions into smaller functions, preserving inputs, outputs, controls, and mechanisms necessary to optimize processes. Also known as a functional decomposition approach, it focuses on cohesion within functions and coupling between functions leading to structured data.[11]
The functional decomposition of the structured method describes the process without delineating system behavior and dictates system structure in the form of required functions. The method identifies inputs and outputs as related to the activities. One reason for the popularity of structured analysis is its intuitive ability to communicate high-level processes and concepts, whether in single system or enterprise levels. Discovering how objects might support functions for commercially prevalent object-oriented development is unclear. In contrast to IDEF, the UML is interface driven with multiple abstraction mechanisms useful in describing service-oriented architectures (SOAs).[11]
Approach
[edit]Structured analysis views a system from the perspective of the data flowing through it. The function of the system is described by processes that transform the data flows. Structured analysis takes advantage of information hiding through successive decomposition (or top down) analysis. This allows attention to be focused on pertinent details and avoids confusion from looking at irrelevant details. As the level of detail increases, the breadth of information is reduced. The result of structured analysis is a set of related graphical diagrams, process descriptions, and data definitions. They describe the transformations that need to take place and the data required to meet a system's functional requirements.[12]

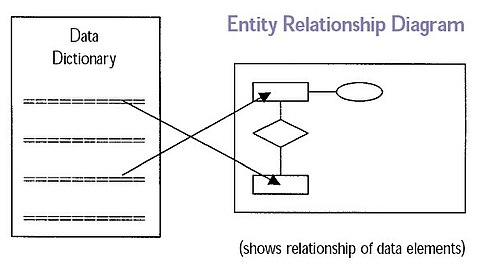
De Marco's approach[13] consists of the following objects (see figure):[12]
- Context diagram
- Data flow diagram
- Process specifications
- Data dictionary
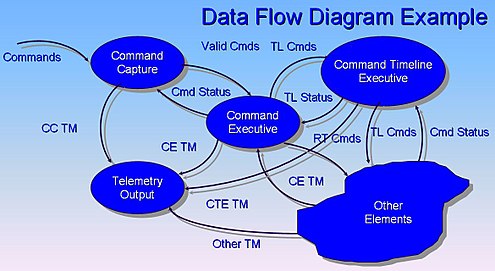
Hereby the data flow diagrams (DFDs) are directed graphs. The arcs represent data, and the nodes (circles or bubbles) represent processes that transform the data. A process can be further decomposed to a more detailed DFD which shows the subprocesses and data flows within it. The subprocesses can in turn be decomposed further with another set of DFDs until their functions can be easily understood. Functional primitives are processes which do not need to be decomposed further. Functional primitives are described by a process specification (or mini-spec). The process specification can consist of pseudo-code, flowcharts, or structured English. The DFDs model the structure of the system as a network of interconnected processes composed of functional primitives. The data dictionary is a set of entries (definitions) of data flows, data elements, files, and databases. The data dictionary entries are partitioned in a top-down manner. They can be referenced in other data dictionary entries and in data flow diagrams.[12]
Context diagram
[edit]
Context diagrams are diagrams that represent the actors outside a system that could interact with that system.[15] This diagram is the highest level view of a system, similar to block diagram, showing a, possibly software-based, system as a whole and its inputs and outputs from/to external factors.
This type of diagram according to Kossiakoff (2003) usually "pictures the system at the center, with no details of its interior structure, surrounded by all its interacting systems, environment and activities. The objective of a system context diagram is to focus attention on external factors and events that should be considered in developing a complete set of system requirements and constraints".[15] System context diagrams are related to data flow diagram, and show the interactions between a system and other actors which the system is designed to face. System context diagrams can be helpful in understanding the context in which the system will be part of software engineering.
Data dictionary
[edit]
A data dictionary or database dictionary is a file that defines the basic organization of a database.[16] A database dictionary contains a list of all files in the database, the number of records in each file, and the names and types of each data field. Most database management systems keep the data dictionary hidden from users to prevent them from accidentally destroying its contents. Data dictionaries do not contain any actual data from the database, only bookkeeping information for managing it. Without a data dictionary, however, a database management system cannot access data from the database.[16]
Database users and application developers can benefit from an authoritative data dictionary document that catalogs the organization, contents, and conventions of one or more databases.[17] This typically includes the names and descriptions of various tables and fields in each database, plus additional details, like the type and length of each data element. There is no universal standard as to the level of detail in such a document, but it is primarily a distillation of metadata about database structure, not the data itself. A data dictionary document also may include further information describing how data elements are encoded. One of the advantages of well-designed data dictionary documentation is that it helps to establish consistency throughout a complex database, or across a large collection of federated databases.[18]
Data flow diagrams
[edit]
A data flow diagram (DFD) is a graphical representation of the "flow" of data through an information system. It differs from the system flowchart as it shows the flow of data through processes instead of computer hardware. Data flow diagrams were invented by Larry Constantine, developer of structured design, based on Martin and Estrin's "data flow graph" model of computation.[20]
It is common practice to draw a system context diagram first which shows the interaction between the system and outside entities. The DFD is designed to show how a system is divided into smaller portions and to highlight the flow of data between those parts. This context-level data flow diagram is then "exploded" to show more detail of the system being modeled.
Data flow diagrams (DFDs) are one of the three essential perspectives of structured systems analysis and design method (SSADM). The sponsor of a project and the end users will need to be briefed and consulted throughout all stages of a system's evolution. With a data flow diagram, users are able to visualize how the system will operate, what the system will accomplish, and how the system will be implemented. The old system's data flow diagrams can be drawn up and compared with the new system's data flow diagrams to draw comparisons to implement a more efficient system. Data flow diagrams can be used to provide the end user with a physical idea of where the data they input ultimately has an effect upon the structure of the whole system from order to dispatch to recook. How any system is developed can be determined through a data flow diagram.
Structure chart
[edit]
A structure chart (SC) is a chart that shows the breakdown of the configuration system to the lowest manageable levels.[21] This chart is used in structured programming to arrange the program modules in a tree structure. Each module is represented by a box which contains the name of the modules. The tree structure visualizes the relationships between the modules.[22]
Structure charts are used in structured analysis to specify the high-level design, or architecture, of a computer program. As a design tool, they aid the programmer in dividing and conquering a large software problem, that is, recursively breaking a problem down into parts that are small enough to be understood by a human brain. The process is called top-down design, or functional decomposition. Programmers use a structure chart to build a program in a manner similar to how an architect uses a blueprint to build a house. In the design stage, the chart is drawn and used as a way for the client and the various software designers to communicate. During the actual building of the program (implementation), the chart is continually referred to as the master-plan.[23]
Structured design
[edit]Structured design (SD) is concerned with the development of modules and the synthesis of these modules in a so-called "module hierarchy".[24] In order to design optimal module structure and interfaces two principles are crucial:
- Cohesion which is "concerned with the grouping of functionally related processes into a particular module",[12] and
- Coupling relates to "the flow of information or parameters passed between modules. Optimal coupling reduces the interfaces of modules and the resulting complexity of the software".[12]
Structured design was developed by Larry Constantine in the late 1960s, then refined and published with collaborators in the 1970s;[5][6] see Larry Constantine: structured design for details. Page-Jones (1980) has proposed his own approach which consists of three main objects :
- structure charts
- module specifications
- data dictionary.
The structure chart aims to show "the module hierarchy or calling sequence relationship of modules. There is a module specification for each module shown on the structure chart. The module specifications can be composed of pseudo-code or a program design language. The data dictionary is like that of structured analysis. At this stage in the software development lifecycle, after analysis and design have been performed, it is possible to automatically generate data type declarations",[25] and procedure or subroutine templates.[12]
Criticisms
[edit]Problems with data flow diagrams have included the following:[3]
- Choosing bubbles appropriately
- Partitioning bubbles in a meaningful and mutually agreed upon manner,
- Documentation size needed to understand the Data Flows,
- Data flow diagrams are strongly functional in nature and thus subject to frequent change
- Though "data" flow is emphasized, "data" modeling is not, so there is little understanding the subject matter of the system
- Customers have difficulty following how the concept is mapped into data flows and bubbles
- Designers must shift the DFD organization into an implementable format
See also
[edit]- Event partitioning
- Flow-based programming
- HIPO
- Jackson structured programming
- Prosa Structured Analysis Tool
- Soft systems methodology
References
[edit]- ^ Tricia Gilbert (2006) FCS Evaluation criterea for technology assessment Archived 2008-09-18 at the Wayback Machine
- ^ Edward Yourdon (1986). Managing the Structured Techniques: Strategies for Software Development in the 1990s. Yourdon Press. p.35.
- ^ a b FAA (2000). FAA System Safety Handbook, Appendix D. December 30, 2000.
- ^ a b Dave Levitt (2000). "Introduction to Structured Analysis and Design." at faculty.inverhills.edu/dlevitt. Retrieved 21 Sep 2008. No longer online 2017.
- ^ a b Stevens, Myers & Constantine 1974.
- ^ a b Yourdon & Constantine 1979.
- ^ McMenamin, Stephen M.; Palmer, John F. (1984). Essential Systems Analysis. Yourdon Press. ISBN 978-0-13-287905-7.
- ^ Gavriel Salvendy (2001). Handbook of Industrial Engineering: Technology and Operations Management.. p.508.
- ^ Yourdon, Edward (1989). Modern Structured Analysis. Prentice-Hall. ISBN 978-0-13-598632-5.
- ^ David C. Hay (1999) Achieving buzzword compliance in Object orientation Archived 2008-10-20 at the Wayback Machine Essential Strategies, Inc.
- ^ a b c DoD Architecture Framework Working Group (2003). DoDAF 1.5 Volume 2, 15 August 2003.
- ^ a b c d e f g Alan Hecht and Andy Simmons (1986) Integrating Automated Structured Analysis and Design with Ada Programming Support Environments NASA 1986.
- ^ Tom DeMarco (1978). Structured Analysis and System Specification. Yourdon Press, New York, 1978.
- ^ NDE Project Management Archived 2008-11-07 at the Wayback Machine (NPOESS) Data Exploitation web site. 2008.
- ^ a b Alexander Kossiakoff, William N. Sweet (2003). Systems Engineering: Principles and Practices p. 413.
- ^ a b c Data Integration Glossary Archived 2012-02-18 at the Wayback Machine, U.S. Department of Transportation, August 2001.
- ^ TechTarget, SearchSOA, What is a data dictionary?
- ^ AHIMA Practice Brief, Guidelines for Developing a Data Dictionary, Journal of AHIMA 77, no.2 (February 2006): 64A-D.
- ^ John Azzolini (2000). Introduction to Systems Engineering Practices. July 2000.
- ^ W. Stevens, G. Myers, L. Constantine, "Structured Design", IBM Systems Journal, 13 (2), 115-139, 1974.
- ^ a b "Configuration Management" In: IRS Resources Part 2. Information Technology Chapter 27. Configuration Management. Accessed 14 Nov 2008.
- ^ James Martin, Carma L. McClure (1988). Structured Techniques: The Basis for Case. Prentice Hall. p.56.
- ^ David Wolber "Structure Charts Archived 2009-02-19 at the Wayback Machine: Supplementary Notes Structure Charts and Bottom-up Implementation: Java Version.
- ^ Page-Jones 1980.
- ^ Belkhouche, B., and J.E. Urban. (1986). "Direct Implementation of Abstract Data Types from Abstract Specifications". In: IEEE Transactions on Software Engineering pp. 549-661, May 1986.
Further reading
[edit]- Stevens, W. P.; Myers, G. J.; Constantine, L. L. (June 1974). "Structured design". IBM Systems Journal. 13 (2): 115–139. doi:10.1147/sj.132.0115.
- Yourdon, Edward; Constantine, Larry L. (1979) [1975]. Structured Design: Fundamentals of a Discipline of Computer Program and Systems Design. Yourdon Press. ISBN 0-13-854471-9.
- Tom DeMarco (1978). Structured Analysis and System Specification. Yourdon. ISBN 0-91-707207-3
- Page-Jones, M (1980), The Practical Guide to Structured Systems Design, New York: Yourdon Press
- Derek J. Hatley, Imtiaz A. Pirbhai (1988). Strategies for Real Time System Specification. John Wiley and Sons Ltd. ISBN 0-932633-04-8
- Stephen J. Mellor und Paul T. Ward (1986). Structured Development for Real-Time Systems: Implementation Modeling Techniques: 003. Prentice Hall. ISBN 0-13-854803-X
- Edward Yourdon (1989). Modern Structured Analysis, Yourdon Press Computing Series, 1989, ISBN 0-13-598624-9
- Keith Edwards (1993). Real-Time Structured Methods, System Analysis. Wiley. ISBN 0-471-93415-1
External links
[edit]- Structured Analysis Wiki
- Three views of structured analysis CRaG Systems, 2004.