User:Hbf878

| Babel user information | |||||||||
|---|---|---|---|---|---|---|---|---|---|
| |||||||||
| Users by language | |||||||||
COVID-19
[edit]Data sources
[edit]Since 2020-03-24, I used data published by the European Centre for Disease Prevention and Control (ECDC) for generating the COVID-related graphs. The ECDC doesn't report the number of recovered patients, thus recovered patients were omitted from the graphs. ECDC reports were generated daily around noon (CET), based on the numbers that national health agencies report.
Since January 2021, I use data from the World Health Organisation.
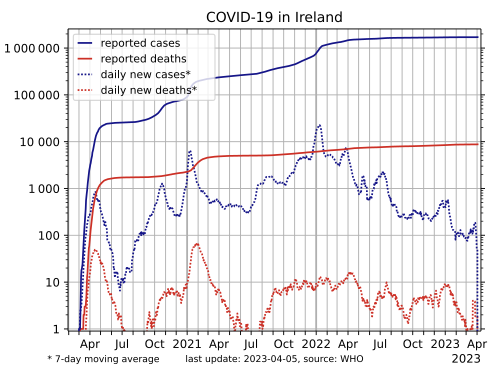
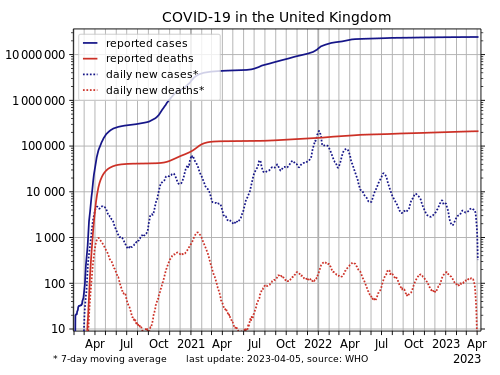
Why are there gaps in the daily new cases curves? From time to time, national health agencies adjust their counting method or correct for cases where infections were counted multiple times, which leads to a nominal decrease on that day. As negative values cannot be shown on a logarithmic scale, the curves have a gap on that day.
What does 7-day moving average mean? This means that each value that is plotted is actually the average value of that day, the three days before and the three days after. For example, the value plotted for 2020-03-15 is the average of the values from 2020-03-12 until 2020-03-18 (incl). This makes the incremental curves a little smoother and eliminates the effect of the weekdays (i.e. the fact that there are less cases reported on the weekends due to health agencies being unstaffed).
Logarithmic country charts are uploaded every three days and the non-logarithmic charts every nine days.
COVID-19 Charts
[edit]Vaccination statistics
[edit]-
Vaccinations administered per 100 inhabitants in a selection of countries in Europe.
-
Vaccinations administered per 100 inhabitants in a selection of countries worldwide.
EU/Europe statistics
[edit]The following charts show incremental statistics, i.e. how many new cases and deaths occur each day. This is an indicator for how quickly the pandemic is progressing right now. The shown statistics are corrected for population size of the respective countries (relative to population), to facilitate comparison between countries of different population sizes.
- COVID-19 cases and deaths in Europe (incremental statistics)
-
Daily increase in COVID-19 cases in Europe, per 1000 inhabitants (relative).
-
Daily increase in COVID-19 deaths in Europe, per 1 million inhabitants (relative).
-
Daily increase in COVID-19 cases in Europe, per 1000 inhabitants (relative), log-scaled y-axis.
-
Daily increase in COVID-19 deaths in Europe, per 1 million inhabitants (relative), log-scaled y-axis.
The following graphs show the number of confirmed COVID-19 / "Corona virus" cases in the European Union and in Europe's most affected countries.
- COVID-19 cases and deaths in Europe (cumulative statistics)
-
COVID-19 cases in countries of the European Union (absolute)
-
COVID-19 cases in countries of the European Union (absolute), log-scaled
-
COVID-19 cases in countries of the European Union per 1000 inhabitants (relative).
-
COVID-19 cases in countries of the European Union per 1000 inhabitants (relative), log-scaled
-
COVID-19 deaths in countries of the European Union per 1 million inhabitants (relative), log-scaled
-
COVID-19 deaths in a selection of European countries per 1 million inhabitants (relative), log-scaled
European countries
[edit]-
COVID-19 in Austria, log-scaled
-
COVID-19 in Belarus, log-scaled
-
COVID-19 in Belgium, log-scaled
-
COVID-19 in Bosnia and Herzegovina, log-scaled
-
COVID-19 in Bulgaria, log-scaled
-
COVID-19 in Croatia, log-scaled
-
COVID-19 in Cyprus, log-scaled
-
COVID-19 in Czech Republic, log-scaled
-
COVID-19 in Denmark, log-scaled
-
COVID-19 in Estonia, log-scaled
-
COVID-19 in Finland, log-scaled
-
COVID-19 in France, log-scaled
-
COVID-19 in Germany, log-scaled
-
COVID-19 in Greece, log-scaled
-
COVID-19 in Hungary, log-scaled
-
COVID-19 in Iceland, log-scaled
-
COVID-19 in Ireland, log-scaled
-
COVID-19 in Italy, log-scaled
-
COVID-19 in Latvia, log-scaled
-
COVID-19 in Lithuania, log-scaled
-
COVID-19 in Luxembourg, log-scaled
-
COVID-19 in Malta, log-scaled
-
COVID-19 in Moldova, log-scaled
-
COVID-19 in the Netherlands, log-scaled
-
COVID-19 in Poland, log-scaled
-
COVID-19 in Portugal, log-scaled
-
COVID-19 in Romania, log-scaled
-
COVID-19 in Russia, log-scaled
-
COVID-19 in Serbia, log-scaled
-
COVID-19 in Slovakia, log-scaled
-
COVID-19 in Slovenia, log-scaled
-
COVID-19 in Spain, log-scaled
-
COVID-19 in Sweden, log-scaled
-
COVID-19 in Switzerland, log-scaled
-
COVID-19 in Ukraine
-
COVID-19 in the United Kingdom, log-scaled
Asian countries
[edit]-
COVID-19 in Armenia, log-scaled
-
COVID-19 in Bahrain, log-scaled
-
COVID-19 in Bangladesh, log-scaled
-
COVID-19 in China, log-scaled
-
COVID-19 in Georgia, log-scaled
-
COVID-19 in India, log-scaled
-
COVID-19 in Indonesia, log-scaled
-
COVID-19 in Iran, log-scaled
-
COVID-19 in Iraq, log-scaled
-
COVID-19 in Israel, log-scaled
-
COVID-19 in Japan, log-scaled
-
COVID-19 in Jordan, log-scaled
-
COVID-19 in Kazakhstan, log-scaled
-
COVID-19 in Kuwait, log-scaled
-
COVID-19 in Lebanon, log-scaled
-
COVID-19 in Malaysia, log-scaled
-
COVID-19 in Myanmar, log-scaled
-
COVID-19 in Nepal, log-scaled
-
COVID-19 in Oman, log-scaled
-
COVID-19 in Pakistan, log-scaled
-
COVID-19 in the Philippines, log-scaled
-
COVID-19 in Qatar, log-scaled
-
COVID-19 in Saudi Arabia, log-scaled
-
COVID-19 in Singapore, log-scaled
-
COVID-19 in South Africa, log-scaled
-
COVID-19 in South Korea, log-scaled
-
COVID-19 in Taiwan, log-scaled
-
COVID-19 in Turkey, log-scaled
-
COVID-19 in the United Arab Emirates, log-scaled
American countries
[edit]-
COVID-19 in Argentina, log-scaled
-
COVID-19 in Bolivia, log-scaled
-
COVID-19 in Brazil, log-scaled
-
COVID-19 in Canada, log-scaled
-
COVID-19 in Chile, log-scaled
-
COVID-19 in Colombia, log-scaled
-
COVID-19 in Costa Rica, log-scaled
-
COVID-19 in the Dominican Republic, log-scaled
-
COVID-19 in Ecuador, log-scaled
-
COVID-19 in Guatemala, log-scaled
-
COVID-19 in Honduras, log-scaled
-
COVID-19 in Mexico, log-scaled
-
COVID-19 in Panama, log-scaled
-
COVID-19 in Paraguay, log-scaled
-
COVID-19 in Peru, log-scaled
-
COVID-19 in the United States, log-scaled
-
COVID-19 in Venezuela, log-scaled
African countries
[edit]-
COVID-19 in Algeria, log-scaled
-
COVID-19 in Egypt, log-scaled
-
COVID-19 in Ethiopia, log-scaled
-
COVID-19 in Kenya, log-scaled
-
COVID-19 in Libya, log-scaled
-
COVID-19 in Morocco, log-scaled
-
COVID-19 in Nigeria, log-scaled
-
COVID-19 in Tunisia, log-scaled
Worldwide
[edit]-
COVID-19 worldwide, log-scaled
SVG stuff
[edit]Text in SVG - Objects or paths?
[edit]In SVG, information can be stored as objects or as paths. For example, if an image contains the letter "H", this letter can be stored as an object (make a textbox at position x,y and inside this textbox draw a capital letter H, font Arial, size 10pt) or as a path (in position x,y draw a shape consisting of a vertical line, then right thereof a horizontal line in the center of the first line, then another vertical line at the right end of the horizontal line).
Both options have advantages and disadvantages:
The object variant is smaller in file size and preserves the "intention" of each thing in an image: the text strings in a textbox are preserved and can therefore be edited afterwards easily; "true" text is also very useful for translations. However, the correct rendering of an image requires that the renderer knows the used font, paragraph options etc. This is often not the case for different renderers: an image that looks as intended in Inkscape or in a web browser will probably look significantly different on Wikimedia Commons. Especially chemical formulas containing super- and subtext tend to mess up.
An image containing only paths will look virtually the same everywhere, regardless of installed fonts etc. By converting SVGs from objects to paths (for example using Inkscape by selecting all objects (ctrl+A) and converting them to paths (ctrl+shift+C)), one can make sure that an image will look as intended after uploading to Wikimedia Commons. But all-path images are larger in file size and harder to edit, because all strings in the image are lost - this can be unpractical for translating SVG images or editing spelling mistakes.
Therefore, until the rendering of textboxes in SVGs on Wikipedia has been improved, I've decided to upload both versions of all chemistry-related SVG files containing a significant amount of text: first the object version, for other users to edit easily. The path version (version comment: "objects converted to paths") comes second, to make sure the image will look as intended. In case that at some point the Wikimedia SVG renderer will improve significantly, feel free to revert all my uploads to the objects version.
If you want to edit one of those SVGs, it's probably better to go for the objects version. After editing, I'd suggest that you again first upload the edited objects version and then overwrite it with the paths version for beautiful optics.
Reduce SVG file sizes
[edit]Saving as optimized SVG (calls the program scour) in inkscape and set number of significant digits to something like 5 will lead to a rounding of the majority of stored numbers. For further optimization, the tool SVGO (also available as web page SVGOMG on github) has proven to be useful (merge paths, round numbers, remove metadata).
I have used these optimizations for all SVGs I uploaded, resulting on average in a 50% reduction in file size.
My Contributions
[edit]I mainly focus on redrawing frequently used chemical images as SVGs. I use the categories Chemical_images_that_should_use_vector_graphics and Chemistry_images_that_should_use_vector_graphics to find out which images require attention. From time to time, I also edit other people's SVGs if they contain errors.
Most images that I made originally can be found in Category:Files_by_User:Hbf878. Statistics about their usage can be found here.
My chemistry drawing style
[edit]My drawing settings are similar (but not identical) to ACS.
- Bond length: 0.508 cm
- Double bond spacing: 16% (ACS: 18%)
- Line width: 0.021 cm
- Hash spacing: 0.078 cm (ACS: 0.088 cm)
- Font: Arial
- Fontsize: 9 pt (ACS: 10 pt) for molecules, 8 pt for reagents / reaction conditions etc
Usually I then convert the generated SVG to all-paths (see above). However, if an image contains large amounts of text, I set the font to Liberation Sans and don't convert text to path to keep file size low and text editable. If an SVG contains plain, non-path text with small font size, scaling up the textboxes or the whole SVG may be helpful to stop character spacing from messing up (see Help:SVG#Text_transform_limitations).
VG-1 | This user is able to contribute with a basic level on vector graphics. |


