Preprint
Article
Waste-Derived Fertilizer Acts as Biostimulant, Boosting Tomato Quality and Aroma
Altmetrics
Downloads
99
Views
40
Comments
0
A peer-reviewed article of this preprint also exists.
Abstract
Tomato quality is intricately regulated by a combination of factors, including the presence of bioactive compounds referred to as secondary metabolites and various organoleptic characteristics. These attributes are notably influenced and harmonized by the specific growing conditions, with a particular emphasis on the type of fertilization employed. Traditionally, chemical fertilizers have been favoured in crop cultivation due to their cost-effectiveness and ability to accelerate crop growth. However, in pursuit of sustainable and intelligent agricultural practices, there is a growing need for alternative fertilizers. In this context, the present study aimed to assess the impact of fertilizers derived from waste materials, specifically sulphur bentonite and orange residue (referred to as SB), on tomato quality. This assessment extended to examining qualitative and quantitative alterations in aroma-related volatile compounds and the antioxidant systems of tomatoes, in comparison to the conventional use of fertilizers such as horse manure and NPK (nitrogen, phosphorus, and potassium). The results obtained revealed distinct effects of different fertilizers on tomato quality. Notably, parameters such as TPRO (total protein), TCARB (total carbohydrate), LIC (lycopene content), TCAR (total carotenoid content), total phenols, total flavonoids, and aroma profiling exhibited significantly superior values in the group treated with SB fertilizer. These findings strongly suggest that the novel fertilizer functioned as a bio-stimulant, enhancing the nutraceutical and sensory attributes of tomatoes, with a pronounced impact on the synthesis of secondary metabolites and the aroma profile of the fruits.
Keywords:
Submitted:
11 October 2023
Posted:
12 October 2023
You are already at the latest version
Alerts
A peer-reviewed article of this preprint also exists.
Submitted:
11 October 2023
Posted:
12 October 2023
You are already at the latest version
Alerts
Abstract
Tomato quality is intricately regulated by a combination of factors, including the presence of bioactive compounds referred to as secondary metabolites and various organoleptic characteristics. These attributes are notably influenced and harmonized by the specific growing conditions, with a particular emphasis on the type of fertilization employed. Traditionally, chemical fertilizers have been favoured in crop cultivation due to their cost-effectiveness and ability to accelerate crop growth. However, in pursuit of sustainable and intelligent agricultural practices, there is a growing need for alternative fertilizers. In this context, the present study aimed to assess the impact of fertilizers derived from waste materials, specifically sulphur bentonite and orange residue (referred to as SB), on tomato quality. This assessment extended to examining qualitative and quantitative alterations in aroma-related volatile compounds and the antioxidant systems of tomatoes, in comparison to the conventional use of fertilizers such as horse manure and NPK (nitrogen, phosphorus, and potassium). The results obtained revealed distinct effects of different fertilizers on tomato quality. Notably, parameters such as TPRO (total protein), TCARB (total carbohydrate), LIC (lycopene content), TCAR (total carotenoid content), total phenols, total flavonoids, and aroma profiling exhibited significantly superior values in the group treated with SB fertilizer. These findings strongly suggest that the novel fertilizer functioned as a bio-stimulant, enhancing the nutraceutical and sensory attributes of tomatoes, with a pronounced impact on the synthesis of secondary metabolites and the aroma profile of the fruits.
Keywords:
Subject: Biology and Life Sciences - Agricultural Science and Agronomy
1. Introduction
Tomato (Solanum lycopersicum L) stands out as one of the most beloved vegetables globally, belonging to the esteemed Solanaceae family. It takes the second spot in vegetable consumption worldwide, trailing only behind potatoes and sweet potatoes. Furthermore, it ranks prominently among canned vegetables, contributing significantly to the economic prosperity of producer nations [1].
Tomato boasts remarkable culinary adaptability and impressive nutraceutical attributes. This versatile fruit is enjoyed in both its fresh and cooked forms by a vast and diverse array of consumers. With just 30 calories per 100 grams and a low-fat profile, it makes for a health-conscious choice. What sets tomato apart is its abundance of antioxidants and its role as a rich source of essential vitamins (C and E), carotenoids (such as lycopene and β-carotene), and a myriad of other phenolic compounds [2,3]. Thanks to its substantial content of bioactive compounds, which remain largely unaffected by the ripening and cooking processes and, in some cases, even become more pronounced, tomato earns its place among functional foods [4].
In today's health-conscious society, consumers are increasingly drawn to vegetables brimming with these bioactive compounds, renowned for their positive impact on human health. These compounds have been proven to shield cells from oxidative damage and play a preventive role against the onset of degenerative diseases like cancer, cardiovascular diseases, diabetes, Alzheimer’s, and Parkinson’s [5].
The global surge in tomato production can be attributed more to increased yield rather than mere expansion of the cultivated area, as result of an over use of fertilizers in particular chemical fertilizers. Tomato, that grows more on soil over-fertilized with chemicals, is more subject to pest diseases requiring a major use of pesticides which in turn negatively impact on soil and human health. Crop quality, in terms of nutritional values, is more important than productivity today, thus there is the urgent need to identify sustainable agricultural practices to produce high quality food without affecting its productivity.
Crop quality is regulated by the content of bioactive compounds known as secondary metabolites and by the organoleptic aspects that are affected and balanced by the growing conditions, and in particular, by the type of fertilization used [6]. Generally, the fertilizers used for crop cultivation are chemical fertilizers for their low cost and fast-growing inducer crop capacity because nutrients are more readily available to plants than organic fertilizers. Previous works demonstrated the effects of different fertilization practice on the quality of diverse crops. Dumas et al. [7] showed that treatments of crops with chemical fertilizers reduced the quantity of bio-compounds with antioxidant properties. Young et al., evidenced that cabbage, spinach, and pepper contained more antioxidants when cultivated with organic than chemical fertilizers. [8]. Verma et al. [9] showed as the application of bioaugmented compost improved antioxidant properties in tomato. Jin et al. [10] evidenced that the reduction of chemical fertilizers improved the quality of lettuce. Moradzadeh et al., [11] showed as the combined use of chemical and organic fertilizers ameliorated agro-biochemical attributes of black cumin. Additionally, Akiyama et al. [12] showed that nutritional values of tomatoes grown with organic fertilizers were higher than those amended with chemical fertilizers.
The growth of tomatoes is notably influenced by the presence of sulfur and sulfur-containing compounds, which serve as vital signaling molecules in normal metabolic processes as well as during periods of stress. An important study by Silva et al. [13] underscored that the application of sulfur led to an enhancement in tomato yield and fruit production. However, there is a dearth of comprehensive information concerning how sulfur fertilization may impact the quality of tomatoes, particularly in terms of bioactive compounds and their aromatic profiles. Furthermore, no prior research has delved into the effects of sulfur fertilization when combined with organic components on tomato quality.
Given the aforementioned knowledge gap, the objectives of this current study were two-fold:
To assess how the utilization of sulfur bentonite in conjunction with orange residue act as bio-stimulant influencing tomato quality and its antioxidant systems, in comparison to the effects of horse manure and NPK fertilizer.
To explore both the qualitative and quantitative alterations in the volatile compounds associated with tomato aroma induced by SB when compared to horse manure and NPK fertilizer.
2. Results and Discussion
Table 1 reveals that SB and HM-treated tomatoes exhibited notably high levels of total proteins and carbohydrates. Moreover, lycopene and carotenoid content demonstrated a significant lead in tomatoes cultivated with SB, followed by HM, NPK, and CTR treatments (Table 1). This confluence of heightened proteins and carbohydrates, coupled with the substantial increase in total carotenoids and lycopene in SB-treated tomatoes, bestows upon them an enhanced nutraceutical value. These compounds collectively contribute to the promotion of human health and the prevention of various diseases, making SB-treated tomatoes a particularly healthful choice.
The remarkable surge in biomolecules observed in SB-treated tomatoes aligns seamlessly with the findings of numerous other researchers who have emphasized the pivotal role of sulfur (S) as a key nutrient for crop growth and development. Sulfur is intricately involved in the synthesis of amino acids and proteins, rendering it indispensable for plant vitality. In today's context, it is imperative to note that a substantial proportion of soils, approximately 46%, are deficient in sulfur, and crops can only assimilate a mere fraction of the S compared to nitrogen (N). This underscores the critical importance of sulfur fertilization, as it not only fills this nutrient gap but also enhances the efficiency of nitrogen uptake, thereby maintaining a balanced nutrient profile [14,15,16,17,18].
The quality of tomatoes exhibited distinct responses to various fertilizers. The findings, as presented in Table 1, unequivocally demonstrate that tomatoes treated with SB (sulfur and organic mix) outperformed other treatments, behaving as a biostimulant and significantly elevating the levels of total phenols and total flavonoids. However, it's worth noting that there were no significant differences observed in the vitamin E content among the differently treated tomatoes (Table 1).
In contrast, a substantial increase in vitamin A and C content was evident in tomatoes cultivated with SB fertilizer. This suggested that the combination of organic and elemental sulfur may offer a more effective nutritional boost compared to sole reliance on either organic or inorganic fertilization. This enhanced nutrient availability is likely attributable to the diverse array of micro and macro nutrients offered by this mix, in contrast to mineral fertilizers that primarily consist of only three major elements: Nitrogen (N), Phosphorus (P), and Potassium (K), and organic fertilizers that may be deficient in sulfur.
Furthermore, when assessing total antioxidant capacity and ABTS levels, tomatoes fertilized with SB displayed the highest values, while DPPH levels were comparable to those of NPK-treated tomatoes, being the lowest among the treatments (Table 1).
Two recent research articles shed new light on the role of sulfur in the redox system. Sulfur emerges as a fundamental nutrient in the biosynthesis of secondary metabolites renowned for their high nutritional value. It has been convincingly demonstrated that sulfur exerts a positive influence on the accumulation of total phenols and flavonoids, compounds known for their potent antioxidant properties and remarkable nutraceutical value. Our data corroborates the findings of numerous other researchers, underscoring how sulfur fertilization not only augments total phenols and flavonoids in sulfur-loving crops such as garlic [19], cabbage [20], onion [21,22], and broccoli [15], but also in other species like artichoke [23] and tomato [24].
The literature consistently reports that total phenols and flavonoids possess significant antioxidant, anticancer, and antibacterial attributes. They have demonstrated efficacy as cardioprotective agents, anti-inflammatory substances, immune system boosters, and protective agents against UV radiation, thus exhibiting substantial potential for applications in the pharmaceutical and medical sectors [25,26,27].
The increase in total phenols and total flavonoids justified also the increase in antioxidant activities in SB treated tomato. Pearson coefficient results, evidenced a positive significant correlation between total flavonoids, TAC and at minor extent ABTS, and a negative correlation with DPPH. Total phenols were not significantly correlated with ABTS and TAC, but were negatively correlated with DPPH. In SB treated tomato, the observed increase in carotenoids known for their ability to prevent numerous chronic degenerative diseases through an antioxidant action [28] confirmed the major involvement of total flavonoids than total phenols as antioxidants. Numerous authors reported results evidencing a correlation between carotenoids and in particular lycopene intake and the slowing down of cancer and cardiac diseases [29,30]. Single phenolic acids were differently affected by the diverse fertilizations (Table 3). No significant differences among the treatments were observed for o-coumaric, 2,5 dihydroxy-benzoic and caffeic acids. Conversely protocatechuic and syringic appeared only in fertilized tomato in respect to control and no differences between the different fertilizations were observed. Trans cinnamic acid was induced only by HM fertilizer, while trans-4-hydroxycinnamic acid was the highest in SB treated tomato (Table 3). These results suggest that the antioxidant activity found in SB treated tomato could be related mainly and solely to trans-4-hydroxycinnamic acid. Regarding the single flavonoids, (Table 5), SB increased the synthesis of apigenin, tocopherol, vitexin, catechin and naringin in respect to control and to the other fertilizers. A recent manuscript [31] evidenced the important involvement of flavonoids in inflammatory response highlighting their contribute to pathological pain by promoting plastic changes in the periphery and central nervous system (CNS) which in turn modify the neuronal phenotype and function. In particular, it was well demonstrated that these flavonoids diminished the neutrophil infiltration, had anti-inflammatory effect inhibiting cytokines, and antioxidant activity scavenging hydroxyl (•OH) radicals, additionally they showed also effects comparable to the corticoid prednisolone [32,33,34,35]. Kopustinshiene et al., evidenced as the quotidian consume of flavonoid-rich foods was able to cause beneficial changes in the gut microbiota, diminishing the risk of cancer and normalizing vital functions at cellular level [36]. In short, data obtained evidenced SB fertilization increased important phytochemical compounds in tomato enhancing its nutraceutical value. Pearson correlation results between single phenolic acids and antioxidant activities evidenced a strong positive correlation between protocatechuic, syringic, trans-4 hydroxycinnamic acid and ABTS and TAC (Figure 1). Conversely ferulic acid correlated positively with DPPH. Regarding single flavonoids (Figure 2) only catechin, naringin, apigenin and at minor extent vitexin positively and significantly correlated with TAC (Figure 2). ABTS correlated only with catechin, the other flavonoids were negatively or not correlated with ABTS, TAC and DPPH activities. Considering that SB tomato contained the highest amount of trans-4 hydroxycinnamic acid, apigenin, catechin, naringin and vitexin, its antioxidant value may be ascribed to these compounds that are positively and significantly correlated with TAC and ABTS. PCA analysis of primary and secondary metabolites evidenced positive effects of SB on vitamin A, ABTS and total phenols (Figure 3). HM influenced the synthesis of primary metabolites, TAC, TCAR, VITE and C (Figure 3). No positive effects were instead observed without fertilizations and in presence of NPK (Figure 3). PCA confirmed the positive correlation of SB with important single phenolic acids such as syringic, protocatechuic and trans-4-hydroxycinnamic (Figure 4) with proven beneficial effects on human health for their antioxidant activities as already highlighted by Pearson correlation matrix. Single flavonoid synthesis was also affected by SB and, as reported in Figure 5, the flavonoids more affected by SB were catechin, apigenin, vitexin and naringin, those that more correlated with the antioxidant activities.
In short, our results evidenced SB was the fertilizer with biotimulant properties, that influenced in a prominent way the quality of tomato fruits increasing bioactive compounds with nutritional value and health benefit.
Regarding the Aroma Profiling, 46 volatile compounds, (Figure 6), were extrapolated from the chromatographic profiles. The volatile compounds identified in tomato were, primarily aldehydes, alcohols, ketones, esters, organic acids, terpenes and pyrazine compounds. Their relative intensities are shown as a heat map (Figure 7).
Aldehydes were the main compounds in all samples with large intra-class variations, followed by alcohols, terpenes and ketones. HM treated tomato fruits had the highest concentration of aldehydes. The aromatic fraction of SB treated tomato fruits was characterized by the highest percentage of aldehydes and high concentration of esters and terpenes. Tomato fertilized with NPK were characterized by the highest percentage of aldehydes and high concentration of both alcohols and terpenes. The pyrazine compounds were found only in tomato fruit fertilized with SB and NPK. The SB treated tomato showed the highest percentage of both aldehydes and pyrazine compounds.
The four tomato samples were clearly distinguishable by their differences in the relative intensities of these factors. Tomato fruits treated with HM was the highest out of all samples in 1-Propanol, 2-methyl- and Propanal. Tomato fruits fertilized with SB contained high levels of Hexanal, followed by Acetaldehyde and Propanal known to have ethereal and pungent characteristics. Tomato fruits fertilized with NPK showed relatively higher levels of Propanal, 1-Propanol, 2-methyl-, Acetaldehyde and Ethyl hexanoate than the other treated tomato. Of these volatile compounds, the ethyl hexanoate is associated with fruity note and, it plays a role in the discrimination of NPK sample from the others (Figure 8). Tomato control showed relatively higher levels of Acetaldehyde, Propanal, Hexanal and Ethyl hexanoate than the others. Of the more than 400 volatile compounds found in ripe tomatoes, only 29 were present at concentrations greater than 1 ng L-1 or a one part per billion. (ppb) [37]. Of these, approximately 16 had positive log odour unit values indicating a significant contribution to the tomato's aroma, including cis-3-hexenal, hexanal, 3-methylbutanal, trans-2-hexenal, trans-2-heptenal, 2- phenylacetaldehyde, β-ionone, 1-penten-3-one, β- damascenone, 6-methyl-5-hepten-2-one, cis-3-hexenol, 2- phenylethanol, 3-methylbutanol, 1-nitro-2-phenylethane, 2- isobutylthiazole, and methyl salicylate. Those volatiles that were slightly below the threshold contribute to the aromatic background [38]. The fingerprint, commonly used to distinguish food samples [39] showed evident differences between the three differently treated tomato compared to the control. The UFGC profiles, were analyzed by using PCA. In order to reduce the data set measurements consisting of all the peak areas of each analyzed chromatograms the most discriminant peak areas of specific compounds were extrapolated and then treated as an input dataset for PCA analysis [40]. In Figure 9 the radar chart evidenced the clear differences between the four samples analyzed. The differences between the chromatographic finger printings fully reflected the differences in the contents of some important components.
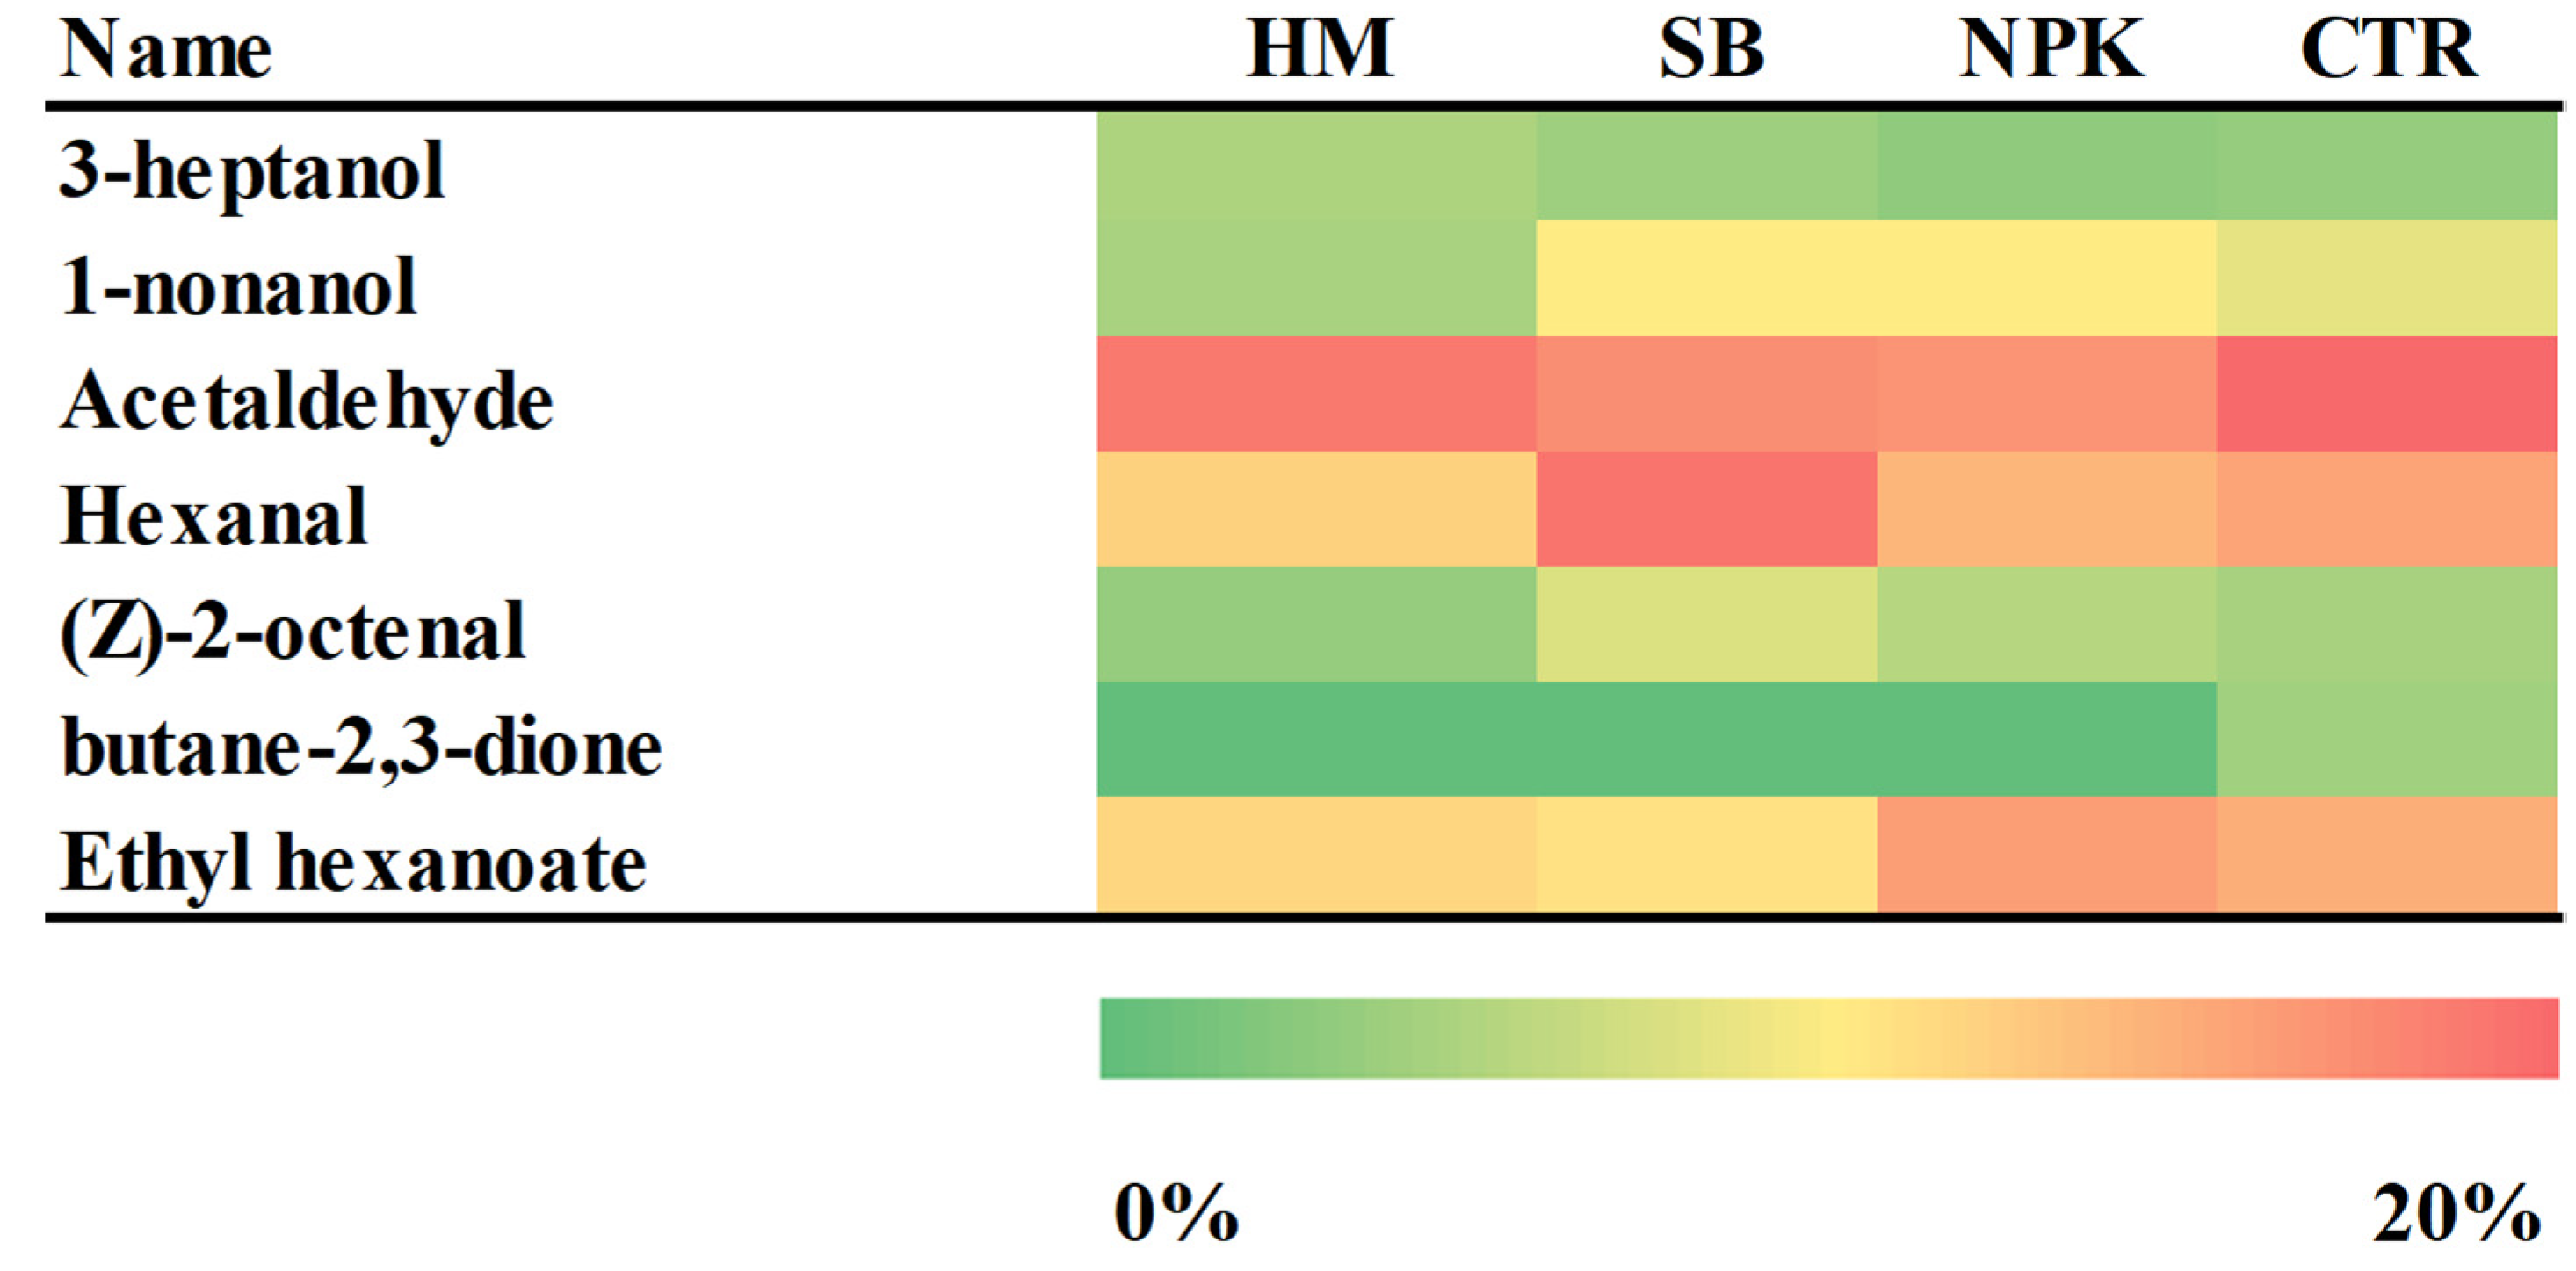
Acetaldehyde, (Z)-2-octenal, hexanal, 1-nonanol and butane-2,3-dione were responsible for the fresh and fruity flavor. This compounds also promotes the freshness feeling of the fruit and participates in the formation of the sweet character [41]. Fruity, green and unripe flavor is related to the ethyl hexanoate and 3-heptanol. The heat map (Figure 10) showed the differences in the aroma profile of the samples differently treated. C6 volatile compounds, including hexanal, trans-2-hexene, cis-3-hexene and corresponding alcohols, were among the most abundant volatile compounds in tomatoes, giving "green" and "grassy" notes to fruit [42]. The highest value of hexanal was found in tomato fruits treated with SB. The PCA analysis (Figure 8) showed The first component discriminated only the samples SB and HM, while NPK and CTR were discriminated by the second ones. SB group was absolutely different from the other groups. Odorous compounds: acetaldehyde (3,56-1-A) and an unknow (10,68-2-A) were characteristics of the HM treated tomato and CTR groups, 3-heptanol (49,70-1-A), ethyl hexanoate (61,40-1-A), (Z)-2-octanal (66,63-1-A), butane-2, 3-dione (38,74-2-A), hexanal (56,36-2-A) and 1-nonanol (90,80-2-A) of the SB group while ethyl hexanoate (61,40-1-A) of NPK group.
In short, the comparison of the odor profiles evidenced that SB treated tomato contained the highest percentage of C6 aldehydes (hexanal) known as ‘green’ compound, that imparts a fresh, green character to tomato aroma,and induces defence gene that increase tolerance against fungi already at a considerably low concentration (Wakai et al. [43]).
Table 1.
Water content (WC), Dry weight, Fresh weight, Total proteins (TPRO, µg g-1 dw), total carbohydrates (TCARB, mg glucose g-1 dw) total phenols (TPHE, mg tannic acid g-1 dw), total flavonoids (TFLA, mg quercetin 100g-1 dw), total carotenoids (CAR, mg 100g-1 dw), licopene (LIC, mg 100g-1 dw), Total antioxidant capacity (TAC, mg alpha-tocopherol g-1 dw 2,2′-diphenyl-1-picrylhydrazyl radical activity assay (DPPH•, % inhibition) vitamin A (VIT A, mg retinol 100 g-1 dw), vitamin C (VIT C, mg ascorbate 100g-1 dw) vitamin E (VIT E, mg alpha-tocopherol g-1 dw) in lettuce leaves cultivated on Motta soils without fertilizer (control, CTR), with nitrogen:phosporous:potassium (NPK), horse manure (HM) sulphur-bentonite with orange residue (SB), Data are the means ±standard errors of three replicates of three independent experiments (n=36). *Different letters indicate significant differences per p ≤ 0.01.
| CTR | NPK | HM | SB | |
|---|---|---|---|---|
| WC | 90.7a | 89.2a | 90.7a | 89.7a |
| Dry weight | 9.3a | 10.8a | 9.3 | 10.3 |
| Fresh weight | 86 b | 95 a | 93 a | 92 a |
| TPRO | 1.2 b | 1.3 ab | 1.5 a | 1.7 a |
| TCAR | 17 c | 16 c | 21 b | 24 a |
| LIC | 14 d | 19 c | 23 b | 26 a |
| TCARB | 2.2 b | 2.4 ab | 2.6 a | 2.8 a |
| TPHE | 181.8 b | 190.2 b | 125.4 c | 204.7 a |
| TFLA | 361.8 d | 389.9 c | 511.3 b | 533.3 a |
| VITA | 132.5 b | 137.3 ab | 122.9 c | 180.4 a |
| VITC | 33 c | 35 b | 38 b | 44 a |
| VITE | 0.125 a | 0.116 a | 0.125 a | 0.124 a |
| TAC | 1.83 b | 1.91 b | 2.01 b | 2.25 a |
| ABTS | 0.018 | 0.029 | 0.032 | 0.035 |
| DPPH % | 43.9 a | 36.6 b | 45.5 a | 37.2 b |
| DPPH | 7.7 b | 5.4 c | 8.18 a | 5.5 c |
Table 2.
Pearson correlation (r) between total proteins (TPRO, mg g-1 DW); total carotenoids (TCAR, μg 100 g-1 DW); lycopene (LIC, mg 100 g-1 DW); total carbohydrates (TCARB, mg glucose g-1 DW); total phenols (TPHE, µg GAE * g-1 DW); total flavonoids (TFLA, μg quercetin g-1 DW); vitamin A (VIT A, μg retinol 100 g-1 DW); vitamin C (VIT C, mg ascorbic acid g-1 DW.); vitamin E (VIT E, mg alpha-tocopherol 100 g-1 DW.);total anti-oxidant capacity (TAC, mg α- tocopherol *100 g-1 d.w.); 2,2-diphenyl-1-picrylhydrazyl (DPPH, % inhibition); 1,1-diphenyl-2-picrylhydrazyl (DPPH radical, μM Trolox g-1 d.w.); 2,2′-azino-bis-3-ethylbenzthiazoline-6-sulphonic acid, (ABTS) Values in bold are different from 0 with a significance level alpha=0,05.
| Variables | TPRO | TCAR | LIC | TCARB | TPHE | TFLA | VITA | VITC | VITE | TAC | ABTS | DPPH % | DPPH |
| TPRO | 1 | 0.956 | 0.969 | 0.990 | 0.044 | 0.961 | 0.700 | 0.987 | 0.293 | 1 | 0.882 | -0.273 | -0.273 |
| TCAR | 0.956 | 1 | 0.868 | 0.908 | -0.028 | 0.943 | 0.653 | 0.940 | 0.559 | 0.959 | 0.717 | -0.049 | -0.048 |
| LIC | 0.969 | 0.868 | 1 | 0.994 | -0.051 | 0.953 | 0.585 | 0.936 | 0.118 | 0.969 | 0.969 | -0.315 | -0.315 |
| TCARB | 0.990 | 0.908 | 0.994 | 1 | 0.014 | 0.957 | 0.656 | 0.969 | 0.178 | 0.989 | 0.940 | -0.323 | -0.324 |
| TPHE | 0.044 | -0.028 | -0.051 | 0.014 | 1 | -0.232 | 0.735 | 0.199 | -0.355 | 0.020 | -0.057 | -0.803 | -0.801 |
| TFLA | 0.961 | 0.943 | 0.953 | 0.957 | -0.232 | 1 | 0.481 | 0.907 | 0.400 | 0.968 | 0.865 | -0.034 | -0.035 |
| VITA | 0.700 | 0.653 | 0.585 | 0.656 | 0.735 | 0.481 | 1 | 0.804 | 0.050 | 0.684 | 0.494 | -0.684 | -0.683 |
| VITC | 0.987 | 0.940 | 0.936 | 0.969 | 0.199 | 0.907 | 0.804 | 1 | 0.255 | 0.984 | 0.843 | -0.379 | -0.378 |
| VITE | 0.293 | 0.559 | 0.118 | 0.178 | -0.355 | 0.400 | 0.050 | 0.255 | 1 | 0.309 | -0.113 | 0.694 | 0.695 |
| TAC | 1 | 0.959 | 0.969 | 0.989 | 0.020 | 0.968 | 0.684 | 0.984 | 0.309 | 1 | 0.880 | -0.250 | -0.249 |
| ABTS | 0.882 | 0.717 | 0.969 | 0.940 | -0.057 | 0.865 | 0.494 | 0.843 | -0.113 | 0.880 | 1 | -0.417 | -0.418 |
| DPPH % | -0.273 | -0.049 | -0.315 | -0.323 | -0.803 | -0.034 | -0.684 | -0.379 | 0.694 | -0.250 | -0.417 | 1 | 1 |
| DPPH | -0.273 | -0.048 | -0.315 | -0.324 | -0.801 | -0.035 | -0.683 | -0.378 | 0.695 | -0.249 | -0,418 | 1 | 1 |
Table 3.
Single phenolic acids contained in tomato differently cultivated: without fertilizers (Control, CTR) and with nitrogen:phosporous:potassium (NPK), horse manure (HM) sulphur-bentonite with orange residue (SB), Data are the means of three replicates of three independent experiments (n=36). The experimental data are the mean of six replicates. Different letters in the same row indicate significant differences p≤0.05.
| CTR | NPK | HM | SB | |
| CTR | NPK | HM | SB | |
| Phenolic acids | mg/g SS | mg/g SS | mg/g SS | mg/g SS |
| Gallic | 0.6a | 0.3b | 0.3b | |
| Protocatechuic | 0.01a | 0.02a | 0.02a | |
| Syringic | 0.01a | 0.02a | 0.02a | |
| p-coumaric | 0.01 | |||
| m-coumaric | 4a | 0.6b | nd | nd |
| o-coumaric | 0.06a | 0.04a | 0.01a | 0.05a |
| Trans-cinnamic | 2.83a | |||
| 3-hydroxycinnamic | ||||
| Trans-4-hydroxycinnamic acid | 0.46c | 0.3d | 1.00b | 1.58a |
| Synaptic acid | 0.02a | 0.04a | 0.04a | |
| 2,5 dihydroxy-benzoic acid | 0.03a | 0.02a | 0.01a | 0.02a |
| Caffeic acid | 0.01a | 0.02a | 0.01a | 0.01a |
| Chlorogenic acid | 0.56b | 0.9a | 0.1a | 0.02c |
| Ferulic acid | 0.2b | 0.34a |
Table 4.
Single flavonoids contained in tomato differently cultivated: without fertilizers (Control, CTR) and with nitrogen:phosporous:potassium (NPK), horse manure (HM) and sulphur-bentonite with orange residue (SB), Data are the means of three replicates of three independent experiments (n=36). The experimental data are the mean of six replicates. Different letters in the same row indicate significant differences p≤0.05.
| CTR | NPK | HM | SB | |
| mg/g SS | mg/g SS | mg/g SS | mg/g SS | |
| Flavonoids | ||||
| Procyanidin 2 | 0.2a | 0.03b | 0.03b | |
| Pelargonidine | 0.05a | |||
| Cyanidine 3 O-glucoside | 0.15a | 0.05b | 0.03b | 0.02b |
| Catechin | 0.08c | 0.15b | 0.3a | 0.3a |
| Epicatechin | 0.12a | 0.12a | 0.03b | 0.05b |
| Delphinidin | 0.54 a | 0.52 a | 0.1b | 0.1b |
| Myricetin | 1.16a | 1.42a | ||
| Luteolin | 0.04a | 0.03a | 0.02a | 0.03a |
| Punicalagin | 0.07a | 0.07a | ||
| Naringin | 0.02a | |||
| Quercetin | 0.05a | 0.01a | 0.02a | |
| Kaempferol | 0.08c | 2.1a | 0.16b | |
| Tocopherol | 2.1b | 1.81c | 2.99a | |
| Procyanidin 1 | 0.16a | |||
| Vicenin 2 | 0.01b | 0.08b | 0.3a | 0.08b |
| Erythrocin | 0.05a | |||
| Rutin | 0.26c | 3a | 0.56b | 0.02d |
Table 5.
Summary of discriminant chromatographic peak and their sensory descriptors (1-A: MTX5; 2-A: MTX 1701).
Table 5.
Summary of discriminant chromatographic peak and their sensory descriptors (1-A: MTX5; 2-A: MTX 1701).
| Retention times | Name | Sensory descriptors |
| 13.56-1-A | acetaldehyde | Aldehydyc;ethereal; fresh; fruity |
| 49.70-1-A | 3-heptanol | Green;herbaceous |
| 61.40-1-A | ethyl hexanoate | Anise;apple;banana;berry;fruity;fruity(sweet);green;pineapple;strawberry;sweaty;sweet;unripe;waxy; |
| 66.63-1-A | (Z)-2-octenal | Earthy;fatty;fruity;green;leafy;walnut |
| 10.68-2-A | unknown | |
| 38.74-2-A | butane-2,3-dione | Butter;caramelized;chlorine;creamy;fruity;pineapple;pungent;spirit;strong;sweet |
| 56.36-2-A | hexanal | Aldehydyc;ethereal; fresh; fruity: green; erbaceus |
| 90.80-2-A | 1-nonanol | Dusty;fatty;floral;fresh;fruity;green;oily;orange;rose;wet |
Figure 1.
Pearson correlation (r) between single phenolic acids and total anti-oxidant capacity (TAC, mg α- tocopherol *100 g-1 d.w.); 2,2-diphenyl-1-picrylhydrazyl (DPPH, % inhibition); 1,1-diphenyl-2-picrylhydrazyl (DPPH radical, μM Trolox g-1 d.w.); 2,2′-azino-bis-3-ethylbenzthiazoline-6-sulphonic acid (ABTS. % inhibition).
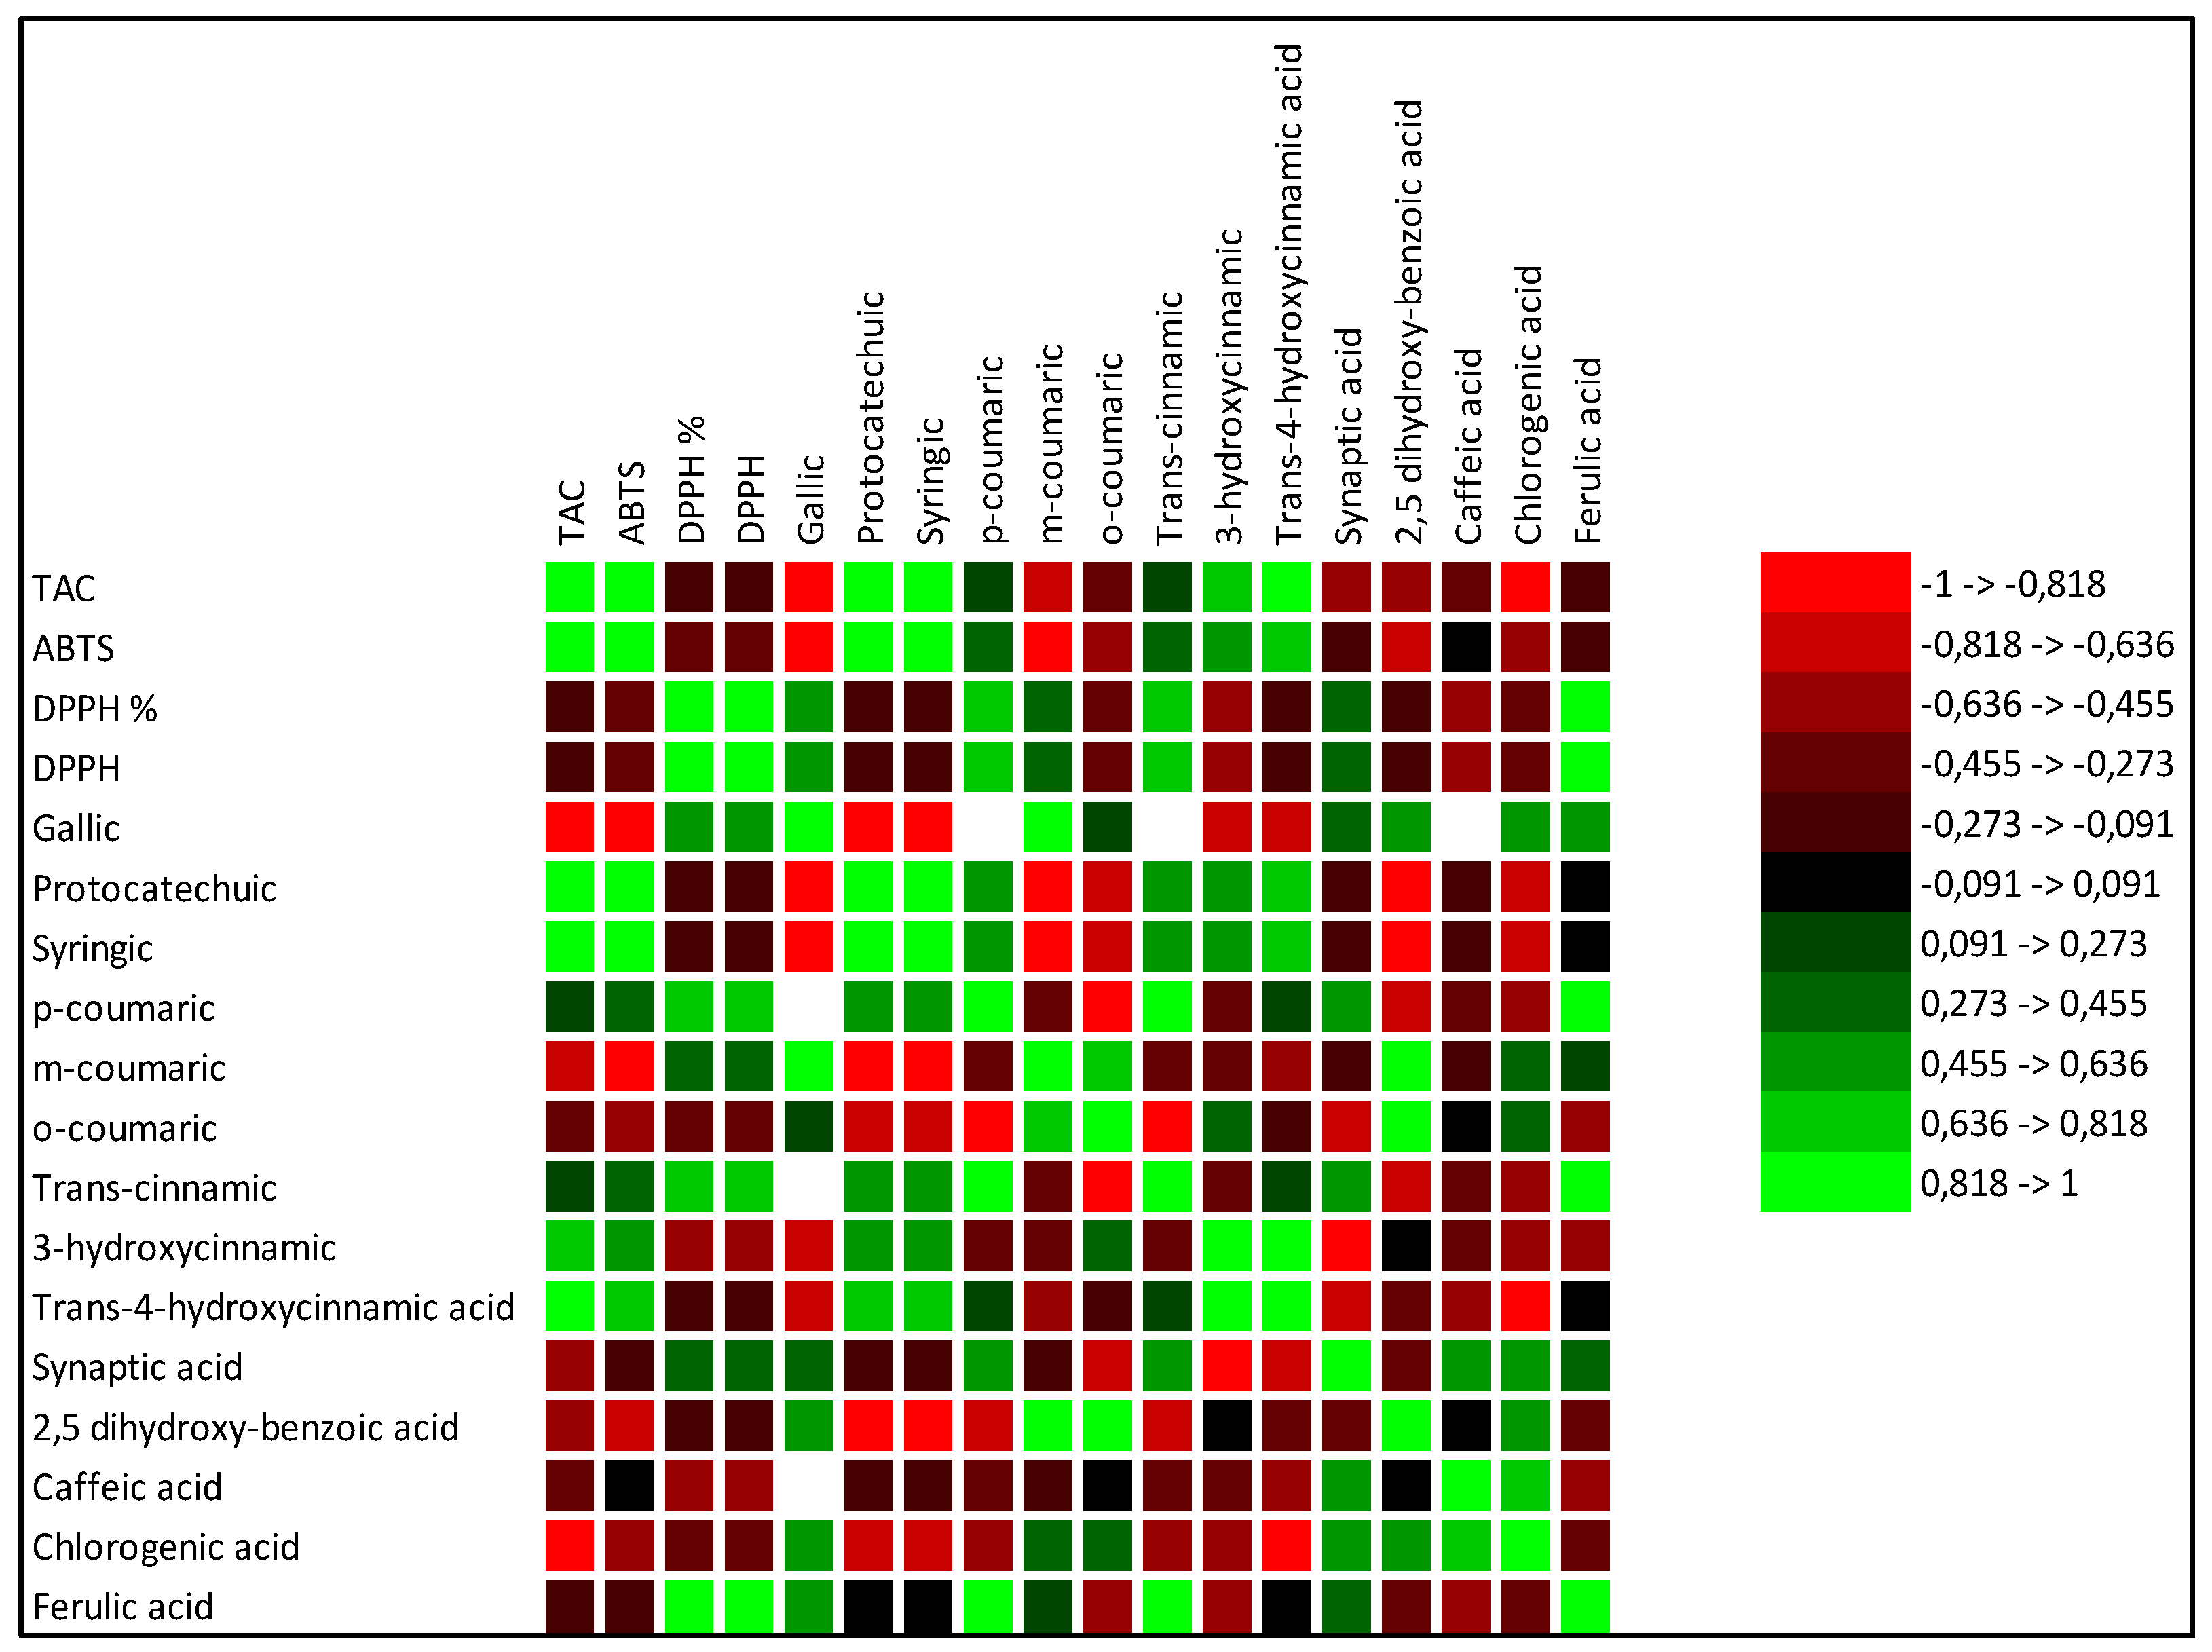
Figure 2.
Pearson correlation (r) between single flavonoids, total anti-oxidant capacity (TAC, mg α- tocopherol *100 g-1 d.w.); 2,2-diphenyl-1-picrylhydrazyl (DPPH, % inhibition); 1,1-diphenyl-2-picrylhydrazyl (DPPH radical, μM Trolox g-1 d.w.); 2,2′-azino-bis-3-ethylbenzthiazoline-6-sulphonic acid, (ABTS, % inhibition).
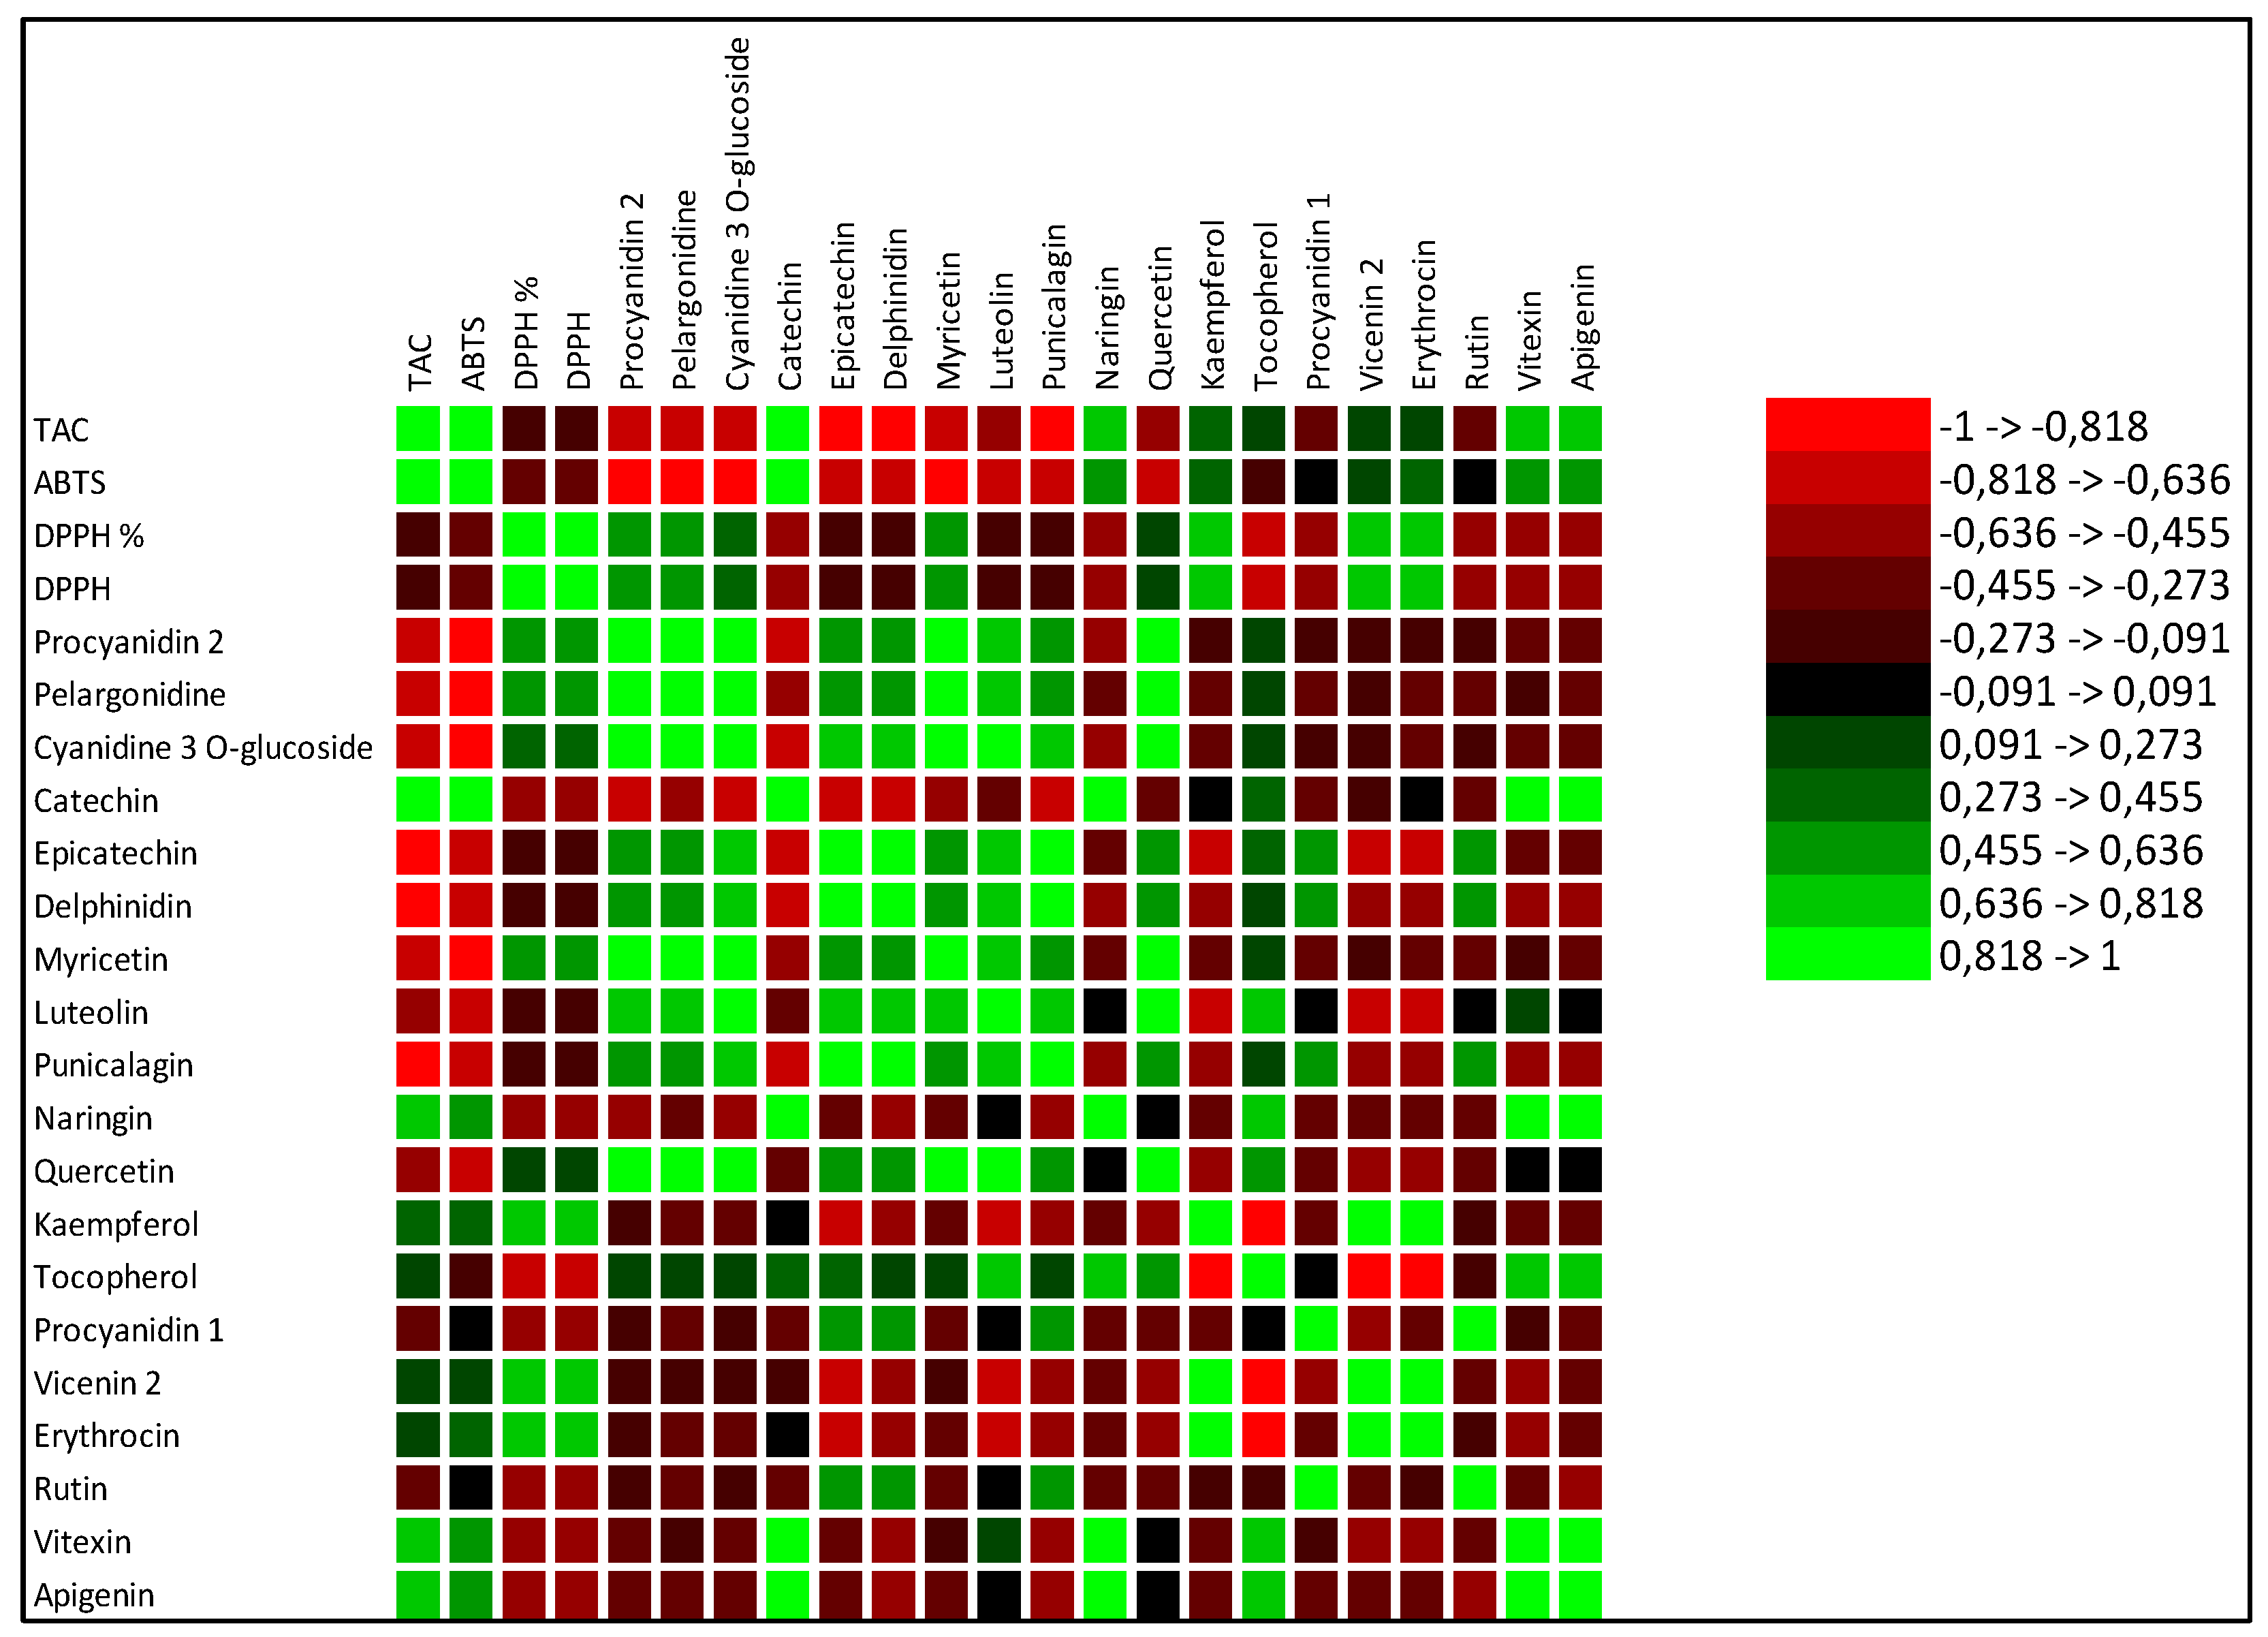
Figure 3.
PCA (principal component analysis) diagram of primary and secondary metabolites in tomato cultivated in soils without fertilizer (CTR)and with different fertilizers nitrogen:phosporous:potassium (NPK), horse manure (HM) and sulphur-bentonite with orange residue (SB).
Figure 3.
PCA (principal component analysis) diagram of primary and secondary metabolites in tomato cultivated in soils without fertilizer (CTR)and with different fertilizers nitrogen:phosporous:potassium (NPK), horse manure (HM) and sulphur-bentonite with orange residue (SB).
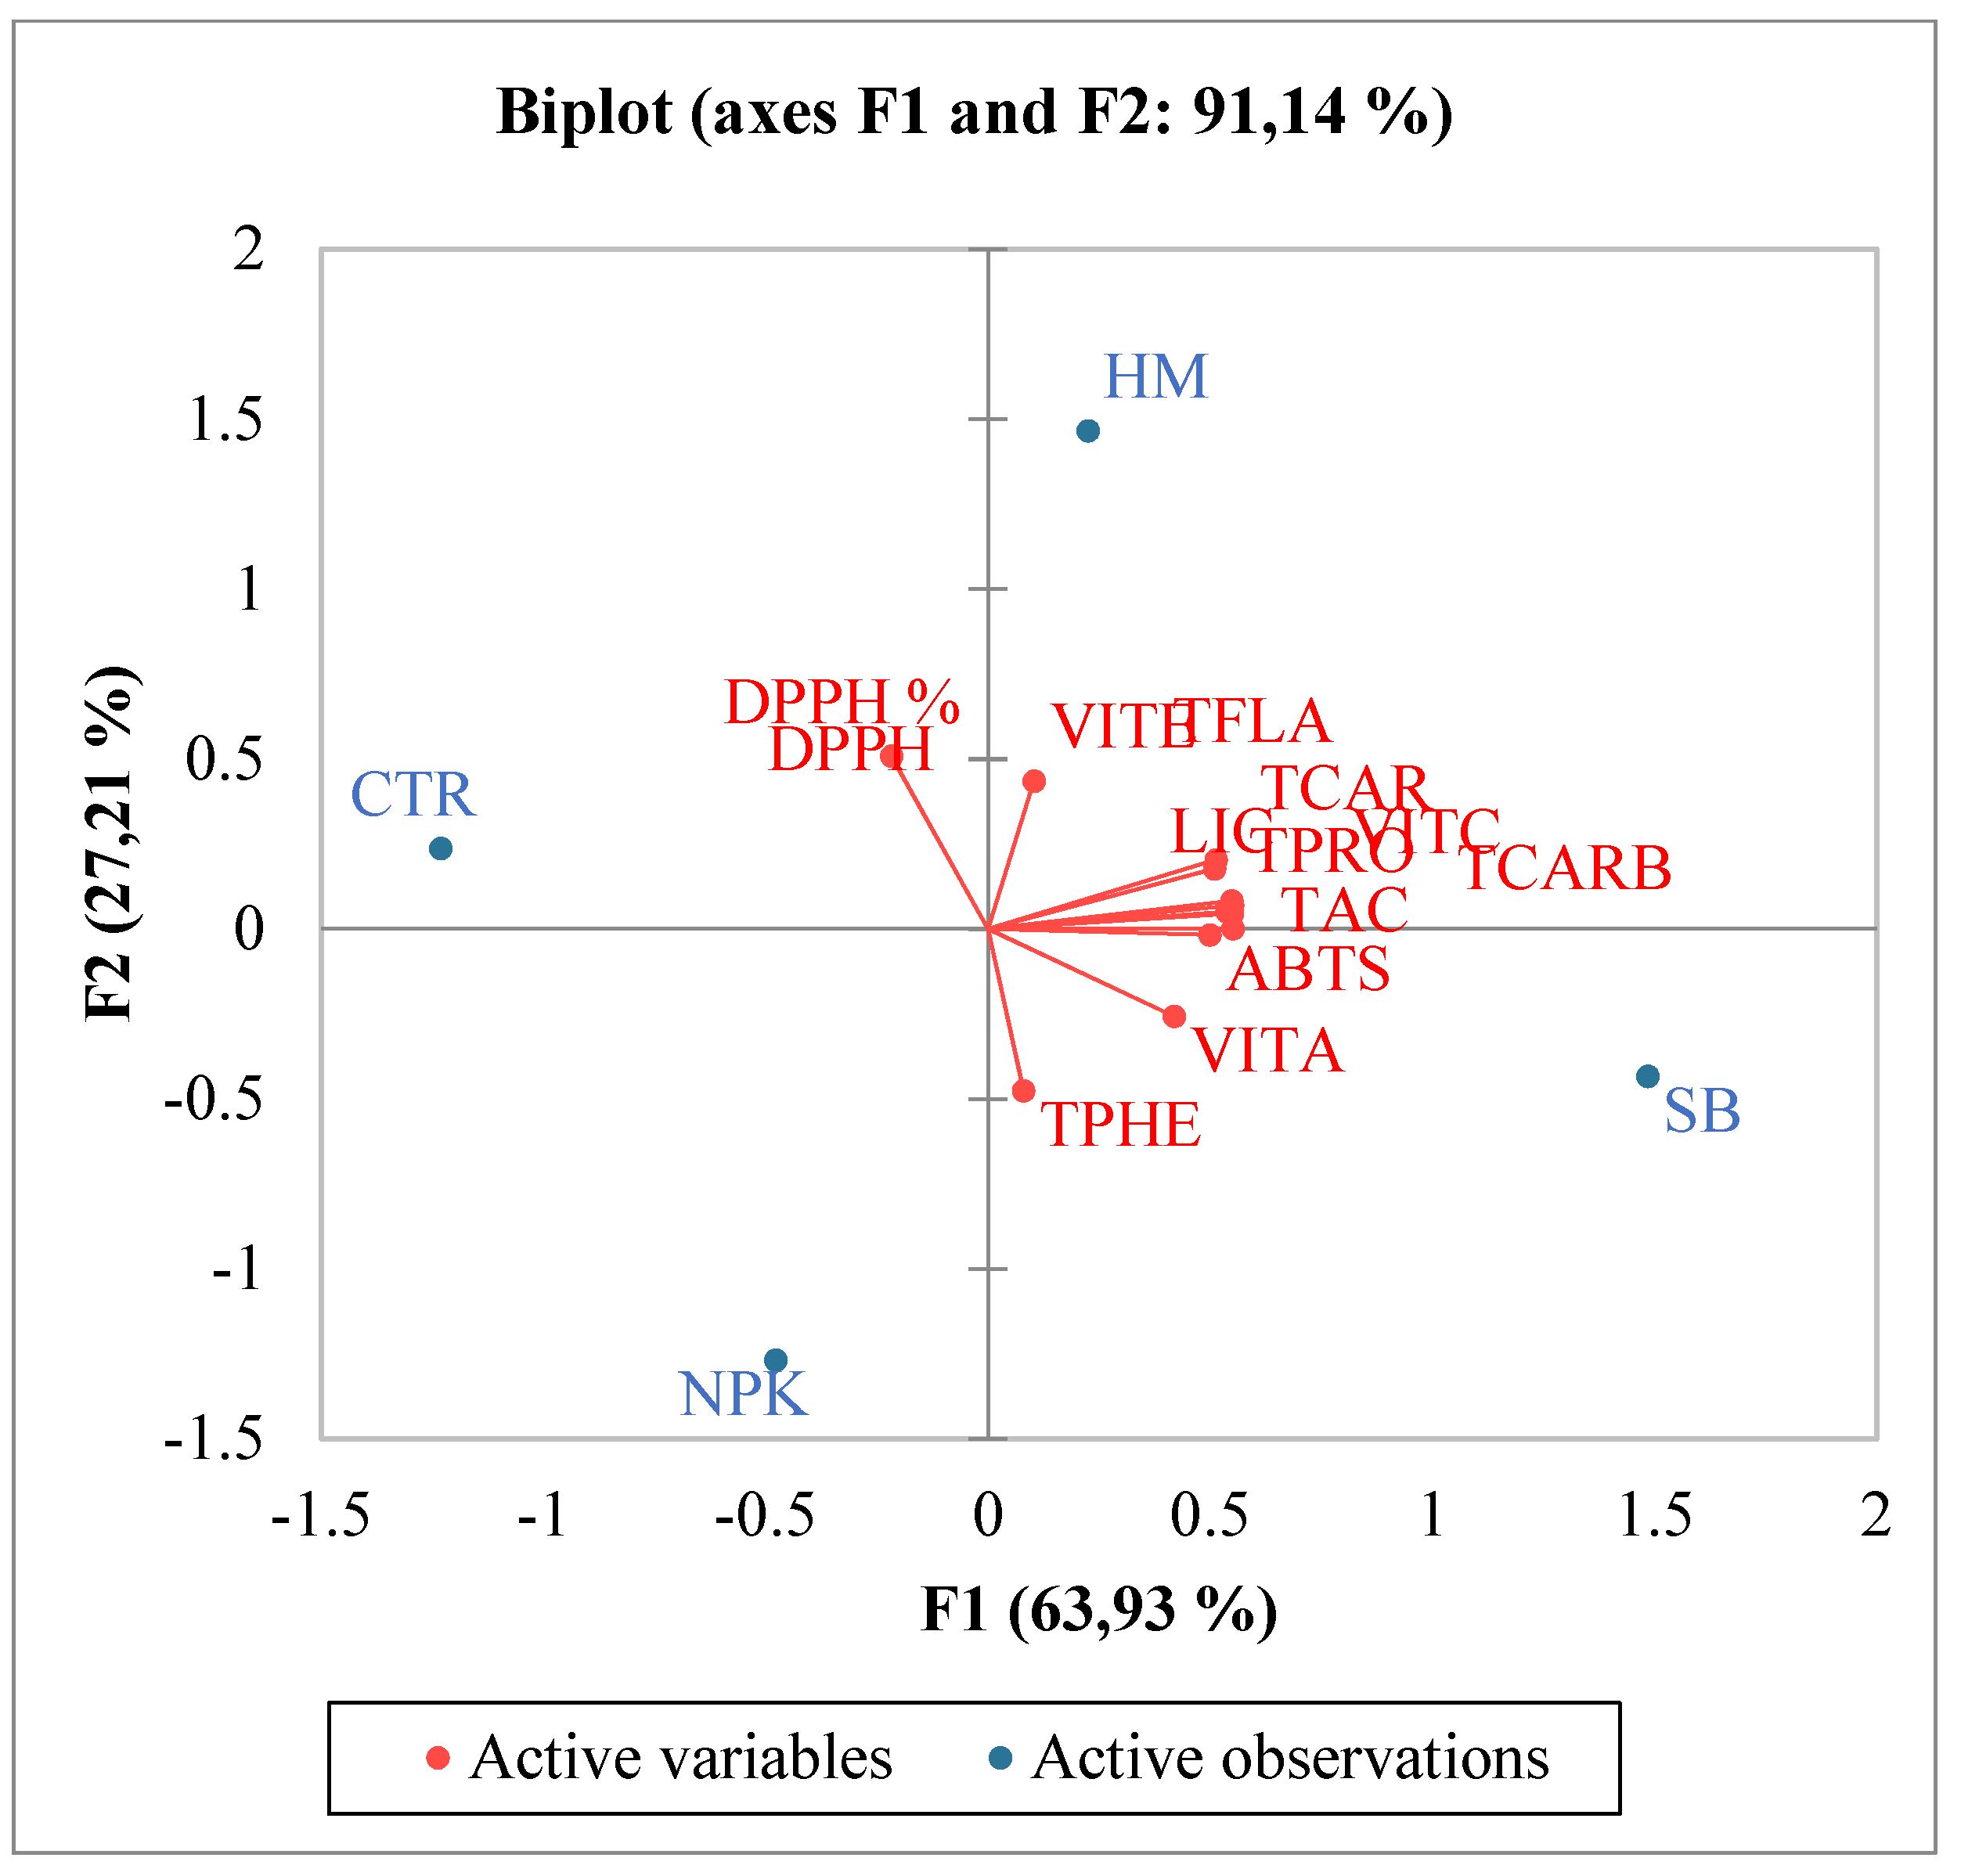
Figure 4.
PCA (principal component analysis) diagram of single phenolic acids in tomato cultivated in soils without fertilizer (CTR) and with different fertilizers nitrogen:phosporous:potassium (NPK), horse manure (HM) and sulphur-bentonite with orange residue fertilizers sulphur-bentonite with orange residue (SB).
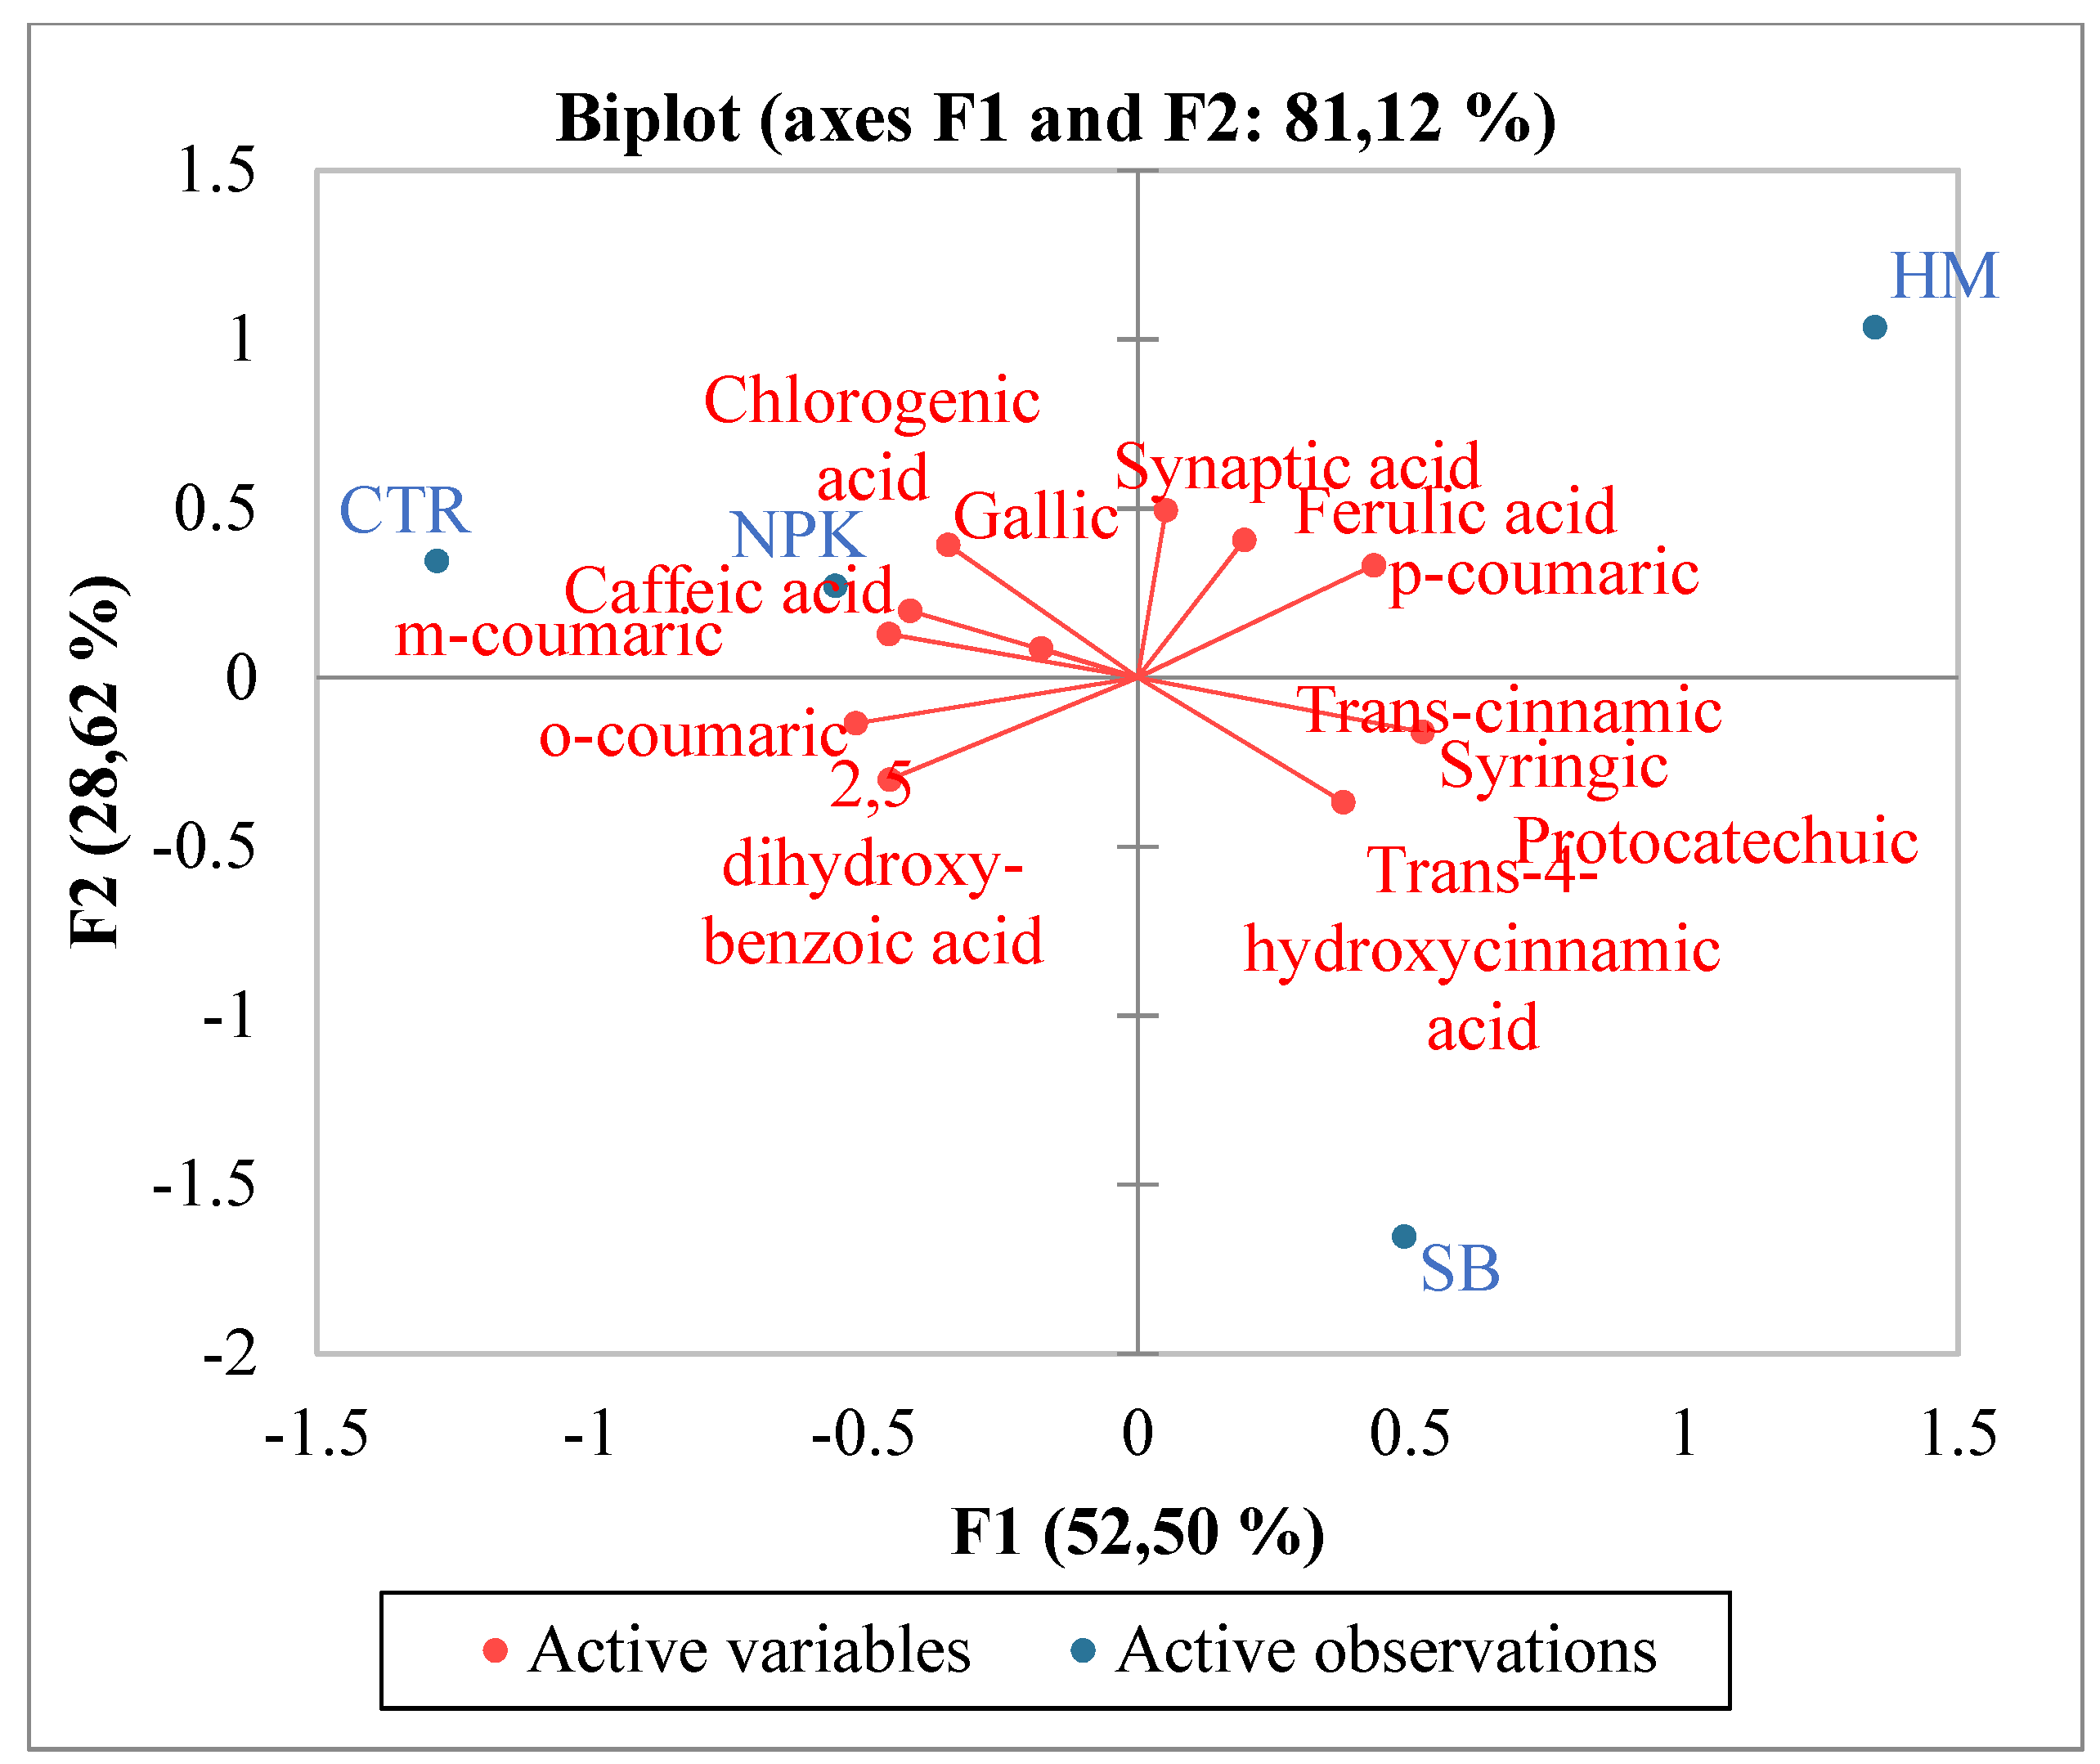
Figure 5.
PCA (principal component analysis) diagram of single flavonoids in tomato cultivated in soils without fertilizer (CTR) and with different fertilizers nitrogen:phosporous:potassium (NPK), horse manure (HM) and sulphur-bentonite with orange residue fertilizers (SB).
Figure 5.
PCA (principal component analysis) diagram of single flavonoids in tomato cultivated in soils without fertilizer (CTR) and with different fertilizers nitrogen:phosporous:potassium (NPK), horse manure (HM) and sulphur-bentonite with orange residue fertilizers (SB).
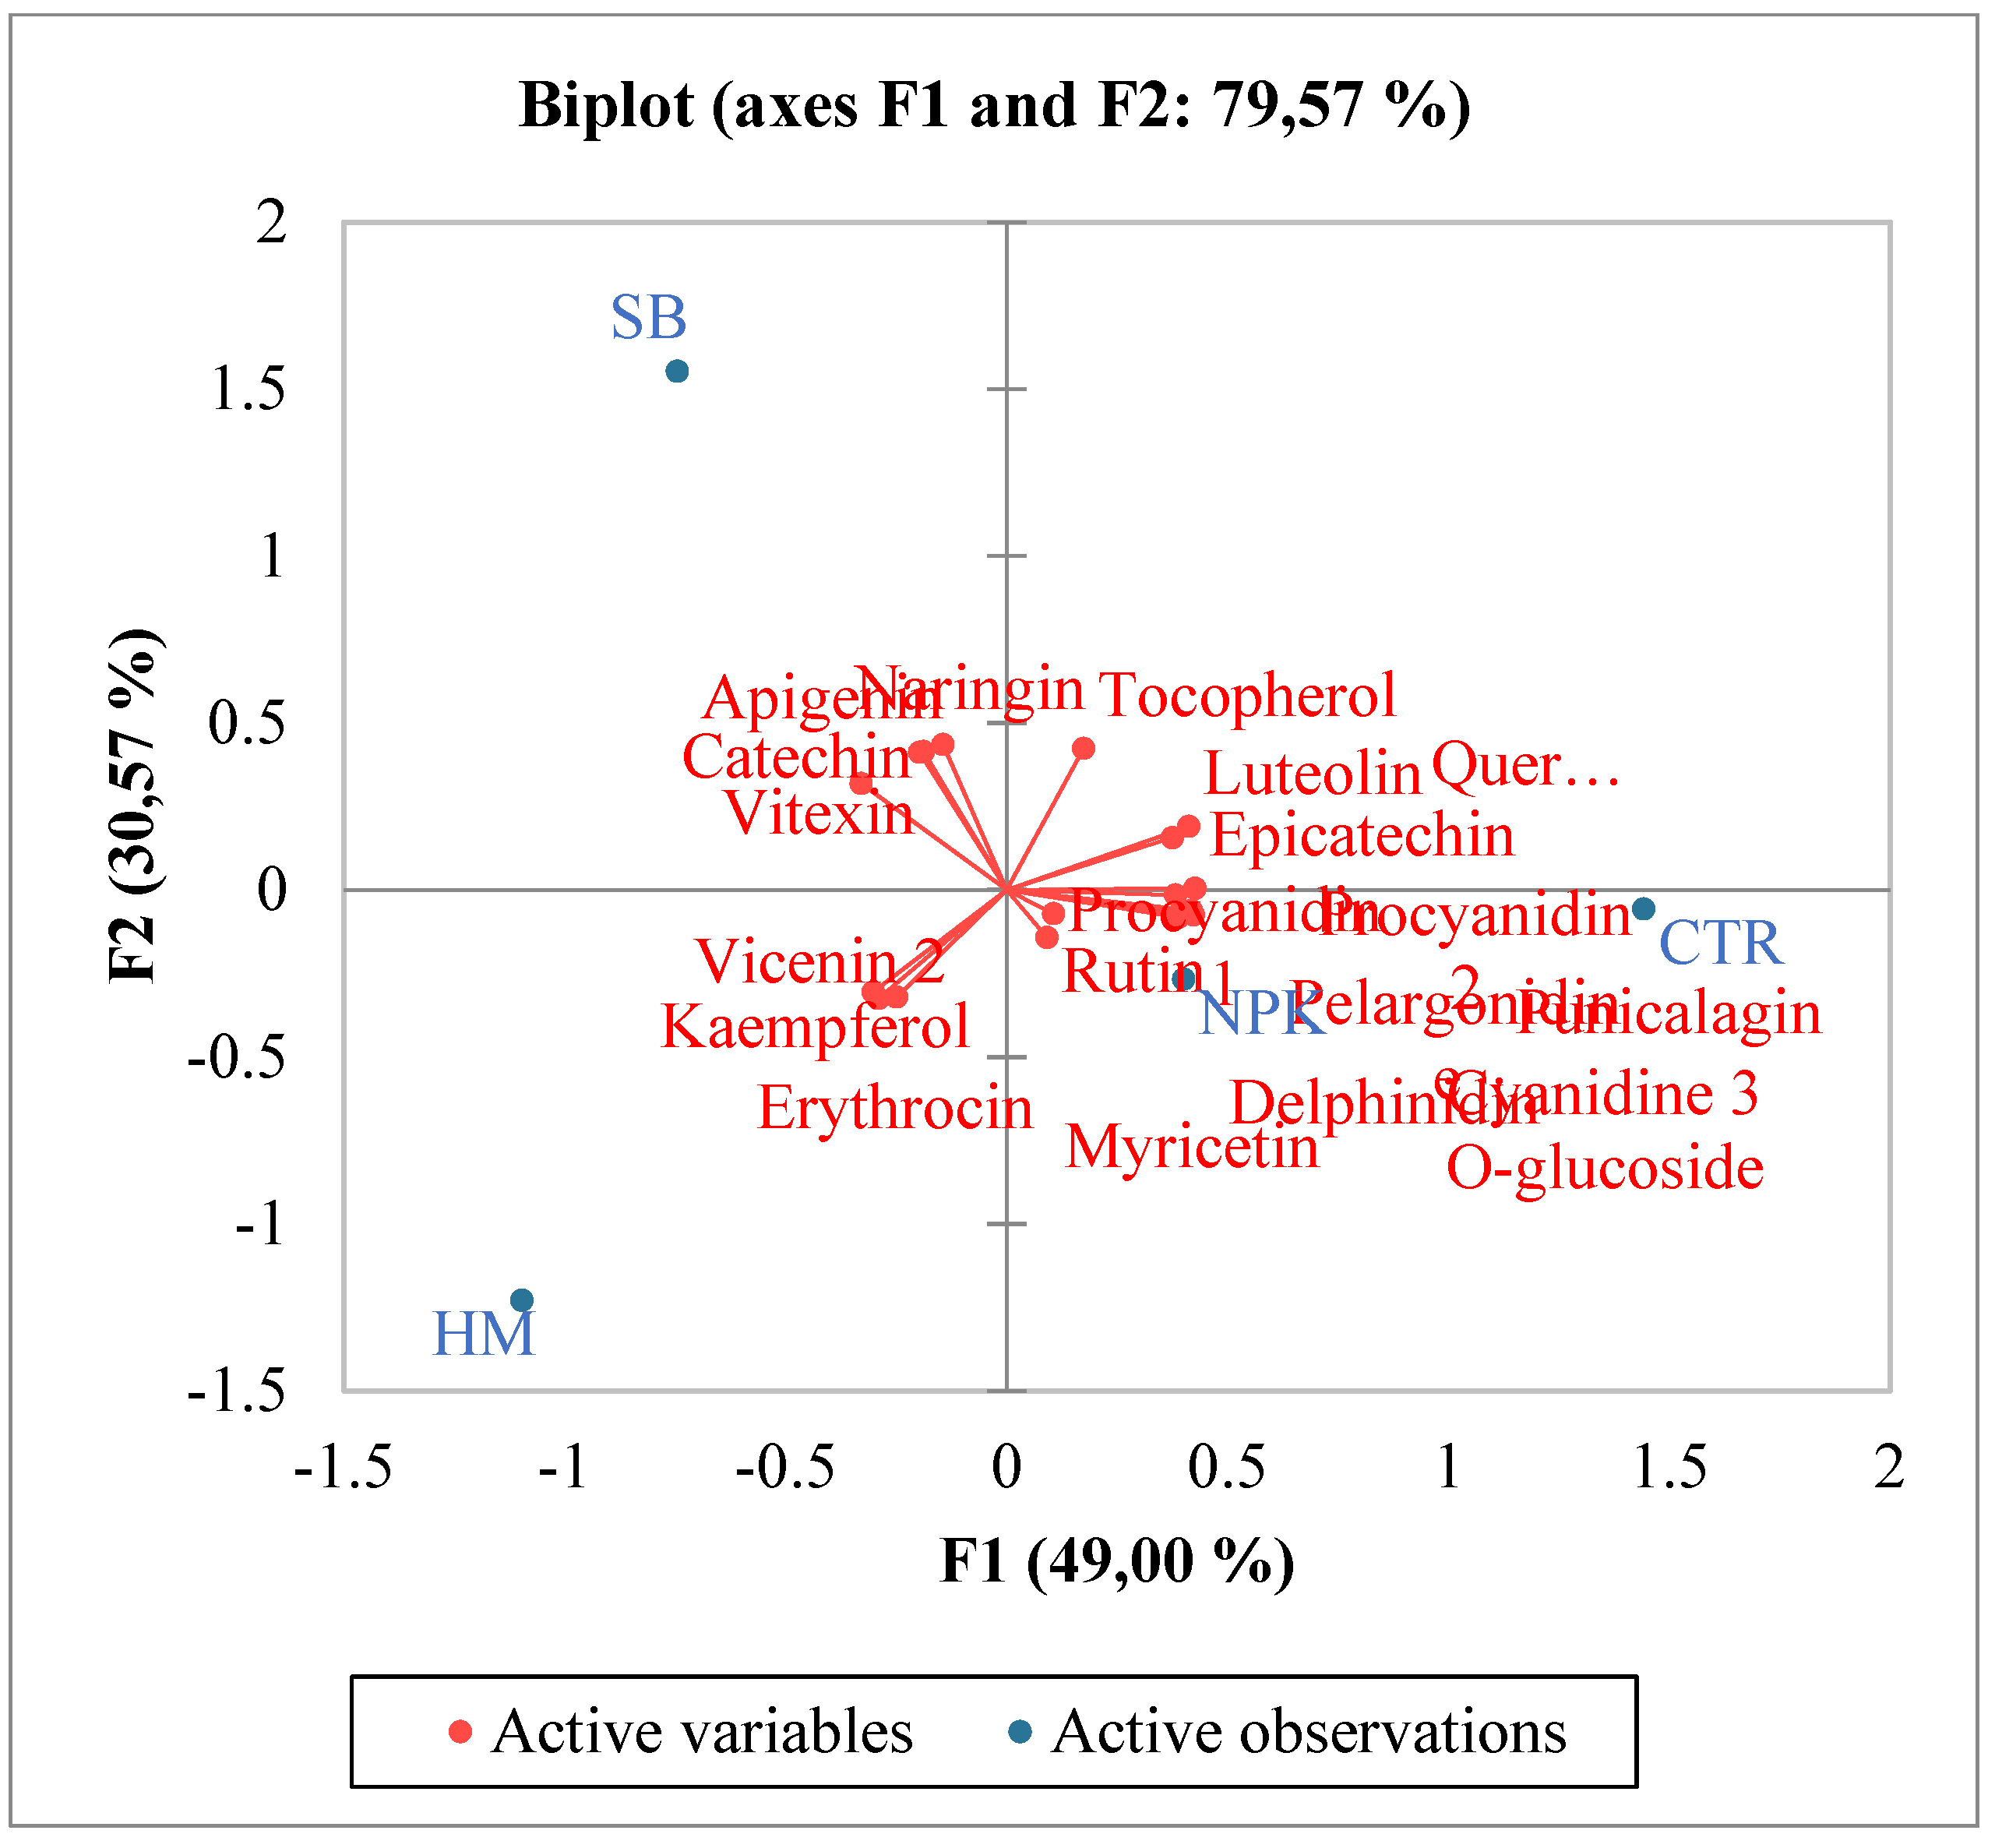
Figure 6.
Odor maps or fingerprints obtained by UFGC of tomato samples fruits grown in unfertilized soil control (CONT) and soils fertilized with nitrogen: phosphorous: potassium (NPK), sulphur-bentonite with orange residue (SB) and horse manure (HM).
Figure 6.
Odor maps or fingerprints obtained by UFGC of tomato samples fruits grown in unfertilized soil control (CONT) and soils fertilized with nitrogen: phosphorous: potassium (NPK), sulphur-bentonite with orange residue (SB) and horse manure (HM).
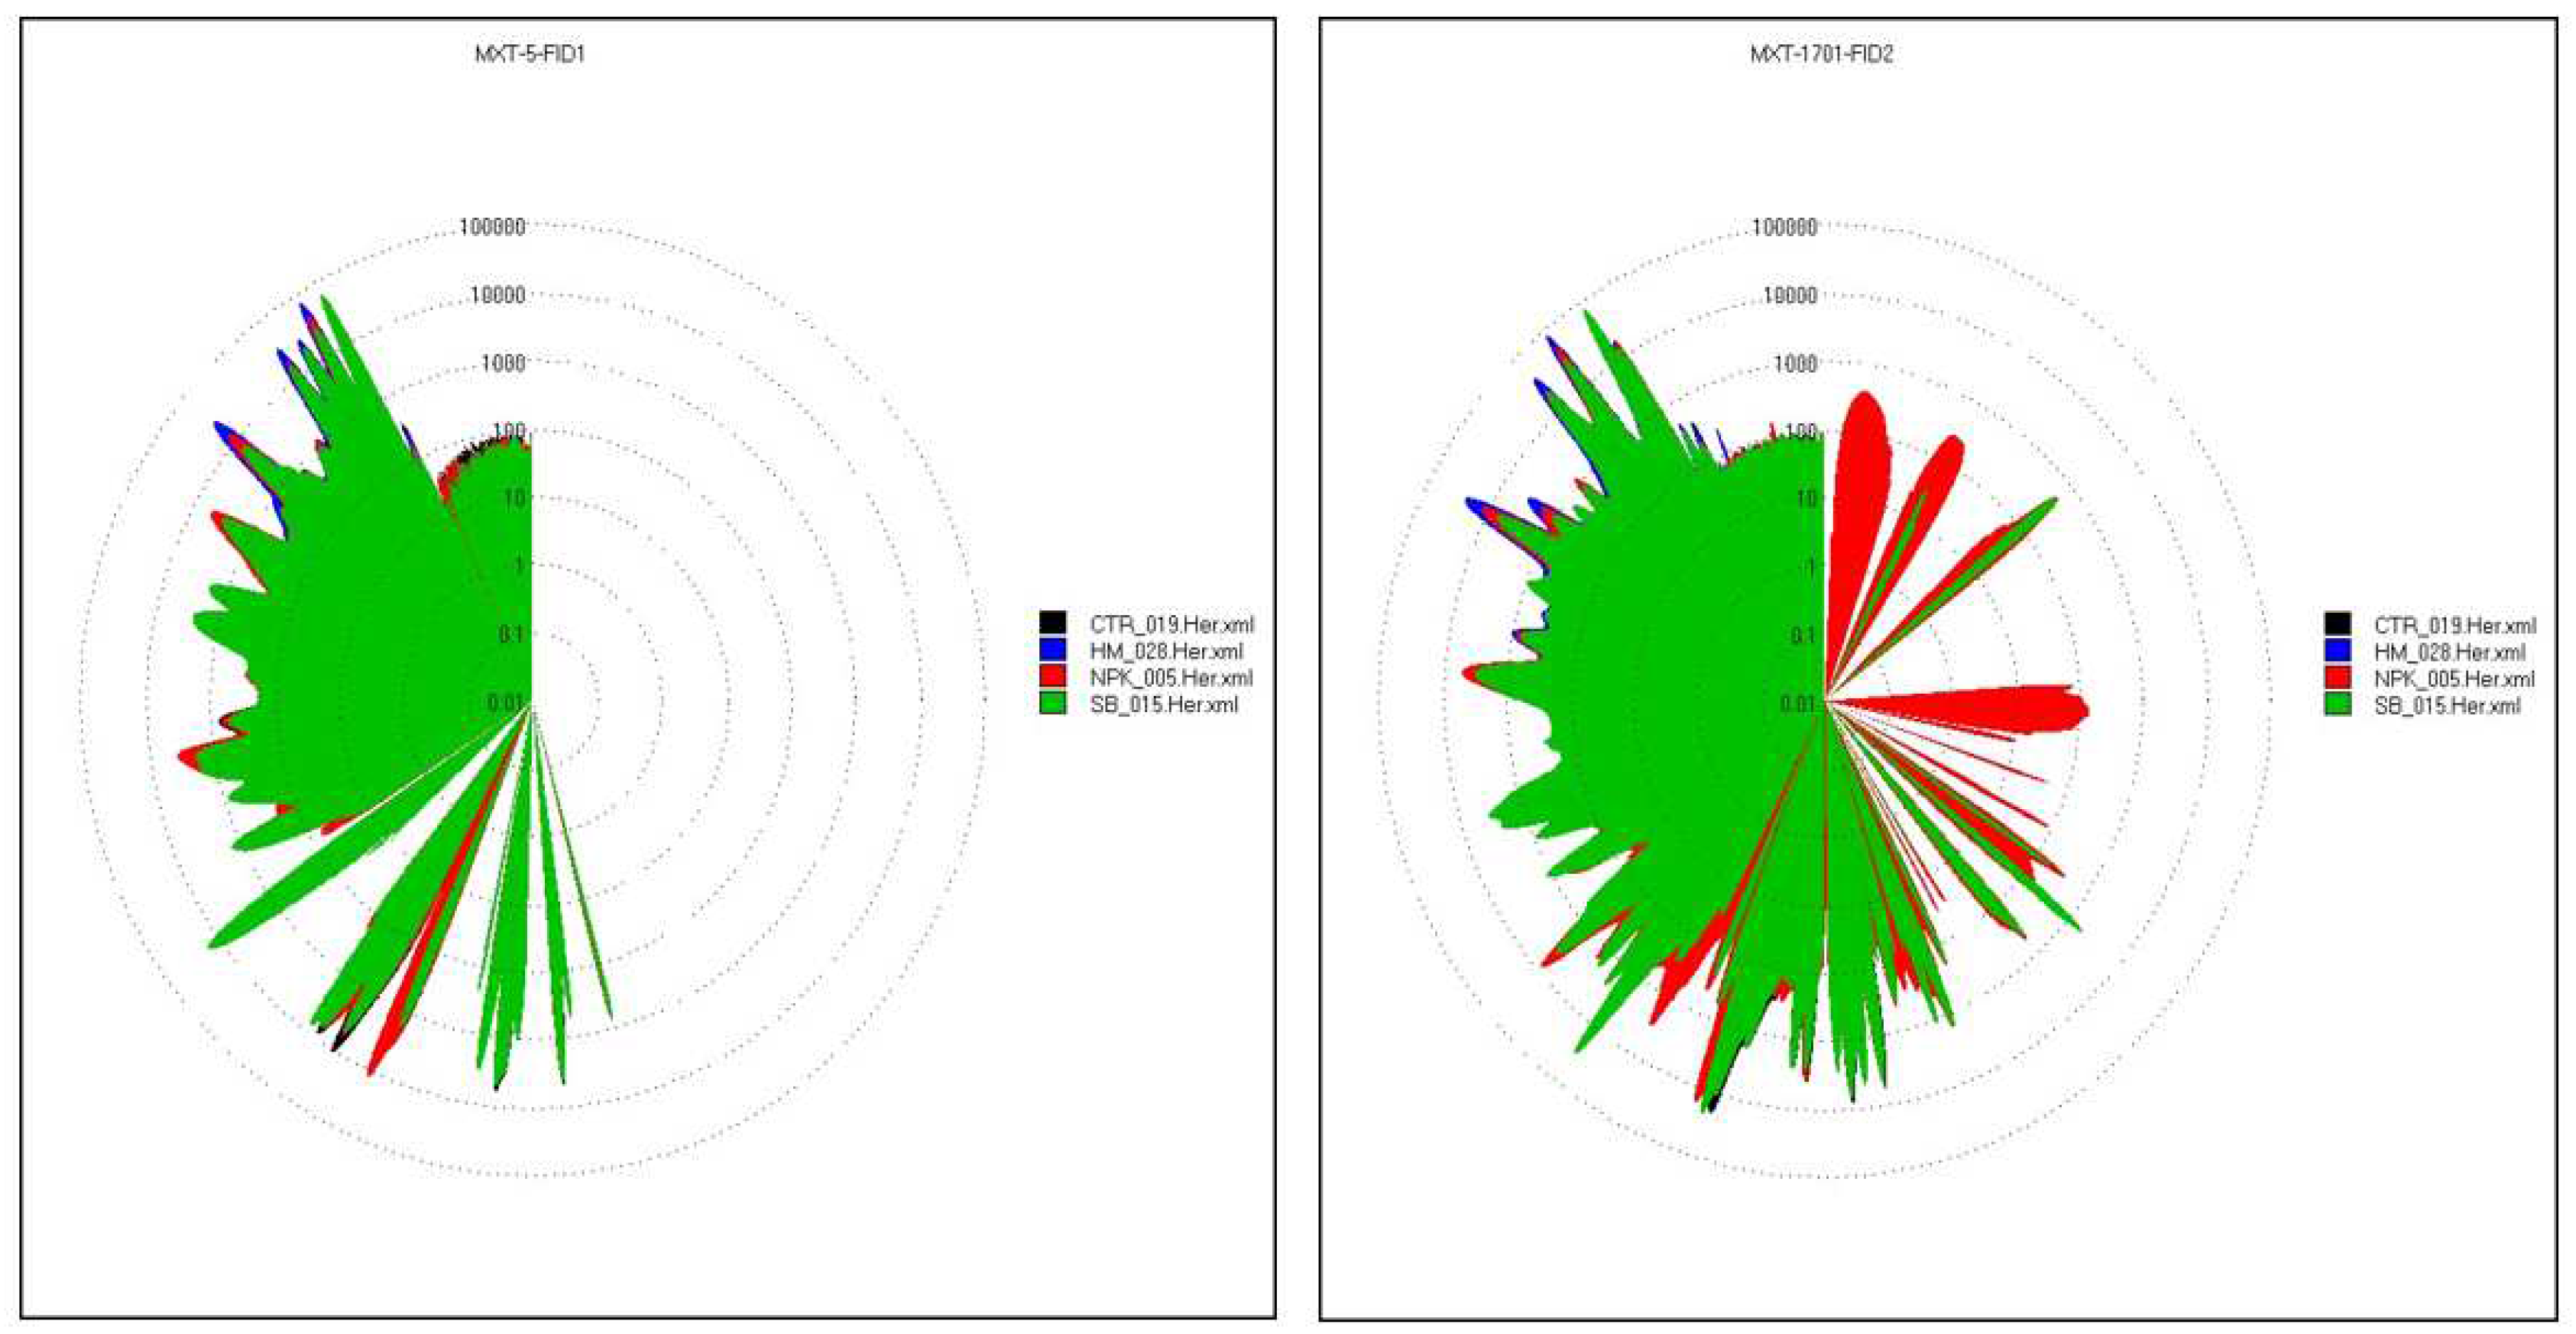
Figure 7.
A heat map of tomato samples fruits grown in unfertilized soil control (CTR) and soils fertilized with nitrogen: phosphorous: potassium (NPK), sulphur-bentonite with orange residue (SB) and horse manure (HM) showing area of compounds by UFGC (green color means low peak area and red color is high in peak area, relatively).
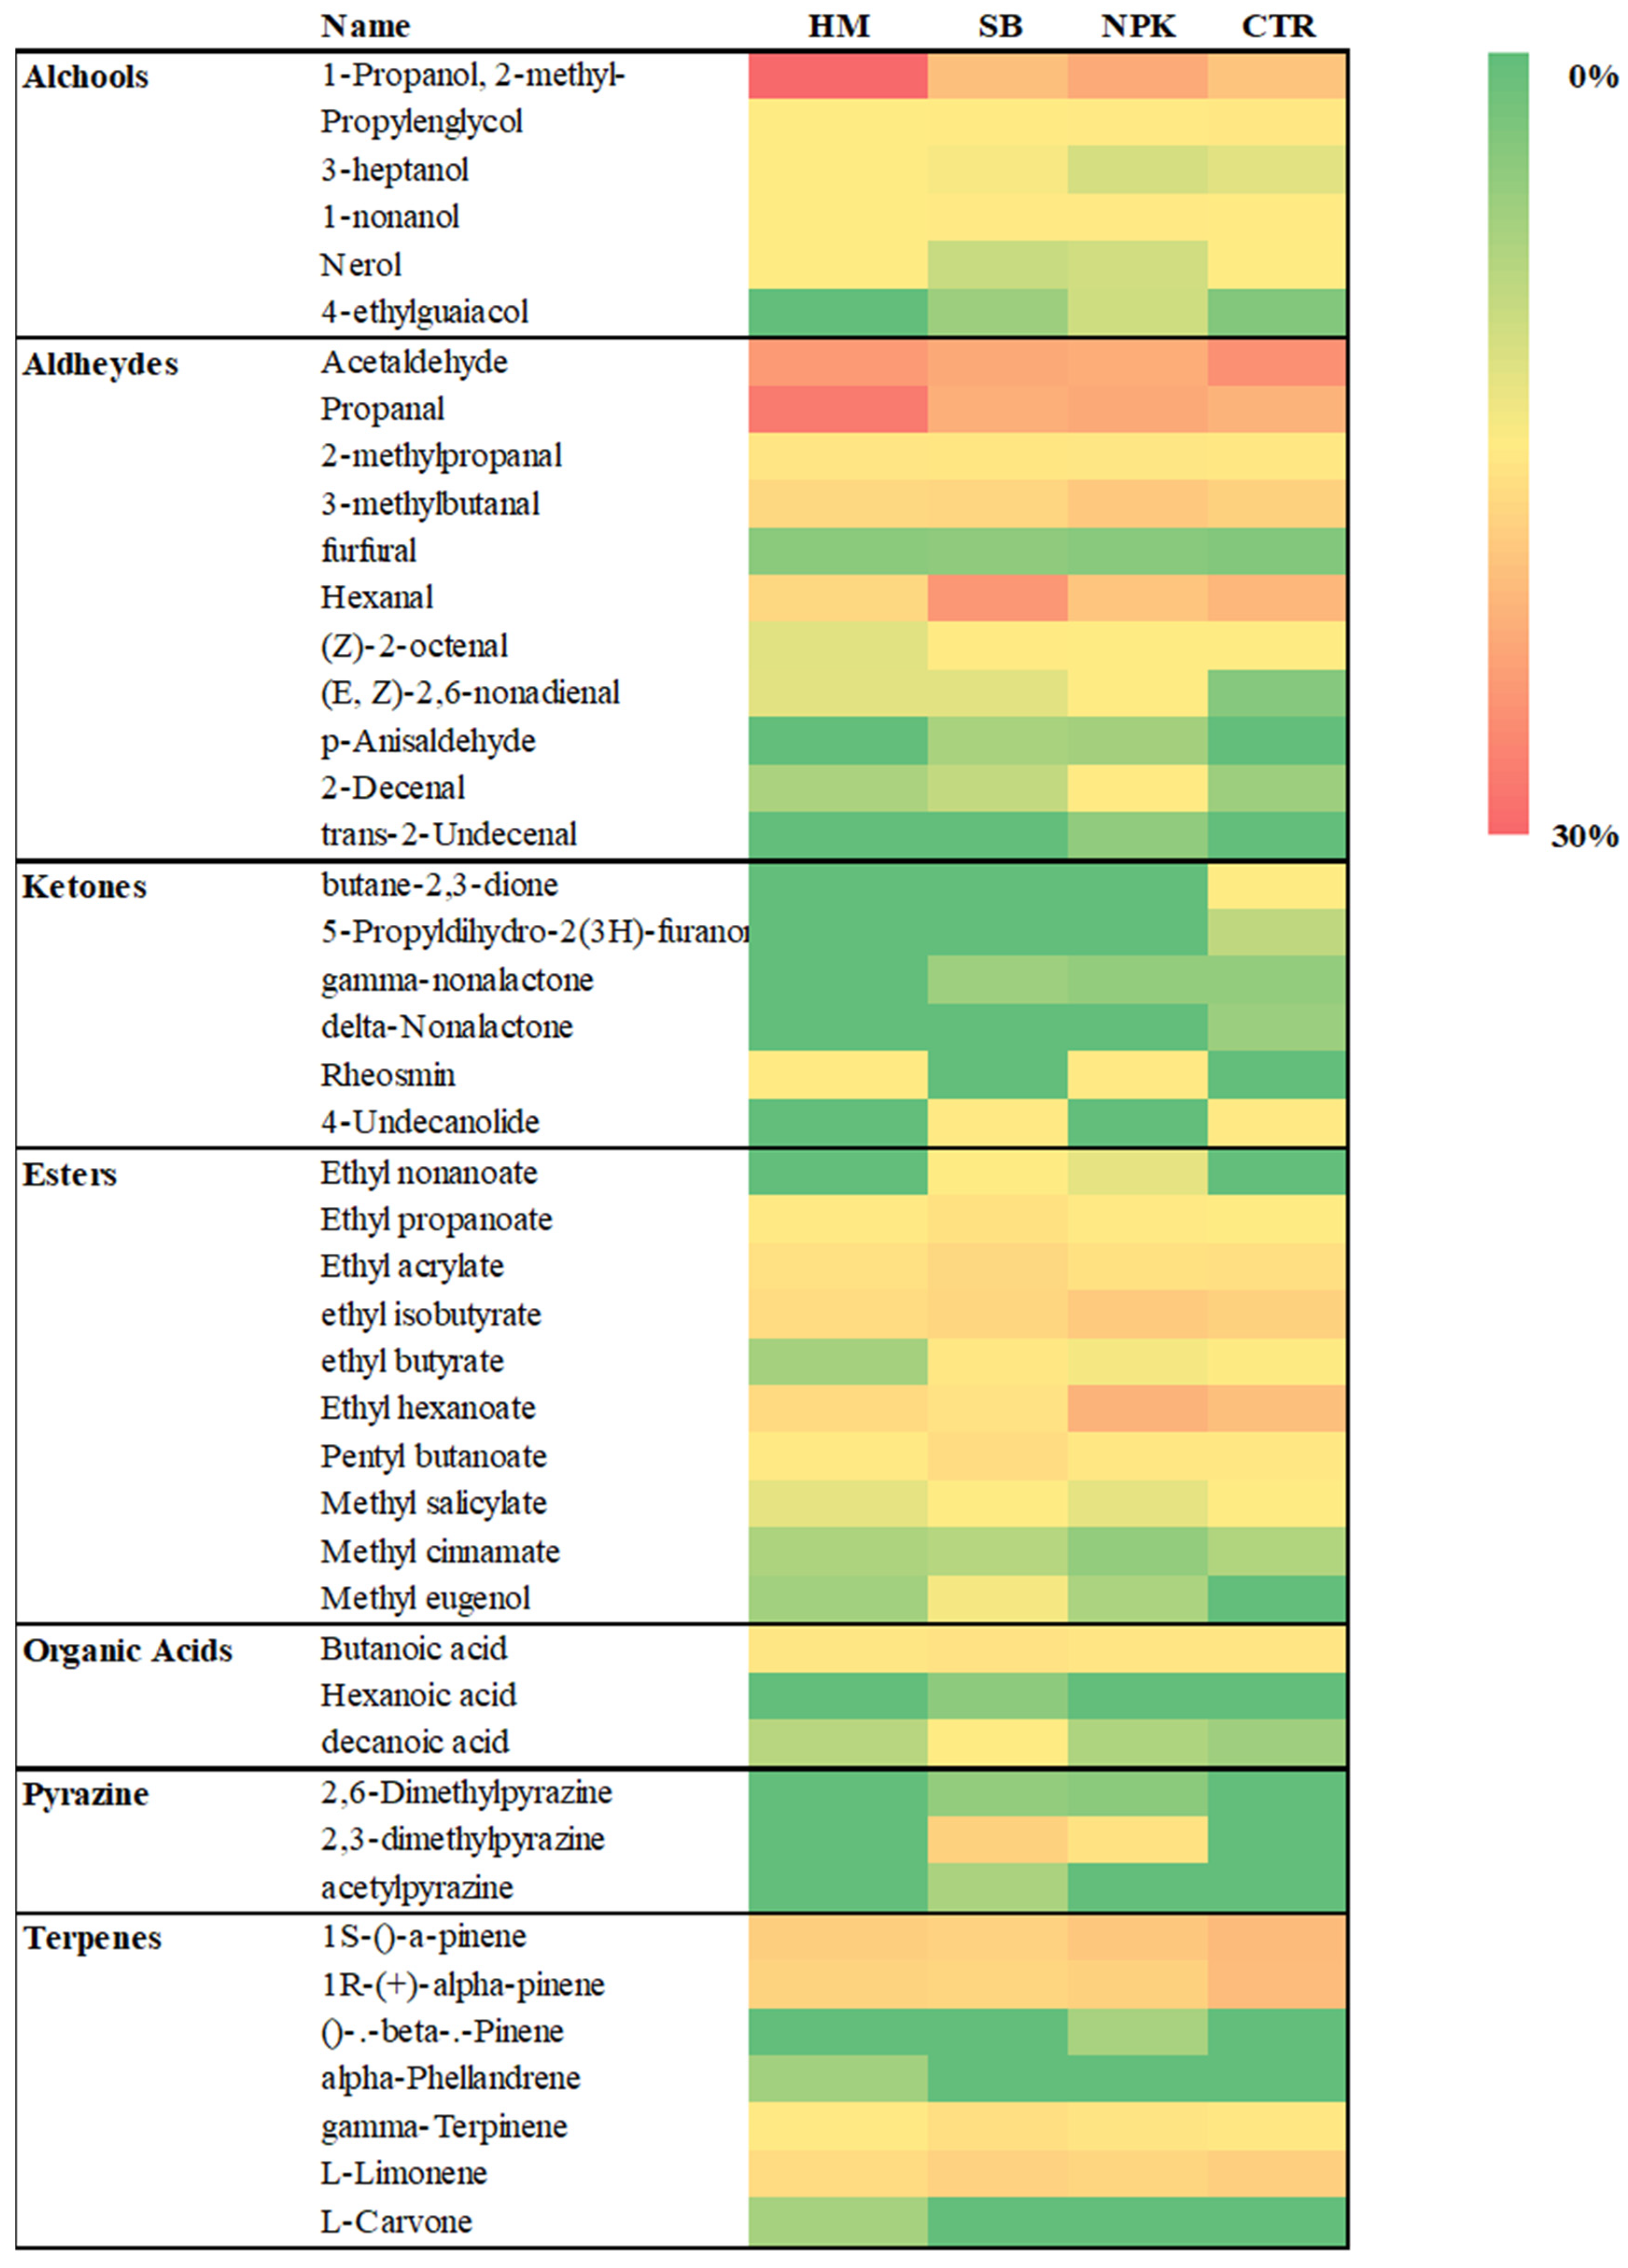
Figure 8.
Biplot PCA of tomato samples grown in unfertilized soil control (CTR ) and soils fertilized with nitrogen: phosphorous: potassium (NPK), sulphur bentonite with orange residue (SB), and horse manure (HM ) and discrimination odorous compounds: acetaldehyde (13,56-1-A), 3-heptanol (49,70-1-A), ethyl hexanoate (61,40-1-A), (Z) -2-octanal (66,63-1-A), unknow (10,68-2-A), butane-2, 3-dione (38,74-2-A), hexanal (56,36-2-A) and 1-nonanol (90,80-2-A),.
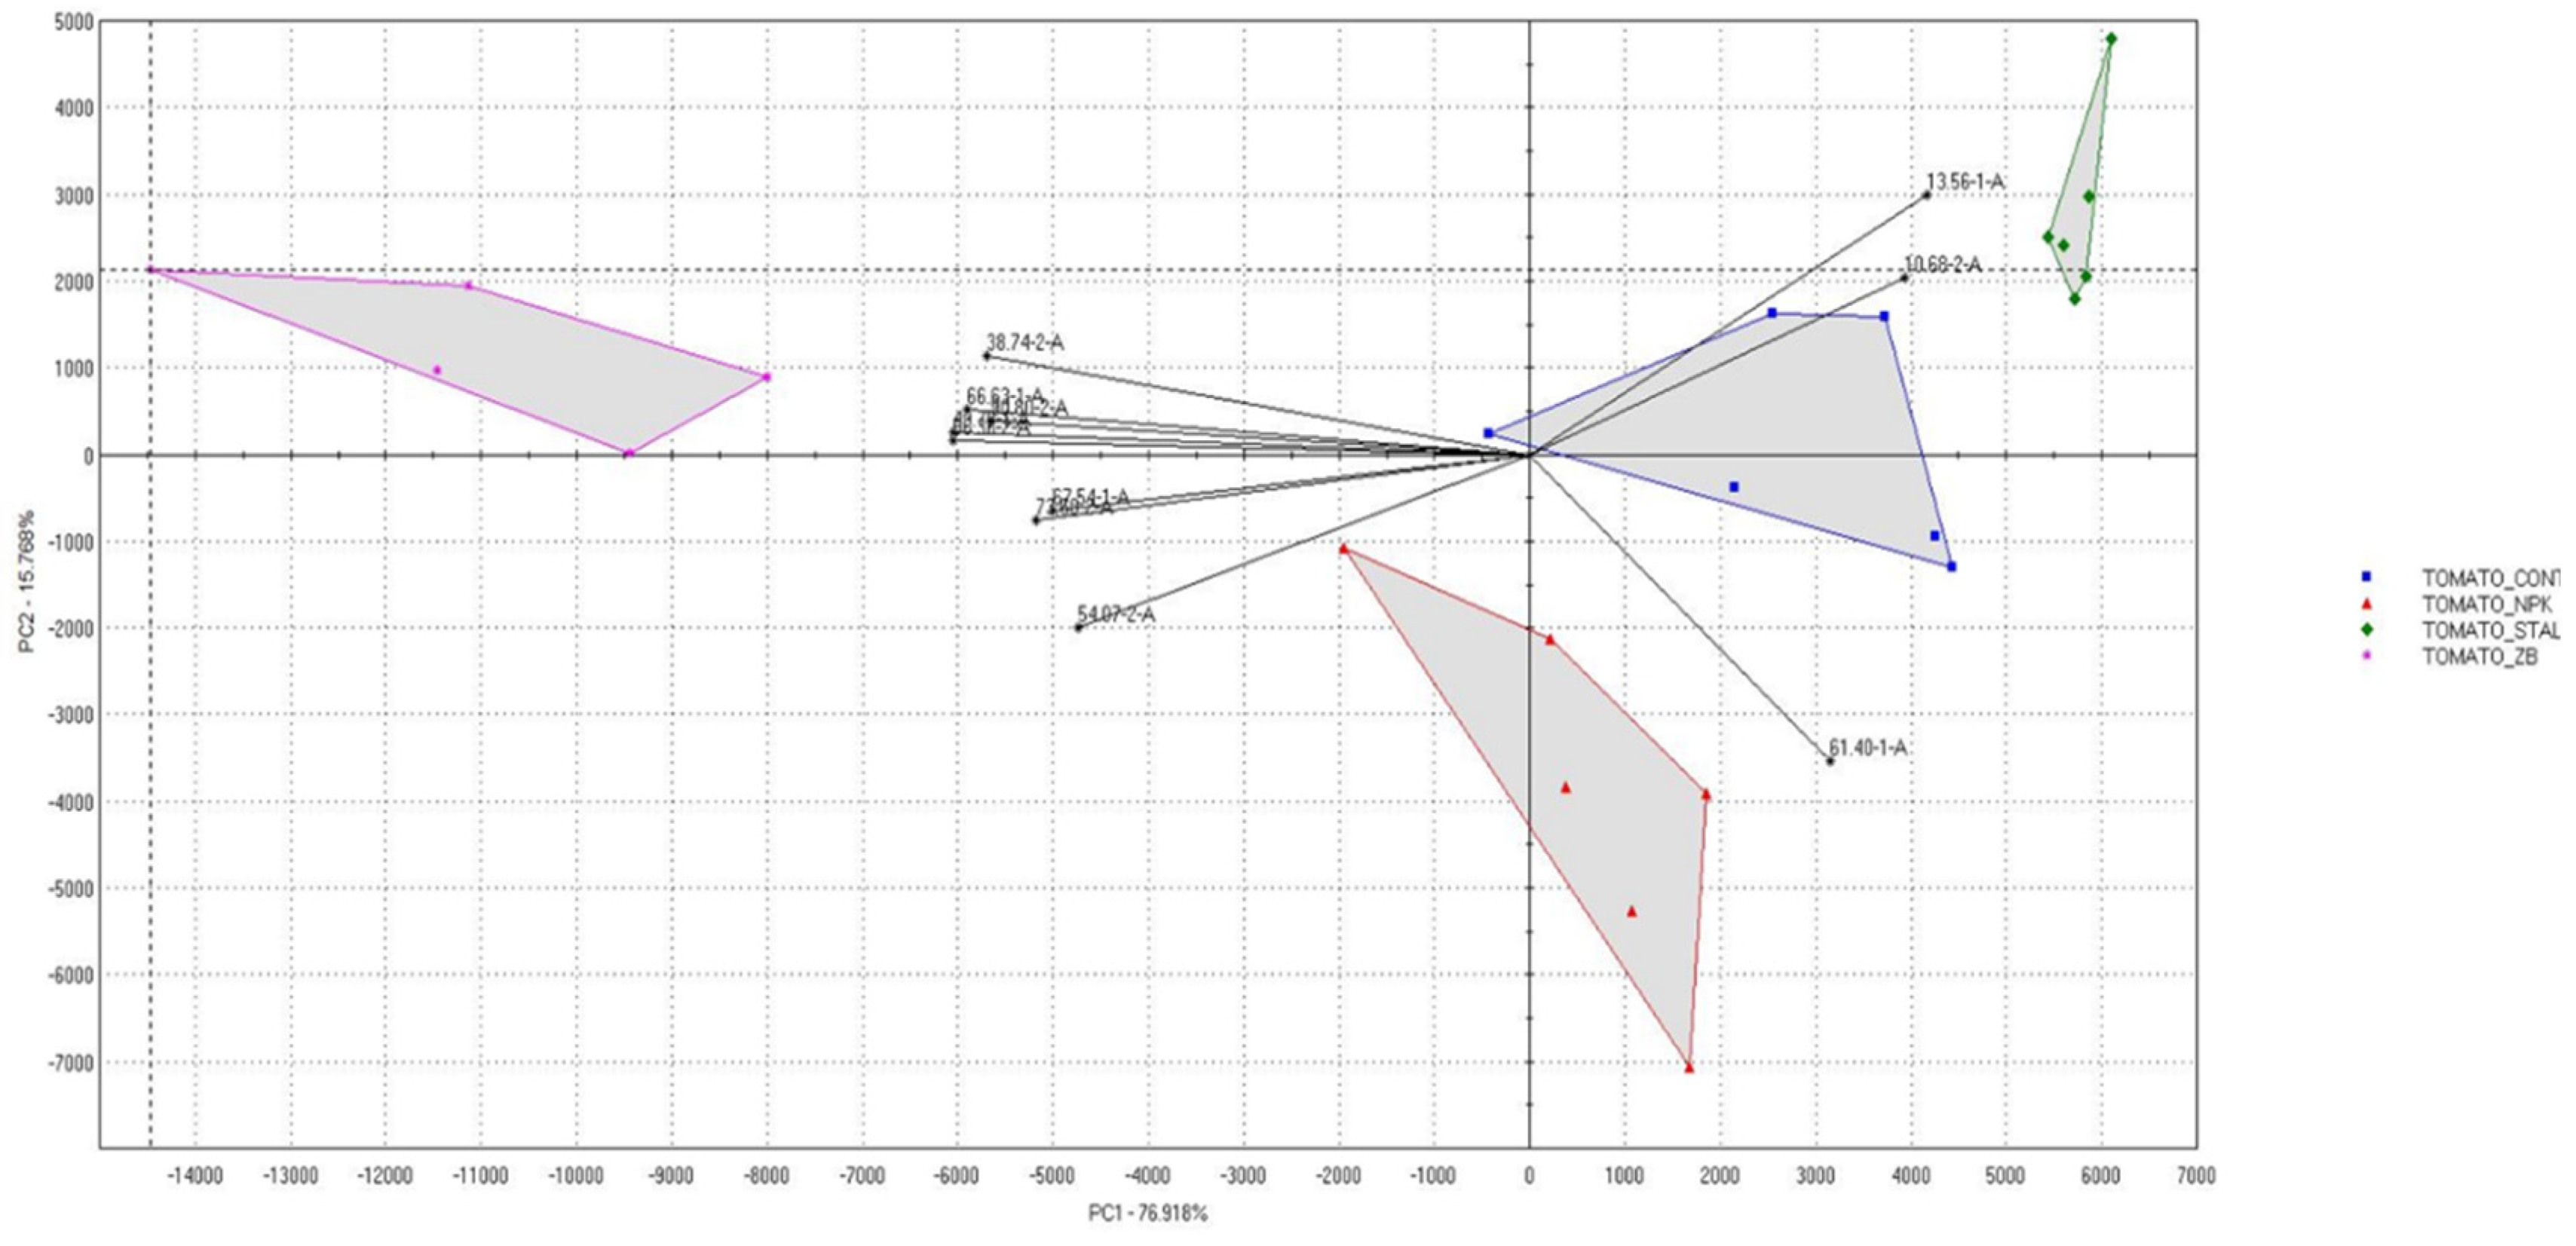
Figure 9.
Radar chart of selected discriminant peak of tomato samples grown in unfertilized soil control (CTR - ) and soils fertilized with nitrogen: phosphorous: potassium (NPK -
 ), sulphur bentonite with orange residue (SB -
 ), and horse manure (HM -
 ) and discrimination odorous compounds: acetaldehyde (13,56-1-A), 3-heptanol (49,70-1-A), ethyl hexanoate (61,40-1-A), (Z) -2-octanal (66,63-1-A), unknow (10,68-2-A), butane-2, 3-dione (38,74-2-A), hexanal (56,36-2-A) and 1-nonanol (90,80-2-A).
Figure 9.
Radar chart of selected discriminant peak of tomato samples grown in unfertilized soil control (CTR - ) and soils fertilized with nitrogen: phosphorous: potassium (NPK -
 ), sulphur bentonite with orange residue (SB -
 ), and horse manure (HM -
 ) and discrimination odorous compounds: acetaldehyde (13,56-1-A), 3-heptanol (49,70-1-A), ethyl hexanoate (61,40-1-A), (Z) -2-octanal (66,63-1-A), unknow (10,68-2-A), butane-2, 3-dione (38,74-2-A), hexanal (56,36-2-A) and 1-nonanol (90,80-2-A).
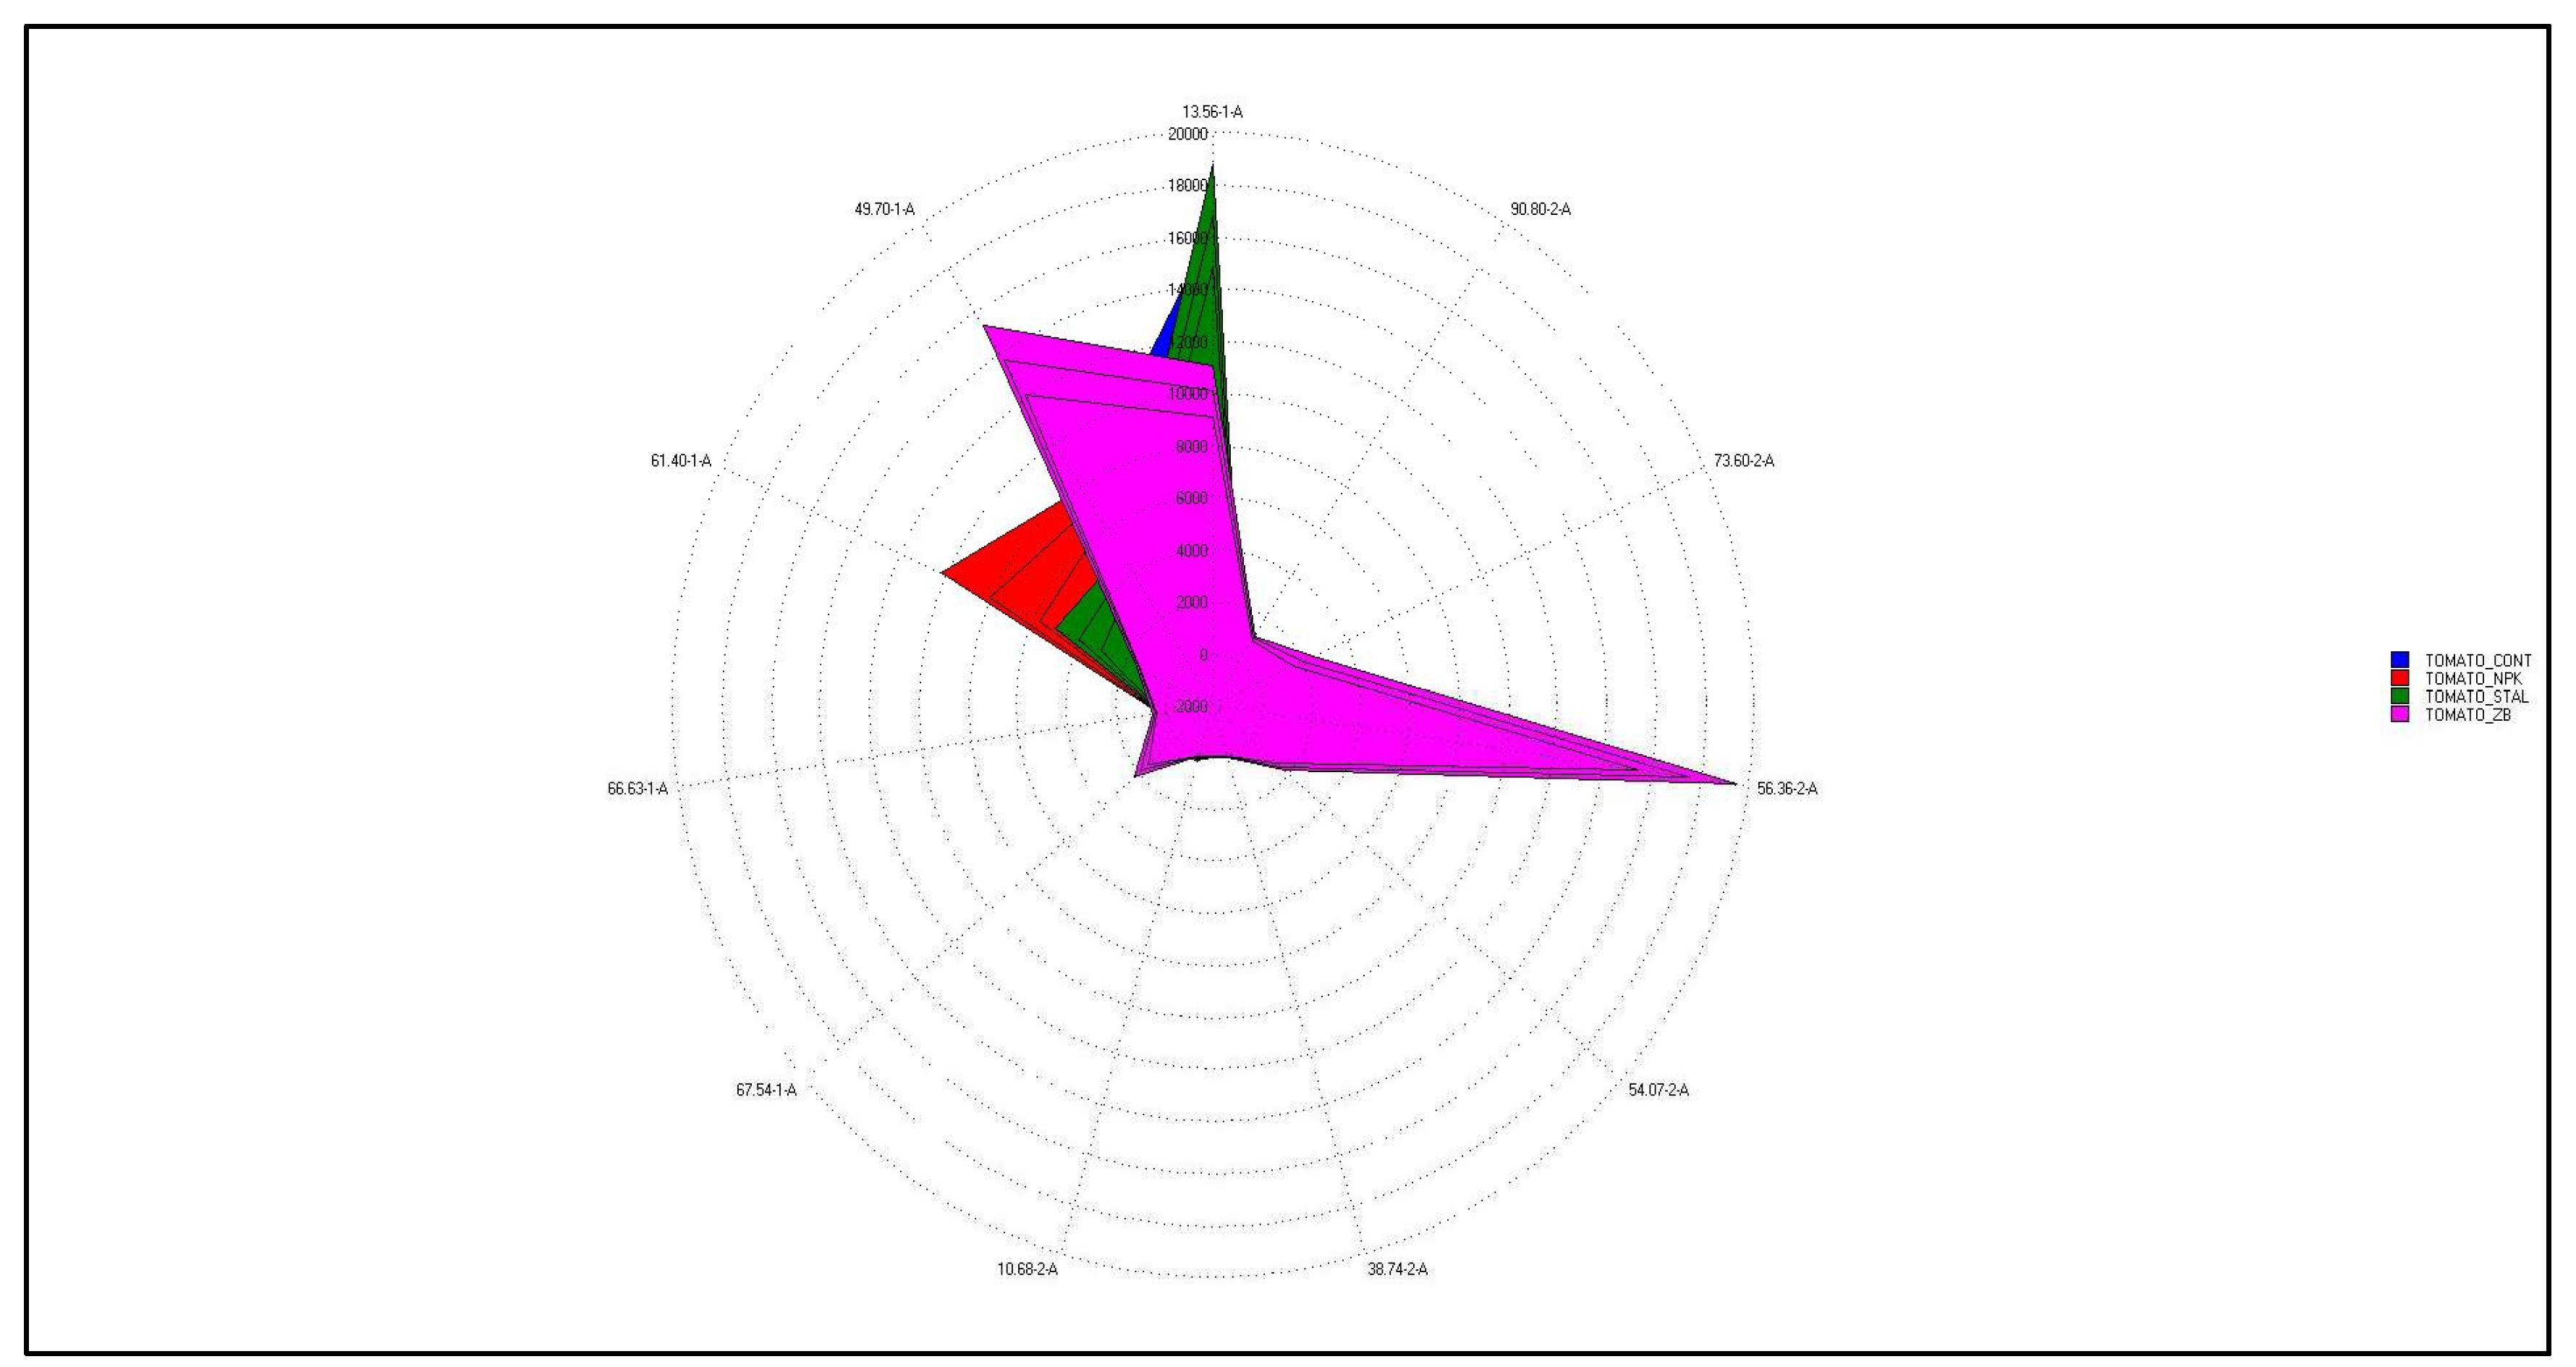
Figure 10.
A heat map of discriminant chromatographic peak of tomato samples fruits grown in unfertilized soil control (CONT) and soils fertilized with nitrogen: phosphorous: potassium (NPK), sulphur bentonite with orange residue (SB), and horse manure (HM) showing area of compounds by UFGC (green color means low peak area and red color is high in peak area, relatively).
3. Conclusions
The fertilization of crops either chemical that organic has been recommended, up to now, to improve soil productivity and compensate the lack of nutrients. This study, using fertilizers from agro-industrial wastes containing both single nutrients and organic components can be instead used as improver of soil but also as improver of crop quality. The aromatic profiles of treated tomato, in good agreement with the secondary metabolites, have been heavily modified in intensity and composition by SB that differently influenced the production of bioactive compounds, increasing the bioactive compounds with antioxidant activity and the main compounds responsible for the best characteristics of tomato flavor. Taken together these results highlight as the fertilization with fertilizers produced by wastes can be used as bio-stimulant to strengthen bioactive compounds in fruits providing a new strategy to ameliorate the nutraceutical power and profitability of crops with prominent results on bio and green economy.
4. Materials and Methods
4.2. Tomato Cultivation and Experimental Design
Experimental sites were located in Motta San Giovanni, Loc. Liso, Italy in a sandy-loam soil (11.85% clay, 23.21% silt, and 64.94% sand) according to Food and Agriculture Organization (FAO) soil classification system [44]. The soils were slightly alkaline and contained 3.09% organic matter and 0.17% nitrogen. Soil amendment was performed in triplicates in field, separated in parcel of 1 m square each. In each parcel, 3–4 plants/m²of tomato were transplanted exactly at the same size (six leaf stage). The parcels were fertilized with: sulphur bentonite-orange pads (SBO) at the dose of 476 kg S ha–1, nitrogen: phosphorous: potassium, NPK (20/10/10) at 170 kg ha-1 and horse manure (HM) at 430 Kg ha-1. Unfertilized soil was used as control. Plants were watered regularly to maintain water content at 70% of field capacity in all the parcels. The experiment was arranged in a randomized complete block design, the parcels were six for each treatment and the experiment have been replicated for three consecutive years. The differently treated tomatoes were collected at the same ripeness state on the basis of the visual characteristics (size, shape, and color). The results reported in the tables are the mean of the parcel and of three consecutive years n=18.
4.3. Sample Preparation
A portion of the differently treated tomato samples, harvested at the same state of ripeness, was stored at -80° C until the preparation of the extracts. Before proceeding, tomato fruit was dried in a ventilated oven and ground using a mortar and pestle. The analyses of the volatile fraction were immediately carried out on freshly picked fruits cut into small pieces. The samples were not subjected to grinding to avoid the development of secondary compounds.
4.4. Preparation of Ethanol and Water Extracts
4.5. Total Soluble Proteins
Soluble proteins, estimated as mg/g FW, were determined using the Bradford method as reported in Muscolo et al. [16].
4.6. Total Available Carbohydrates
The total available carbohydrates were measured using the anthrone method with minor modifications as reported in Muscolo et al. [46].
4.7. Total Water-Soluble Phenols, Ascorbic Acid, Total Carotenoids, Total Flavonoids, and Vitamin E
Total water-soluble phenols were measured using the Folin-Ciocalteu assay [47] with few changes as reported in Muscolo et al. [46].
Ascorbic acid was assessed in tomato powder (0.10 g) extracted with a solution of meta-phosphoric acid (3%)–acetic acid (7.98%), centrifuged at 2365 × g (4000 rpm) for 10 min. Ascorbic acid was detected in the supernatant using Davies and Masten method [48].
Vitamin E, was detected following the method of Prieto [49]. The absorbance was recorded at 695 nm.
Flavonoids were estimated using the aluminium chloride colorimetric method of Djeridane et al. [50].
For total carotenoids, was assessed as reported by Zhang et al. [51].
4.8. Ultra-Fast Gas Chromatography Analysis
The ultra-fast gas chromatography (UFGC) analysis (mod. Heracles II, Alpha MOS, Toulouse, France) coupled with an Odorscanner headspace autosampler (mod. HS 100, CTC Analytics, Zwingen, Switzerland) to automate sampling and injection was used. The Heracles II was equipped with two metal columns of different polarities working in parallel mode: a non-polar column (MXT-5: 5% diphenyl, 95% methylpolysiloxane), and a mid-polar column (MXT-1701: 14% cyanopropylphenyl, 86% methylpolysiloxane), both 10mlong and 0.18mmin diameter, coupled to two flame ionization detectors (FID1 and FID2). Therefore, two chromatograms obtained simultaneously, allow a well-defined identification of the chemical compounds. The instrument is operated through AlphaSoft 2020 7.2.5, software that can be used within the additionally AroChemBase module (Alpha MOS, Toulouse, France). The analyzes of the volatile fraction were immediately carried out on freshly picked fruits. The samples were not subjected to grinding to avoid the development of secondary compounds. For each sample, approximately 2 mL of headspace delivered at 125 µl/s from the autosampler to the injector, at 200 degrees Celsius. The setting of UFGC are reported in Muscolo et al. (2020).
4.9. Statistical Analysis
Analysis of variance was carried out for all the data sets. One-way ANOVA with Tukey's Honestly. Significant Difference test were carried out to analyse the effects of fertilizers on each of the various parameters measured. ANOVA and T-test were carried out using XLStat. Effects were significant at p ≤ 0.01. To explore relationships among different fertilizers and tomato parameters datasets were analysed using Principal Component Analysis (PCA). PCA was also used to process the UFGC results, where features with the greatest discriminatory power between samples were selected. For visualization, the native UFGC program AlphaSoft 2020 version 7.2.5 (Alpha MOS, Toulouse, France) was used. A heat map for relative comparisons for each volatile compound was generated.
Funding
This research was funded by European Commission, LIFE20 ENV/IT/000229 – LIFE RecOrgFert PLUS ”.
References
- Food and Agriculture Organization of the United Nations (FAO). Available online: http://www.fao.org/faostat/en/#home.
- Ilahya, R.; Hdiderb, C.; Lenucci, MS.; Tlili, I.; Dalessandro, G. Phytochemical composition and antioxidant activity of high-lycopene tomato (Solanum lycopersicum L.) cultivars grown in Southern Italy. Sci. Hort 2011, 127, 255–261. [Google Scholar] [CrossRef]
- Pinela, J.; Barros, L.; Carvalho, AM. ; Ferreira ICFR. Nutritional composition and antioxidant activity of four tomato (Lycopersicon esculentum L.) farmer’ varieties in Northeastern Portugal homegardens. Food Chem. Toxicol 2012, 50, 829–834. [Google Scholar] [CrossRef] [PubMed]
- Martirosyan, D. , Miller E., Bioactive Compounds: The Key to Functional Foods. Bioactive Compounds in Health and Disease 2018, 1, 36–39. [Google Scholar] [CrossRef]
- Agarwal, S.; Rao, A.V. Tomato lycopene and its role in human health and chronic diseases. Can. Med. Assoc. J. 2000, 163, 739–744. [Google Scholar]
- Habibi, A.; Heidari, G.; Sohrabia, Y.; Badakhshan, H.; Mohammadi, K. ; Influence of bio, organic and chemical fertilizers on medicinal pumpkin traits. J. Med. Plant. Res. 2011, 523, 5590–5597. [Google Scholar]
- Dumas, Y.; Dadomo, M.; Di Lucca, G.; Grolier, P. Effects of environmental factors and agricultural techniques on antioxidant content of tomatoes. J. Sci. Food Agric 2003, 83, 369–382. [Google Scholar] [CrossRef]
- Young, J.W.; Mau, J.L.; Ko, P.T.; Huang, L.C.; Antioxidant properties of fermented soybean broth. Food Chem. 2000; 71, 249–254. [CrossRef]
- Verma, A.; Sharma, R.; Kumar, C.; Kaur, A.; Arora, R.; Shah, L. Nain Improvement of antioxidant and defense properties of Tomato (var. Pusa Rohini) by application of bioaugmented compost Saudi J. Biol. Sci., 2015, 22, 256-264. [CrossRef]
- Jin, N.; Jin, L.; Wang, S.; Li, J.; Liu, F.; Liu, Z.; Luo, S.; Wu, Y.; Lyu, J.; Yu, J.; Reduced Chemical Fertilizer Combined With Bio-Organic Fertilizer Affects the Soil Microbial Community and Yield and Quality of Lettuce. Front Microbiol. 2022, 21, 13:863325. PMID: 35531292; PMCID: PMC9069001. [CrossRef]
- Moradzadeh, S.; Siavash Moghaddam, S.; Rahimi, A.; et al. Combined bio-chemical fertilizers ameliorate agro-biochemical attributes of black cumin (Nigella sativa L.). Sci. Rep. 2021, 11, 11399. [CrossRef]
- Akiyama, T.; Shimo, Y.; Yanai, H.; Qin, J.; Ohshima, D.; Maruyama, Y.; Asaumi, Y.; Kitazawa, J.; Takayanagi, H.; Penninger, J.M.; et al. The tumor necrosis factor family receptors RANK and CD40 cooperatively establish the thymic medullary microenvironment and self-tolerance. Immunity 2008, 29, 423–437. [Google Scholar] [CrossRef]
- Silva, M.L.d.S.; Trevizam, A.R.; Piccolo, M.C.; Furlan, G. Tomato production in function of sulfur doses application. Rev. Bras. Tecnol. Apl. Ciências Agrárias 2014, 7, 47–54. [Google Scholar]
- Chowdhury, MAH.; Sultana, T.; Rahman, MA.; Saha, BK.; Chowdhury, T.; Tarafder S. Sulphur fertilization enhanced yield, its uptake, use efficiency and economic returns of Aloe vera L. Heliyon. 2020, 18; 6(12):e05726. PMID: 33364495; PMCID: PMC7753130. [CrossRef]
- De Pascale, S.; Maggio, A.; Pernice, R.; Fogliano, V.; Barbieri, G. Sulphur fertilization may improve the nutritional value of Brassica rapa L. subsp. sylvestris Europ. J. Agron. 2007, 26, 418–424. [Google Scholar] [CrossRef]
- Yanar, D.; Geboloğlu, N.; Yanar, Y.; Aydin, M.; Çakmak, P. Effect of different organic fertilizers on yield and fruit quality of ındeterminate tomato (Lycopersicon esculentum). Sc. Re. Essays 2011, 6, 3623–3628. [Google Scholar] [CrossRef]
- Ibañez, T. B.; de Melo Santos, LF.; de Marcos, A.; Igor, L.; Ribeiro, V.; Ribeiro, F.V.; dos Reis, A.R.; Adônis Moreira, A.; Heinrichs, R. Sulfur modulates yield and storage proteins in soybean grains.). Soil Plant Nutr. 2021, 78. [Google Scholar] [CrossRef]
- Degryse, F.; Baird, R.; da Silva, R.C.; Holzapfel, C.B.; Kappes, C.; Tysko, M.; McLaughlin, M.J. Sulfur Uptake from Fertilizer Fortified with Sulfate and Elemental S in Three Contrasting Climatic Zones. Agronomy 2020, 10, 1035. [Google Scholar] [CrossRef]
- Thangasamy, A.; Kalyani, G.; Pranjali, H.; Ghodke, S.; Ahammed T.P.; Manjusha J.; Kaushik B.; Major S. Effects of sulfur fertilization on yield, biochemical quality, and thiosulfinate content of garlic, Sci. Hort. 2021, 289, 110442, ISSN 0304-4238. [CrossRef]
- Nawirska-Olszanska, A.; Biesiada, A.; Kita, A. Effect of Different Forms of Sulfur Fertilization on Bioactive Components andv Antioxidant Activity of White Cabbage (Brassica Oleracea L.). Appl. Sci. 2021, 11, 8784. [CrossRef]
- Judita, B.; Petra, K.; Alena, V.; Ján, T.; Matyáš, O. The role of sulphur on the content of total polyphenols and antioxidant activity in onion (Allium Cepa L.). Potravinarstvo 2014, 8, 284–289. [Google Scholar]
- Muscolo, A.; Papalia, T.; Settineri, G.; Mallamaci, C.; Panuccio, M.R. Sulfur bentonite-organic-based fertilizers as tool for improving bio-compounds with antioxidant activities in red onion. J. Sci. Food Agric. 2019, 100, 785–793. [Google Scholar] [CrossRef] [PubMed]
- Montesano, V.; Negro, D.; Sonnante, G.; Laghetti, G.; Urbano, M. Polyphenolic Compound Variation in Globe Artichoke Cultivars as Affected by Fertilization and Biostimulants Application. Plants 2022, 11, 2067. [Google Scholar] [CrossRef]
- Tietel, Z.; Yermiyahu, U.; Bar-Tal, A. Sulfate Fertilization Preserves Tomato Fruit Nutritional Quality. Agronomy 2022, 12, 1117. [Google Scholar] [CrossRef]
- Tungmunnithum, D.; Thongboonyou, A.; Pholboon A.; Yangsabai, A.; Flavonoids and Other Phenolic Compounds from Medicinal Plants for Pharmaceutical and Medical Aspects: An Overview. Medicines (Basel). 2018, 25;5(3), 93. PMID: 30149600; PMCID: PMC6165118. [CrossRef]
- Mutha RE.; Tatiya AU.; Surana SJ.; Flavonoids as natural phenolic compounds and their role in therapeutics: an overview. Futur J Pharm Sci. 2021;7(1):25. Epub 2021 Jan 20. PMID: 33495733; PMCID: PMC7816146. [CrossRef]
- Di Lorenzo, C.; Colombo, F.; Biella, S.; Stockley, C.; Restani, P. Polyphenols and Human Health: The Role of Bioavailability. Nutrients 2021, 13, 273. [Google Scholar] [CrossRef]
- Tchonkouang, R.D.N.; Antunes, M.D.C.; Vieira, M.M.C.; 'Potential of Carotenoids from Fresh Tomatoes and Their Availability in Processed Tomato-Based Products', in R. M. Martínez-Espinosa (ed.), Carotenoids - New Perspectives and Application, IntechOpen, London. 2022. [CrossRef]
- Mozos, I.; Stoian D.; Caraba A.; Malainer, C.; Horbańczuk, JO.; Atanasov Atanas G. Lycopene and Vascular Health Frontiers in Pharmacology, 2018 9, ISSN=1663-9812. https://www.frontiersin.org/articles/10.3389/fphar.2018.00521. [CrossRef]
- Arballo, J.; , Jaume, A.; John, W.E. "Lycopene: A Critical Review of Digestion, Absorption, Metabolism, and Excretion" Antioxidants 2021. 10, no. 3: 342. [CrossRef]
- Ferraz, C.R.; Carvalho, T.T.; Manchope, M.F.; Artero, N.A.; Rasquel-Oliveira, F.S.; Fattori, V.; Casagrande, R.; Verri, W.A., Jr. Therapeutic Potential of Flavonoids in Pain and Inflammation: Mechanisms of Action, Pre-Clinical and Clinical Data, and Pharmaceutical Development. Molecules 2020, 25, 762. [Google Scholar] [CrossRef]
- Feng, X.; Weng, D.; Zhou, F.; Owen, Y.D.; Qin, H.; Zhao, J.; Huang, Y.; Chen, J.; Fu, H.; Yang, N.; et al. Activation of PPARgamma by a Natural Flavonoid Modulator, Apigenin Ameliorates Obesity-Related Inflammation Via Regulation of Macrophage Polarization. EBioMedicine 2016, 9, 61–76. [Google Scholar] [CrossRef]
- Rosa, S.I.; Rios-Santos, F.; Balogun, S.O.; Martins, D.T. Vitexin reduces neutrophil migration to inflammatory focus by down-regulating pro-inflammatory mediators via inhibition of p38, ERK1/2 and JNK pathway. Phytomedicine 2016, 23, 9–17. [Google Scholar] [CrossRef] [PubMed]
- Li, X.; Han, Y.; Zhou, Q.; Jie, H.; He, Y.; Han, J.; He, J.; Jiang, Y.; Sun, E. Apigenin, a potent suppressor of dendritic cell maturation and migration, protects against collagen-induced arthritis. J. Cell. Mol. Med. 2016, 20, 170–180. [Google Scholar] [CrossRef]
- Yang, H.; Huang, J.; Mao, Y.; Wang, L.; Li, R.; Ha, C. Vitexin alleviates interleukin-1beta-induced inflammatory responses in chondrocytes from osteoarthritis patients: Involvement of HIF-1alpha pathway. Scand. J. Immunol. 2019. [Google Scholar] [CrossRef]
- Kopustinskiene, DM.; Jakstas, V.; Savickas, A.; Bernatonien, J. Flavonoids as Anticancer Agents. Nutrients. 2020, 12(2), 457. [Google Scholar] [CrossRef]
- Buttery, R.G.; Ling, L.C. Volatile Components of Tomato Fruit and Plant Parts. In Bioactive Volatile Compounds from Plants; Teranishi, R., Buttery, R.G., Sugisawa, H., Eds.; American Chemical Society: Washington, DC, USA, 1993; pp. 23–34. [Google Scholar]
- Libin Wang & Elizabeth A. Baldwin & Jinhe Bai. Recent Advance in Aromatic Volatile Research in Tomato Fruit: The Metabolisms and Regulations. Food Bioprocess Technol. 2016, 9, 203–216. [CrossRef]
- Zhan, P.; Tian, H.; Sun, B.; Zhang, Y.; Chen, H. Quality control of mutton by using volatile compound fingerprinting techniques and chemometric methods. J. Food Qual. 2017, 1–8. [Google Scholar] [CrossRef]
- Muscolo, A.; Papalia, T.; Settineri, G.; Mallamaci, C.; Carabetta, S.; Di Sanzo, R.; Russo, MT. Effect of organic fertilizers on selected health beneficial bioactive compounds and aroma profile of Topepo sweet pepper. Foods 2020, 9, 1323. [Google Scholar] [CrossRef] [PubMed]
- Korˇcok, M.; Vietorisová, N.; Martišová, P.; Štefániková, J.; Mravcová, A.; Vietoris, V. Aromatic Profile of Hydroponically and Conventionally Grown Tomatoes. Appl. Sci. 2021, 11, 8012. [Google Scholar] [CrossRef]
- Libin, W.; Elizabeth, A. Baldwin JB. Recent Advance in Aromatic Volatile Research in Tomato Fruit: The Metabolisms and Regulations. Food Bioprocess Technol. 2016, 9, 203–216. [CrossRef]
- Wakai, J.; Kusama, S.; Nakajima, K. Effects of trans-2-hexenal and cis-3-hexenal on post-harvest strawberry. 2019, Sci Rep. 9, 10112. [CrossRef]
- FAO-UNESCO, 1999. Word soil map, revised legend. Rome.
- Kang, M.C.; Kim, S.-Y.; Kim, E.-A.; Lee, J.-H.; Kim, Y.-S.; Yu, S.-K.; Chae, J.B.; Choe, I.-H.; Cho, J.H.; Jeon, Y.-J. Antioxidant activity of polysaccharide purified from Acanthopanax koreanum Nakai stems in vitro and in vivo zebrafish model. Carb. Polym. 2015, 127, 38–46. [Google Scholar] [CrossRef] [PubMed]
- Muscolo, A.; Calderao, A.; Papalia, T.; Settineri, G.; Mallamaci, C.; Panuccio, M.R. Soil salinity improves nutritional and health promoting compounds in three varieties of lentil (Lens culinaris Med.). Food Biosci 2020, 35, 100571. [Google Scholar] [CrossRef]
- Velioglu, Y.S.; Mazza, M.; Gao, L.; Oomah, B.D. Antioxidant activity and total phenolics in selected fruits, vegetables, and grain products. J. Agric. Food Chem. 1998, 46, 4113–4117. [Google Scholar] [CrossRef]
- Davies, S.H.R.; Masten, S.J. Spectrophotometric method for ascorbic acid using dichlo-rophenolindophenol: Elimination of the interference due to iron. Anal. Chim. Acta 1991, 248, 225–227. [Google Scholar] [CrossRef]
- Prieto, P.; Pineda, M.; Aguilar, M. Spectrophotometric quantitation of antioxidant capacity through the formation of a phosphomolybdenum complex: Specific application to the determination of vitamin E. Anal. Biochem. 1999, 269, 337–341. [Google Scholar] [CrossRef] [PubMed]
- Djeridane, A.; Yousfi, M.; Nadjemi, B.; Boutassouna, D.; Stocker, P.; Vidal, N. Antioxidant activity of some Algerian medicinal plants extracts containing phenolic compounds. Food Chem. 2006, 97, 654–660. [Google Scholar] [CrossRef]
- Zhang, B.; Deng, Z.; Tang, Y.; Chen, P.; Liu, R.; Ramdath, D.D.; Liu, Q.; Hernandez, M.; Tsao, R. Fatty acid, carotenoid and tocopherol compositions of 20 Canadian lentil cultivars and synergistic contribution to antioxidant activities. Food Chem. 2014, 161, 296–304. [Google Scholar] [CrossRef] [PubMed]
Disclaimer/Publisher’s Note: The statements, opinions and data contained in all publications are solely those of the individual author(s) and contributor(s) and not of MDPI and/or the editor(s). MDPI and/or the editor(s) disclaim responsibility for any injury to people or property resulting from any ideas, methods, instructions or products referred to in the content. |
© 2023 by the authors. Licensee MDPI, Basel, Switzerland. This article is an open access article distributed under the terms and conditions of the Creative Commons Attribution (CC BY) license (http://creativecommons.org/licenses/by/4.0/).
Copyright: This open access article is published under a Creative Commons CC BY 4.0 license, which permit the free download, distribution, and reuse, provided that the author and preprint are cited in any reuse.
Waste-Derived Fertilizer Acts as Biostimulant, Boosting Tomato Quality and Aroma
Mariateresa Russo
et al.
,
2023
Interaction Effects of Cultivars and Nutrition on Quality and Yield of Tomato
Oana-Raluca Rusu
et al.
,
2023
MDPI Initiatives
Important Links
© 2024 MDPI (Basel, Switzerland) unless otherwise stated
