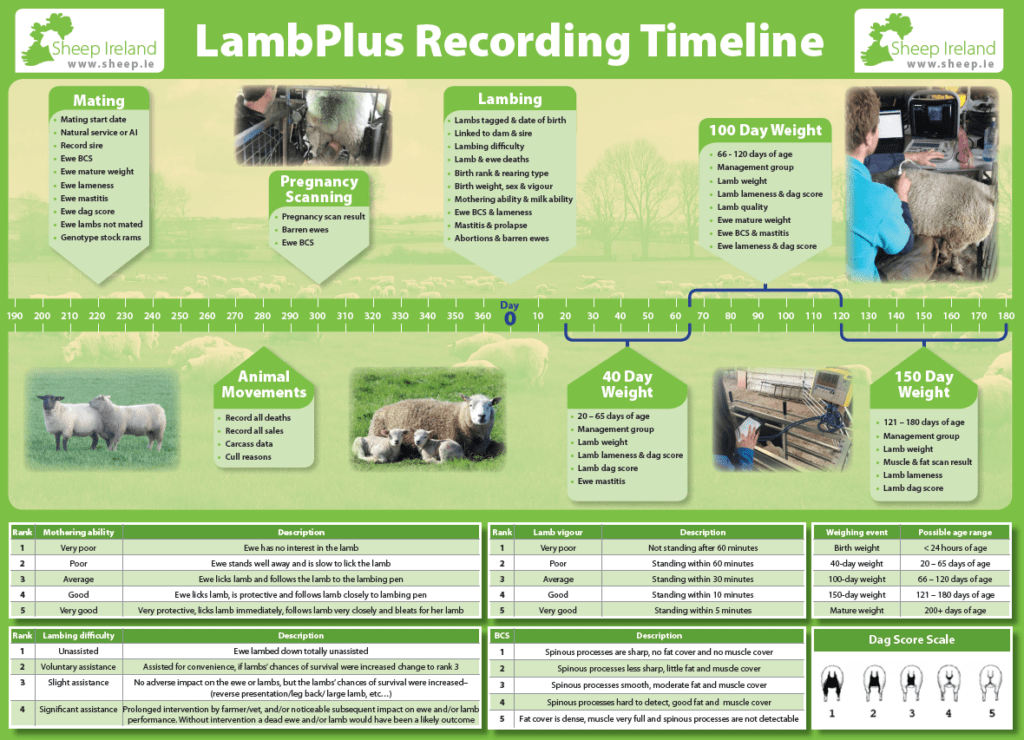
Click on each section to see How To Record:
The timeline is based around the 365-day production cycle starting at day 0, which is the day of lambing.
All the data to be recorded at lambing is listed and a description of how to record certain traits is included at the bottom of the wall chart.
If you want to download the timeline chart to save or print it, click on the chart or here: Timeline Wall Chart


Flock data can be recorded without an internet connection
FREE DOWNLOAD. Click to access your App Store:


