DrNon EMA5 Cross-Up EMA200 ATR Stop📌 EMA5 Cross-Up EMA200 Strategy with ATR Trailing Stop & Take-Profit
This TradingView strategy enters a long trade when the 5 EMA crosses above the 200 EMA, signaling an uptrend. It uses an ATR-based trailing stop-loss and exits at a predefined take-profit percentage.
How It Works
1. Entry Condition → A long position is triggered when the 5 EMA crosses above the 200 EMA.
2. Stop-Loss (ATR-Based Trailing Stop) → The stop price is dynamically set at Close - (ATR * Multiplier), adjusting as the price moves up.
3. Take-Profit → The strategy exits if the price reaches 5% above entry.
4. Exit Condition → The trade closes when either the ATR trailing stop or the take-profit target is hit.
Why Use This?
✅ Trend-Following – Catches strong uptrends with EMA crossover.
✅ Dynamic Stop-Loss – Uses ATR to adapt to market volatility.
✅ Automated Risk Management – Ensures systematic exits.
This strategy works well in trending markets but may require filters to avoid false signals in sideways conditions. Traders can adjust ATR multipliers and take-profit % for optimization. 🚀
อินดิเคเตอร์และกลยุทธ์

Cloud-Optimized MomentumThis strategy is based on the Ichimoku Cloud indicator, designed to identify potential buy and sell signals in a market (like HWM stock). Here's a breakdown of the components and logic behind it:
Ichimoku Cloud Components:
Tenkan-sen: The moving average of the highest high and lowest low. It is used as a short-term trend indicator.
Kijun-sen: The moving average of the highest high and lowest low. It is considered the medium-term trend line.
Senkou Span A: The average of Tenkan-sen and Kijun-sen, shifted forward. It forms the leading edge of the cloud (Kumo).
Senkou Span B: The moving average of the highest high and lowest low, shifted forward. It forms the trailing edge of the cloud.
Chikou Span: The closing price shifted backward. It is used to confirm the trend.

Multi-Timeframe Open/Close LevelsThis level indicator can be used to help traders understand where Weekly, Daily, and 4 Hour closures happen. It allows level traders to buy at support and sell at resistance for most of their trades. As they understand where price action will move to, they can assume a price point will likely reverse or congest at different levels.
Example would be a seeing a weekly level directly above your current price action, therefore you will make your decision to short at the weekly level and allow your stop loss to be just over the weekly level.


337 Day EMA with buy/selll and uptrend downtrend Notifications!337 Day EMA with buy/selll and uptrend downtrend Notifications!
A a sophisticated trading tool designed to help traders identify significant market trends and make informed decisions. By leveraging the 337-day Exponential Moving Average (EMA), this indicator provides a clear visual representation of the long-term price trend of an asset. The EMA gives more weight to recent prices, making it a responsive and reliable indicator.
Key Features
337-day EMA Calculation
The indicator calculates the 337-day EMA, which smooths out price data and highlights the overall trend by giving greater significance to recent price changes.
Trend Identification
Uptrend: An uptrend is detected when the price crosses above the 337 EMA, signaling a potential bullish market. This is visually represented with a green "Uptrend" label below the corresponding bar.
Downtrend A downtrend is identified when the price crosses below the 337 EMA, indicating a potential bearish market. This is marked with a red "Downtrend" label above the corresponding bar.
Alert Notifications
The indicator includes built-in alert conditions for both uptrends and downtrends. Traders receive real-time notifications when the price crosses above or below the 337 EMA, ensuring they are promptly informed of significant market movements.
Customizable Visuals
The uptrend and downtrend labels are designed to be easily readable, with green "Uptrend" text boxes and red "Downtrend" text boxes, enhancing the clarity of the trend signals.
Benefits
Timely Alerts: Receive instant notifications about key trend changes, allowing for timely trading decisions.
Long-Term Perspective: The 337-day EMA provides a comprehensive view of the market's long-term trend, reducing the noise of short-term fluctuations.
Enhanced Readability: The clear visual labels for uptrends and downtrends make it easy to interpret the market conditions at a glance.
By integrating the "337 EMA with Uptrend/Downtrend Notifications" into your trading strategy, you can stay ahead of market trends and make more informed trading decisions. This tool is particularly useful for traders looking for a reliable way to identify long-term trends and react to significant market movements effectively.
Let me know if there's anything else you need or if you want more details! 📈

Price Difference CheckThis code calculates the difference between the highest and lowest values of the current candle, and if this difference is equal to or greater than the percentage value set in the settings, it displays a marker on the chart. Additionally, it shows the difference as a line on the chart.

MA Crossover Forex Bot by BomoloThis a simple trading strategy. MA cross overs. When the 21 Moving average cross over 50 moving average "GOLDEN CROSS" the bot take long trade. and when 50 moving average crosses over 21 moving average "DEATH" cross. The bot takesshort trade

BLAKFX Trading SystemYour indicator is an advanced Smart Money Concepts (SMC) trading system that combines multiple technical analysis approaches. Here's a detailed breakdown:
1. Core Components:
Market Structure Analysis:
- Break of Structure (BOS) detection
- Change of Character (CHOCH) identification
- Smart Money movement patterns
- Elliott Wave pattern tracking
Liquidity Analysis:
- Identifies buy and sell liquidity zones
- Marks liquidity points with circles (green for buy, red for sell)
- Tracks historical liquidity levels
Order Blocks:
- Detects bullish and bearish order blocks
- Shows them as colored boxes on the chart
- Uses volume confirmation for validation
Fair Value Gaps (FVG):
- Identifies both bullish and bearish FVGs
- Displays them as colored boxes
- Tracks historical FVG levels
2. Technical Elements:
Smart Money Technique (SMT):
- Uses EMA crossovers (50 and 200)
- Volume confirmation
- Shown as diamond shapes on the chart
Central Risk Transfer (CRT):
- Calculates equilibrium levels
- Shows as a yellow line on the chart
- Helps identify potential reversal zones
Elliott Wave Integration:
- Tracks wave counts
- Labels waves on the chart
- Helps with trend structure analysis
3. Trade Signals:
Entry Conditions:
- Long entries shown with green up arrows
- Short entries shown with red down arrows
- Combines multiple confirmations (SMT, liquidity, order blocks)
Visual Indicators:
- Color-coded for easy interpretation
- Historical signals maintained
- Clear entry and exit points
4. Risk Management:
- Built-in risk-reward ratio calculations
- ATR-based volatility consideration
- Clear trade information display
5. Customization Options:
Colors:
- Bullish/Bearish colors
- FVG colors
- Order block colors
Parameters:
- Lookback period
- Risk-reward ratio
- Various technical settings
6. Additional Features:
- Memory management (periodic array clearing)
- Alert conditions for entries
- Detailed trade information labels
- Historical pattern tracking
This indicator is particularly useful for traders who:
- Follow Smart Money Concepts
- Use institutional trading methods
- Need multiple confirmation layers
- Want clear visual signals
- Trade based on order flow and liquidity
Would you like me to elaborate on any particular aspect or explain how specific components work together?

Price Action Indicator (HarryDPotter)The "Enhanced Price Action Indicator" combines key technical analysis tools to identify high-probability trade entries in the crypto market. It integrates "price action" patterns (like bullish and bearish engulfing or pin bars) with trend confirmation from "EMA crossovers" and "ADX" for market strength. The indicator plots clear "long" and "short" signals based on these factors, with visual support and resistance levels, dynamic trendlines, and EMAs, helping traders make informed decisions during trending markets.

Normalized PVTNormalization of the PVT to avoid escalation problems.
The PVT is often lost when the timing of the graph changes, so valuable time is lost adjusting it. With this configuration, the adjustment is automatic to be displayed in the chosen time frame.
------------------------------------------------------------------------------------------------------
Normalización del PVT para evitar problemas de escala.
El PVT suele perderse al cambiar la temporalidad del gráfico, por lo que se pierde valioso tiempo para ajustarlo. Con esta configuración, el ajuste es automático para ser visualizado en la temporalidad elegida.

WMA 15 Cross EMA 50 with Stop Loss and EntryExplanation of the Code:
Inputs:
wma_length: Length for the Weighted Moving Average (default: 15).
ema_length: Length for the Exponential Moving Average (default: 50).
stop_loss_percent: Percentage for the stop loss level (default: 1%).
Indicators:
ta.wma(close, wma_length): Calculates the Weighted Moving Average.
ta.ema(close, ema_length): Calculates the Exponential Moving Average.
Signals:
buy_signal: Generated when WMA crosses above EMA.
sell_signal: Generated when WMA crosses below EMA.
Stop Loss and Entry Price:
For a buy signal, the stop loss is calculated as entry_price * (1 - stop_loss_percent).
For a sell signal, the stop loss is calculated as entry_price * (1 + stop_loss_percent).
The entry price is the closing price at the time of the signal.
Plotting:
WMA and EMA are plotted on the chart.
Buy and sell signals are marked with labels.
Stop loss and entry price levels are plotted as horizontal lines.
Alerts:
Alerts are triggered when buy or sell signals are generated.

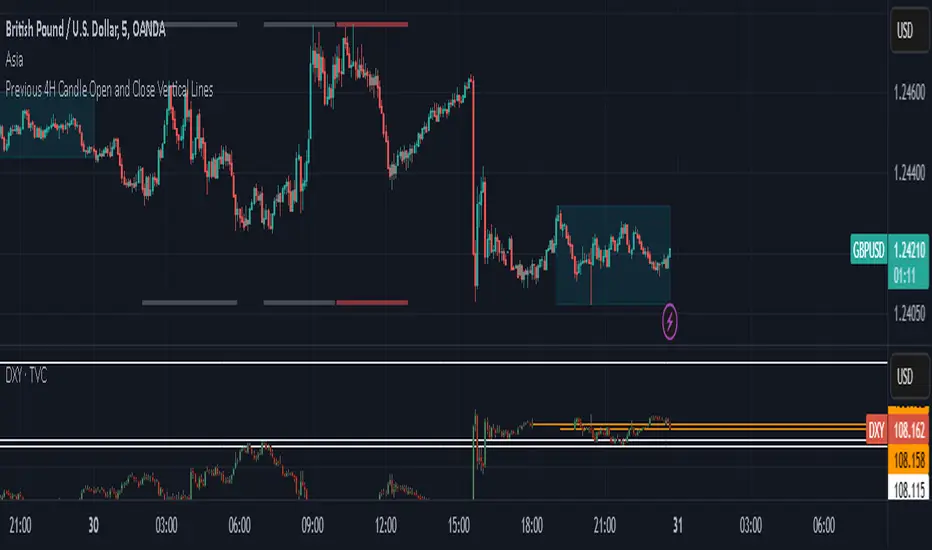
Previous 4H Candle Open and Close Vertical LinesPrevious 4H open and close for entry.
This indicator is useful for traders who want to visualize the start and end of the previous 4-hour candle. It can help identify key levels, such as support and resistance, or analyze price action around these times.
Let me know if you need further assistance!
Swing High/Low Breach Without CloseThis indicator helps traders identify potential reversal opportunities by detecting precise wick-based swing level breaks. It specifically looks for:
1. Swing highs/lows that formed with significant wicks
2. Current price action that wicks through (but doesn't close beyond) these levels
Key Features:
- Automatically identifies swing points that formed with substantial wicks
- Detects when price wicks through these levels without closing beyond them
- Dynamic marker positioning that scales with your chart
- Customizable swing length and wick size parameters
- Clean, uncluttered visual signals
- Built-in alert conditions for both high and low breaks
Customizable Inputs:
- Swing Length: Number of bars to calculate swing points
- Minimum Wick Size %: Required wick size as percentage of candle body
- ATR Period: Used for dynamic marker positioning
- ATR Multiplier: Adjusts marker distance from price
Trading Applications:
- Identify potential reversal points
- Spot failed breakouts early
- Recognize price rejection at key levels
- Filter out weak swing levels by focusing on significant wicks
Note: This indicator works best when combined with other forms of analysis and proper risk management.
- Initial release
- Added dynamic scaling for better visibility
- Implemented wick percentage filtering

Scalper Strategy 15M V3This script combines two popular indicators, MACD and RSI, to provide more accurate trading signals. Additionally, it displays Support & Resistance levels based on the last 50 candles, helping traders identify potential price reversal areas.
Intraday & Swing traders looking to optimize their entry & exit points
TradingView users seeking stronger confirmation in trading signals.
Traders who incorporate support & resistance into their strategies.
How to Use:
1. Adjust the MACD & RSI parameters to match your strategy.
2. Use Support & Resistance levels to spot potential price reversals.
3. Watch for Buy/Sell signals appearing on the chart.
Always use proper risk management. No strategy is perfect, so backtest before using it on a live account.

Volume Reversal Arrowsthis indicator look at 3 candel if the first one is red and the third one is green and have more volume then the first one he plot a green arrow and the red arrow when the first candel is green but the third on is red and have more volume

200 Day EMA Slow Ema with uptrend and downtrend signal!
The 200 Exponential Moving Average (EMA) is a widely-used technical indicator in trading. It helps traders identify the overall direction of the market by smoothing out price data over a longer period. The 200 EMA gives more weight to recent prices, making it more responsive to new information compared to a simple moving average.
Identifying Market Trends:
Uptrend: When the price of an asset is consistently above the 200 EMA, it suggests that the market is in an uptrend. Traders often interpret this as a sign of bullish sentiment and may look for buying opportunities.
Downtrend: Conversely, when the price is consistently below the 200 EMA, it indicates a downtrend. This is typically seen as a bearish signal, and traders might consider selling or shorting the asset.
Setting Up Notifications:
To stay informed about these key movements, you can set up notifications on your trading platform to alert you when the price crosses the 200 EMA:
Uptrend Notification: This alert triggers when the price crosses above the 200 EMA, signaling a potential uptrend.
Downtrend Notification: This alert triggers when the price crosses below the 200 EMA, signaling a potential downtrend.
By setting these notifications, you can ensure that you are promptly informed about significant market changes, allowing you to make timely trading decisions without constantly monitoring the charts.

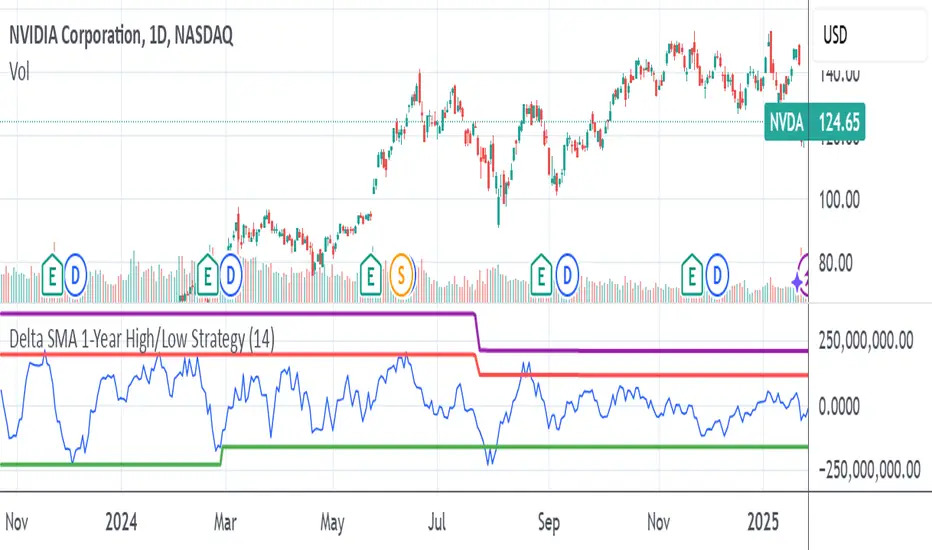
Delta SMA 1-Year High/Low Strategy### Summary:
This Pine Script code implements a trading strategy based on the **Delta SMA (Simple Moving Average)** of buy and sell volumes over a 1-year lookback period. The strategy identifies potential buy and sell signals by analyzing the relationship between the Delta SMA and its historical high/low thresholds. Key features include:
1. **Delta Calculation**:
- The Delta is calculated as the difference between buy volume (when close > open) and sell volume (when close < open).
- A 14-period SMA is applied to the Delta to smooth the data.
2. **1-Year High/Low Thresholds**:
- The strategy calculates the 1-year high and low of the Delta SMA.
- Buy and sell conditions are derived from thresholds set at 70% of the 1-year low and 90% and 50% of the 1-year high, respectively.
3. **Buy Condition**:
- A buy signal is triggered when the Delta SMA crosses above 0 after being below 70% of the 1-year low.
4. **Sell Condition**:
- A sell signal is triggered when the Delta SMA drops below 60% of the 1-year high after crossing above 90% of the 1-year high.
5. **Visualization**:
- The Delta SMA and its thresholds are plotted on the chart for easy monitoring.
- Optional buy/sell signals can be plotted as labels on the chart.
This strategy is designed to capture trends in volume-based momentum over a long-term horizon, making it suitable for swing or position trading.

High-Low Breakout Strategy with ATR traling Stop LossThis script is a TradingView Pine Script strategy that implements a High-Low Breakout Strategy with ATR Trailing Stop.created by SK WEALTH GURU, Here’s a breakdown of its key components:
Features and Functionality
Custom Timeframe and High-Low Detection
Allows users to select a custom timeframe (default: 30 minutes) to detect high and low levels.
Tracks the high and low within a user-specified period (e.g., first 30 minutes of the session).
Draws horizontal lines for high and low, persisting for a specified number of days.
Trade Entry Conditions
Long Entry: If the closing price crosses above the recorded high.
Short Entry: If the closing price crosses below the recorded low.
The user can choose to trade Long, Short, or Both.
ATR-Based Trailing Stop & Risk Management
Uses Average True Range (ATR) with a multiplier (default: 3.5) to determine a dynamic trailing stop-loss.
Trades reset daily, ensuring a fresh start each day.
Trade Execution and Partial Profit Taking
Stop-loss: Default at 1% of entry price.
Partial profit: Books 50% of the position at 3% profit.
Max 2 trades per day: If the first trade hits stop-loss, the strategy allows one re-entry.
Intraday Exit Condition
All positions close at 3:15 PM to ensure no overnight risk.

NVDA - Gaussian Channel Strategy v3.4📌 Strategy Description: Gaussian Channel Trading Strategy for NVDA
Overview
The Gaussian Channel Strategy is a trend-following and momentum-based strategy that combines Gaussian filtering with Stochastic RSI crossovers to detect high-probability entry and exit points. This version is specifically optimized for NVDA stock, ensuring proper execution of orders with backtesting support.
🔹 Key Components
Gaussian Filter (Ehlers' Technique)
A low-lag smoothing filter that removes noise and highlights the primary market trend.
It constructs upper and lower bands to define potential support and resistance levels.
The midline (Gaussian Filter) helps determine bullish vs. bearish conditions.
Stochastic RSI for Entry Signals
Momentum indicator that helps identify overbought and oversold conditions.
Uses %K and %D crossovers to generate buy (bullish) and sell (bearish) signals.
Risk Management with Stop Loss & Take Profit
Stop Loss: Set at 2% below the entry price to limit downside risk.
Take Profit: Set at 5% above the entry price to lock in gains.
Ensures controlled risk-to-reward ratio.
📊 Trading Logic
Buy Entry Condition (Go Long)
Stochastic RSI crossover: %K crosses above %D (bullish momentum).
Gaussian Filter confirms an uptrend (filt > filt ).
Price is trading above the Gaussian Filter (close > filt).
Backtesting range is valid (between 2020 - 2069).
✅ If conditions are met:
→ Enter Long Position (strategy.entry("Long", strategy.long))
Sell Entry Condition (Go Short)
Stochastic RSI crossover: %K crosses below %D (bearish momentum).
Gaussian Filter confirms a downtrend (filt < filt ).
Price is trading below the Gaussian Filter (close < filt).
✅ If conditions are met:
→ Enter Short Position (strategy.entry("Short", strategy.short))
Exit Conditions
Stop Loss triggers when price moves 2% against position.
Take Profit triggers when price moves 5% in favor of the position.
Uses strategy.exit() to automatically manage risk.
🔹 Visual Indicators
✔ Gaussian Filter Midline (Blue): Determines trend direction.
✔ Upper Band (Green): Resistance level for potential reversals.
✔ Lower Band (Red): Support level for possible bounces.
✔ Bar Color Coding:
Green Bars: Price trading above Gaussian Filter (bullish trend).
Red Bars: Price trading below Gaussian Filter (bearish trend).
✔ Buy & Sell Markers (plotshape())
Green ⬆ (Buy Signals)
Red ⬇ (Sell Signals)
📈 Strategy Use Case
Best for trend-following traders who want smooth, noise-free signals.
Ideal for swing traders targeting 2-5% price moves on NVDA.
Reduces false breakouts by requiring both Gaussian trend confirmation and Stochastic RSI crossovers.
Works well on high-liquidity stocks like NVDA, especially in volatile conditions.
🚀 Summary
✅ Combines trend detection (Gaussian Filter) with momentum confirmation (Stochastic RSI).
✅ Automated buy/sell execution with visual confirmations.
✅ Risk-controlled strategy with Stop Loss (2%) and Take Profit (5%).
✅ Optimized for NVDA stock, with proper execution & capital allocation.

Green & Red Candle SignalThis is a simple entry technique for entry and exit signals. Whenever the candle goes GREEN from WHITE, you can enter the trade on long sideanywhere in between the GREEN candle, keeping STOP below prior lowest WHITE. Trail you profits. Similarly when the candle goes RED from WHITE, you can enter the trade on short side anywhere in between the RED candle, keeping STOP above prior highest WHITE

KARRY ETH 5HStrategy Overview:
This Ethereum trading system combines trend-following and breakout logic with volatility adaptation:
Core Logic
Buy Signals: Trigger when:
Price breaks above upper channel (bullish breakout)
Supertrend confirms bullish trend (green)
Price stays above 20-period EMA (trend filter)
RSI < 65 (avoids chasing overbought moves)
Sell Signals: Activate when:
Price breaks below lower channel (bearish breakdown)
Supertrend confirms bearish trend (red)
Price holds below 20-period EMA
RSI > 35 (avoids panic-selling oversold conditions)
Key Features
⏰ 5-hour cooldown between signals to prevent overtrading
📊 Uses Supertrend (volatility) + EMA (trend) + RSI (momentum) confluence
🎯 Self-adjusting via dynamic price channels and trend confirmation
⚖️ Balances aggression (breakouts) with caution (RSI filters)
Ideal for swing trading ETH across all market conditions, emphasizing disciplined entries while respecting volatility.

Ultimate Stochastics Strategy by NHBprod Use to Day Trade BTCHey All!
Here's a new script I worked on that's super simple but at the same time useful. Check out the backtest results. The backtest results include slippage and fees/commission, and is still quite profitable. Obviously the profitability magnitude depends on how much capital you begin with, and how much the user utilizes per order, but in any event it seems to be profitable according to backtests.
This is different because it allows you full functionality over the stochastics calculations which is designed for random datasets. This script allows you to:
Designate ANY period of time to analyze and study
Choose between Long trading, short trading, and Long & Short trading
It allows you to enter trades based on the stochastics calculations
It allows you to EXIT trades using the stochastics calculations or take profit, or stop loss, Or any combination of those, which is nice because then the user can see how one variable effects the overall performance.
As for the actual stochastics formula, you get control, and get to SEE the plot lines for slow K, slow D, and fast K, which is usually not considered.
You also get the chance to modify the smoothing method, which has not been done with regular stochastics indicators. You get to choose the standard simple moving average (SMA) method, but I also allow you to choose other MA's such as the HMA and WMA.
Lastly, the user gets the option of using a custom trade extender, which essentially allows a buy or sell signal to exist for X amount of candles after the initial signal. For example, you can use "max bars since signal" to 1, and this will allow the indicator to produce an extra sequential buy signal when a buy signal is generated. This can be useful because it is possible that you use a small take profit (TP) and quickly exit a profitable trade. With the max bars since signal variable, you're able to reenter on the next candle and allow for another opportunity.
Let me know if you have any questions! Please take a look at the performance report and let me know your thoughts! :)
