The post PRTG Integration Guide (Legacy Email Version) – Splunk On-Call appeared first on Knowledge Base.
]]>Versions Supported: N/A (SaaS)
VictorOps Version Required: Starter, Growth, or Enterprise
What you need to know: To ensure incidents are resolved correctly, choose static fields for the Critical and Resolved subject lines.
PRTG is a highly flexible and generic software for monitoring IT infrastructure. The following documentation will walk you through how to send PRTG “Notifications” to the Splunk On-Call timeline by leveraging our Generic Email Endpoint.
In Splunk On-Call
In VictorOps, select Integrations >> PRTG
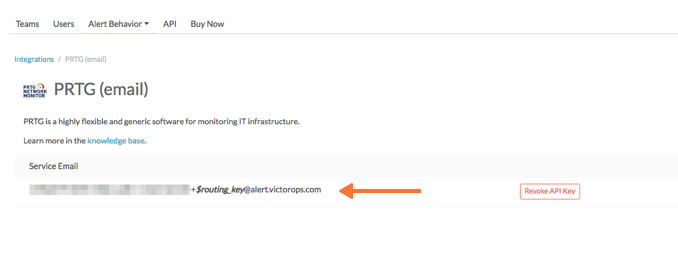
If the integration has not yet been enabled, click the “Enable Integration” button to generate your endpoint URL as seen below. Be sure to replace the “$routing_key” section with the actual routing key you intend to use. (To view or configure route keys in Splunk On-Call, click Settings >> Routing Keys)
In PRTG
- From the main dashboard select Setup >> Account Settings >> Notifications.
- Select Add new notification.
- Give the notification a name make sure the status is set to Started. Under NOTIFICATION SUMMARIZATION set the Method to Always notify ASAP.
To create an incident:
Select the checkbox for SEND EMAIL. This will expand the email settings. Paste your Splunk On-Call email endpoint address into the Send to Email Address field. Use the following text as the subject line:
[%sitename] %device %name CRITICAL
To resolve an incident:
If you would like PRTG to send a recovery email to close the incident in Splunk On-Call when a monitored device recovers, you will need to create a separate notification, with another email that uses this text as the subject:
[%sitename] %device %name RECOVERY
- Set the Format field to Text, then select Save.
- To test the integration return to the NOTIFICATIONS settings page, find your newly created Splunk On-Call notification method and select Test. This will trigger an incident in your Splunk On-Call timeline, and the integration is complete!
The post PRTG Integration Guide (Legacy Email Version) – Splunk On-Call appeared first on Knowledge Base.
]]>The post AppDynamics Integration Guide – Splunk On-Call appeared first on Knowledge Base.
]]>Versions Supported: On Premise and SaaS versions
VictorOps Version Required: Starter, Growth, or Enterprise
AppDynamics focuses on managing the performance and availability of applications across cloud computing environments as well as inside the data center.
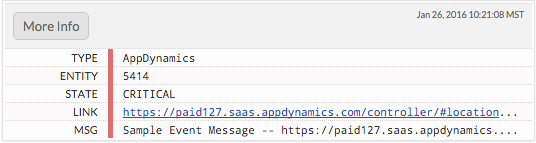
The AppDynamics integration with Splunk On-Call allows AppDynamic users to utilize Splunk On-Call as an “Alerting Extension” within AppDynamics. The “Alerting Extension” enables AppDynamics to post events and custom alerts into the Splunk On-Call Timeline. The payload of the alert includes valuable information related to the alert including a link to AppDynamics for a thorough diagnosis of the event.
On Premise Version
In Splunk On-Call
Navigate to the AppDynamics integration page by visiting Integrations >> AppDynamics.
If the integration has not yet been enabled, click the Enable Integration button. Copy the “Service API Key” to your clipboard.

In AppDynamics
- Download the VictorOps Alerting Extension zip from [AppDynamics Exchange]
- Unzip the victorops-alert.zip file into <CONTROLLER_HOME_DIR>/custom/actions/ . You should have <CONTROLLER_HOME_DIR>/custom/actions/victorops-alert created.
- Check if you have custom.xml file in <CONTROLLER_HOME_DIR>/custom/actions/ directory. If yes, add the following xml to the <custom-actions> element
        victorops-alert

        victorops-alert.sh
If you don’t have custom.xml already, create one with the below xml content:
<custom-actions>victorops-alert victorops-alert.sh - Update the config.yaml file in <CONTROLLER_HOME_DIR>/custom/actions/victorops-alert
#VictorOps Org Key
voOrganizationKey: "YOUR_SERVICE_API_KEY_HERE"

#VictorOps Routing Key
voRoutingKey: "YOUR_ROUTING_KEY_HERE"

#scheme used (http/https)
protocol: "https"

#VictorOps host
voAlertHost: "alert.victorops.com"

#VictorOps url path
voAlertUrlPath: "/integrations/generic/20131114/alert"

#http timeouts
connectTimeout: 10000
socketTimeout: 10000

#control level of details in VO alert
showDetails: false
- Installing Custom Actions:
To create a Custom Action, first refer to the following topics in the AppDynamics docs:Now you are ready to use this extension as a custom action. In the AppDynamics UI, go to Alert & Respond ⇨ Actions. Click Create Action. Select Custom Action and click OK. In the drop-down menu, you can find the action called ‘victorops-alert’.
SaaS Version
AppDynamics gives you real-time insight from your apps using Application Performance Management–how they’re being used, how they’re performing, where they need help. The following guide will walk you through the Splunk On-Call integration with the AppDynamics SaaS-based model, if you are using the hosted solution please see the documentation here: AppDynamics Integration.
In Splunk On-Call
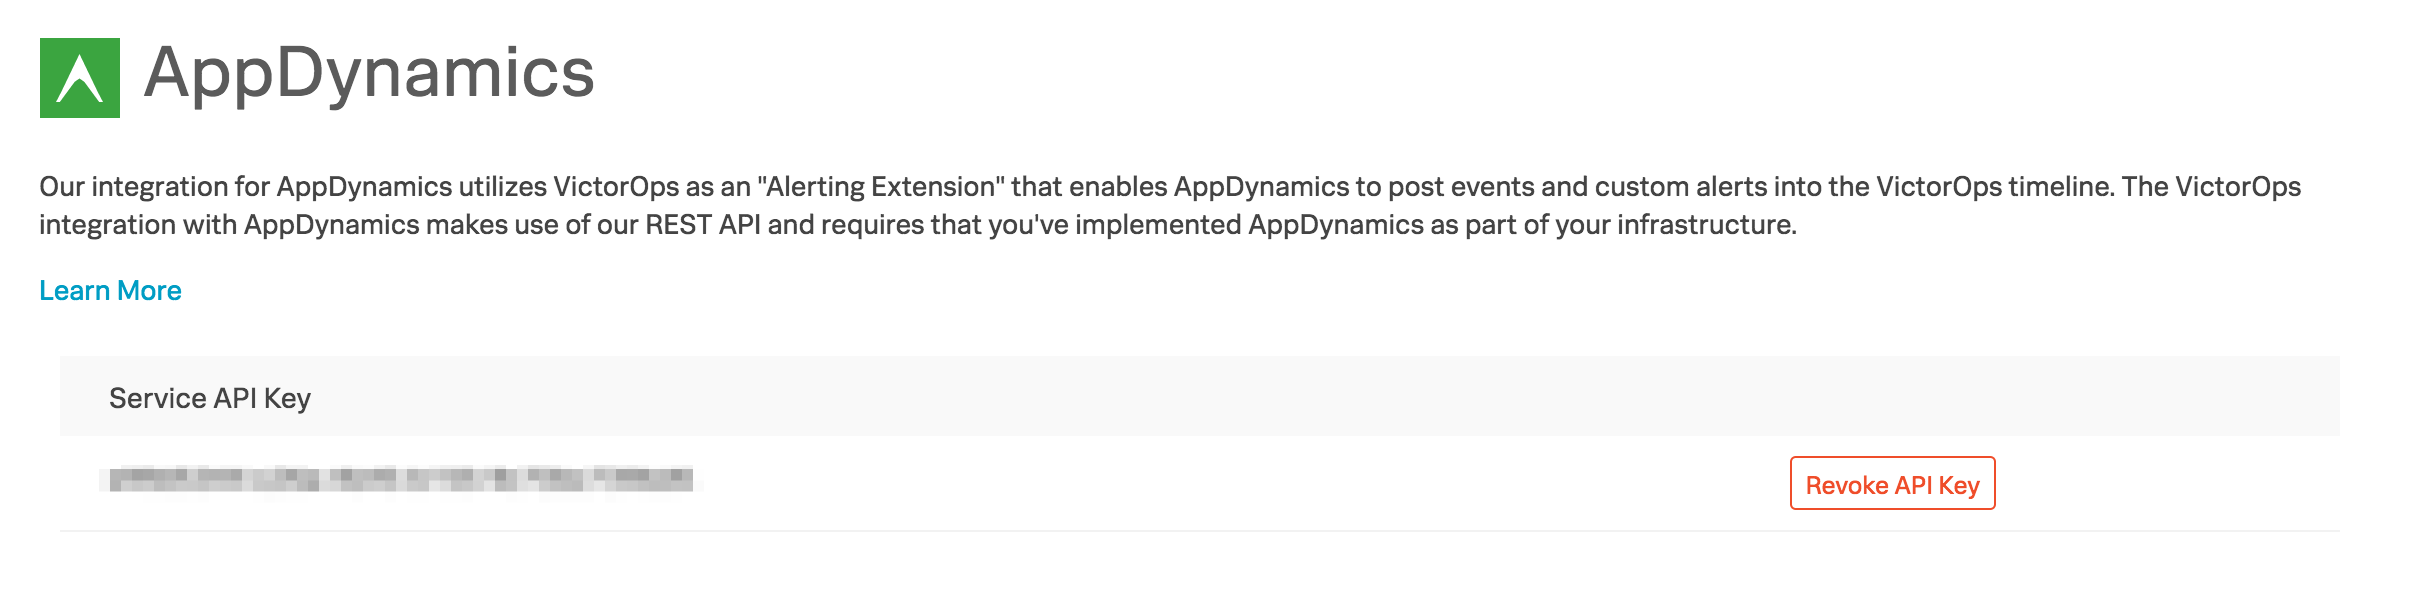
Navigate to the AppDynamics integration page by visiting Integrations >> AppDynamics.
If the integration has not yet been enabled, click the Enable Integration button. Copy the Service API Key to your clipboard.
In AppDynamics
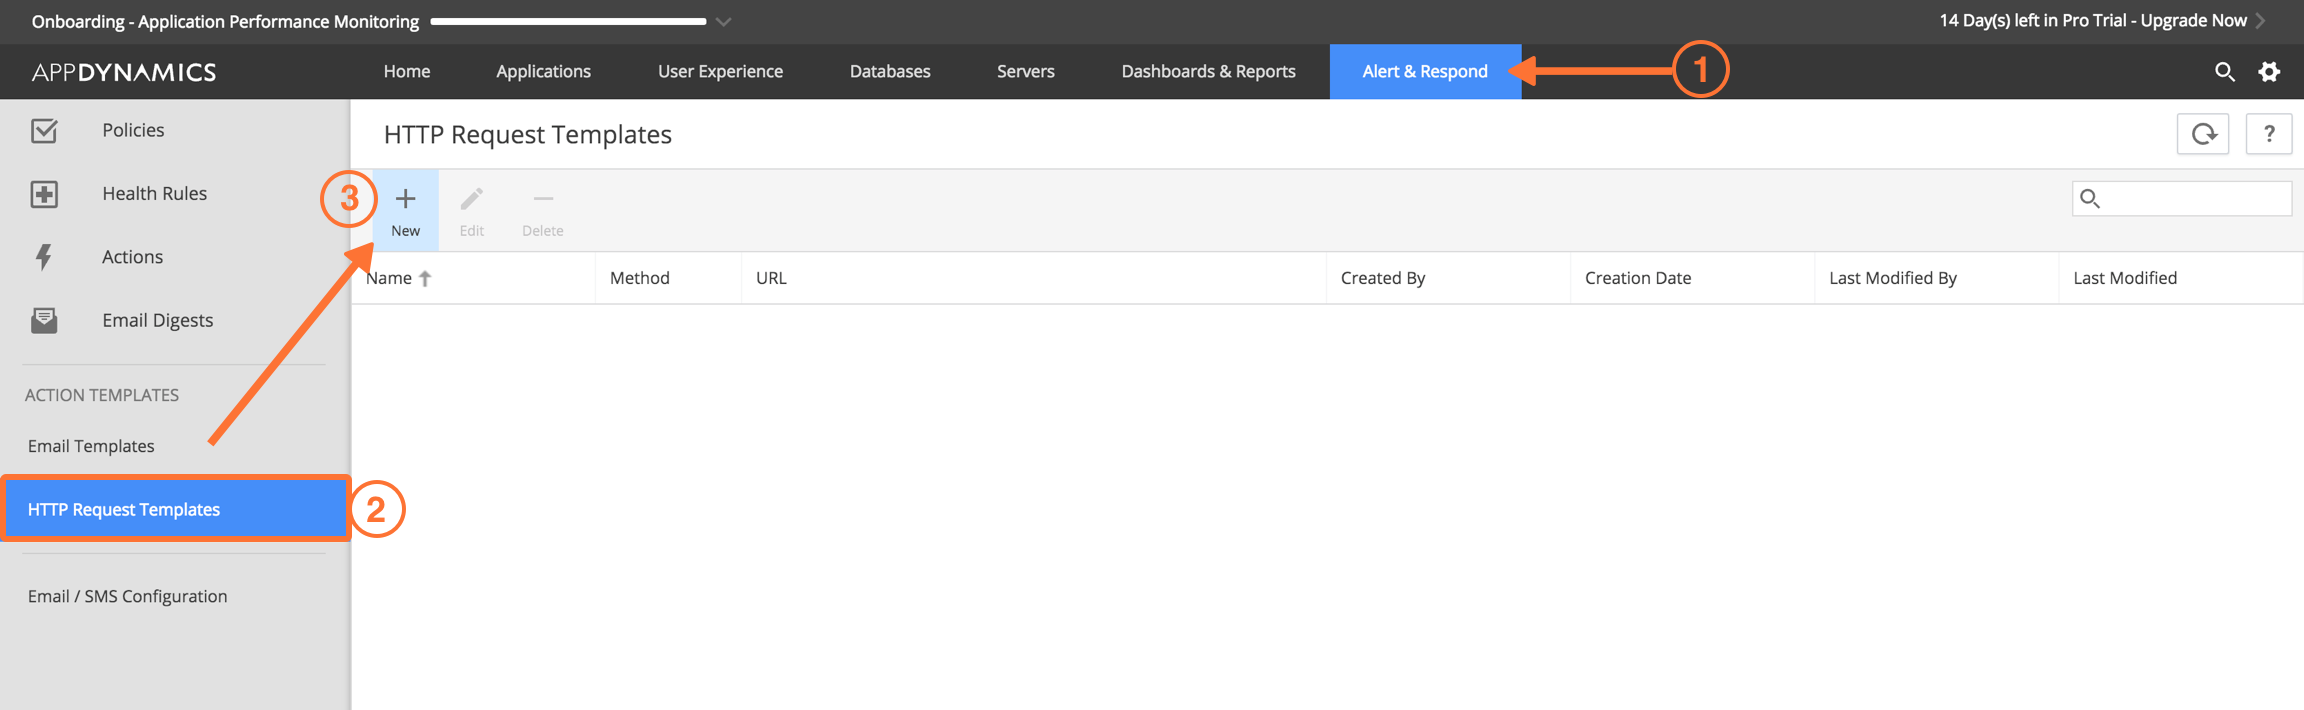
From the main web portal select Alert & Respond then HTTP Request Templates and then New.
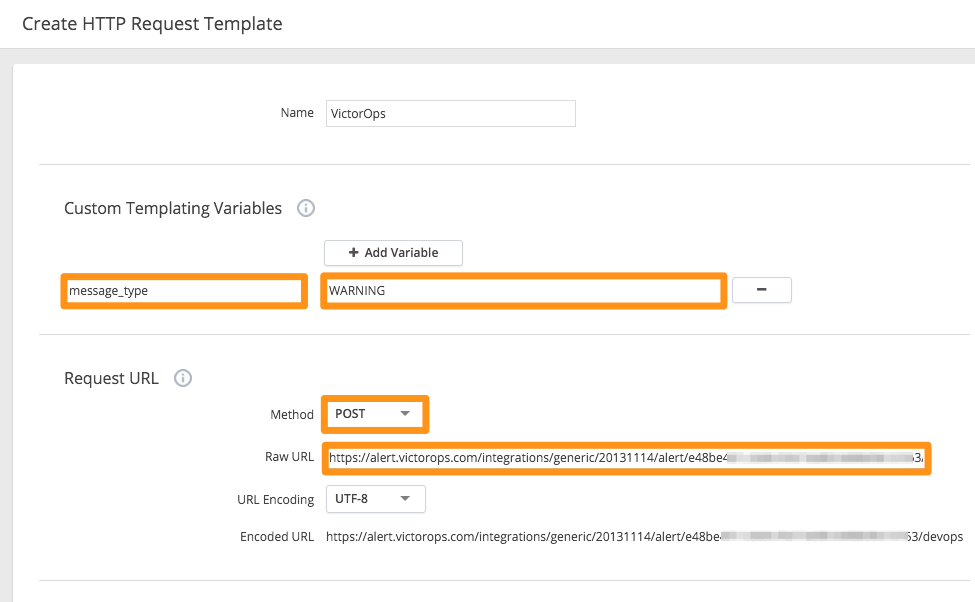
Give the Template a name (Splunk On-Call Test in below example).
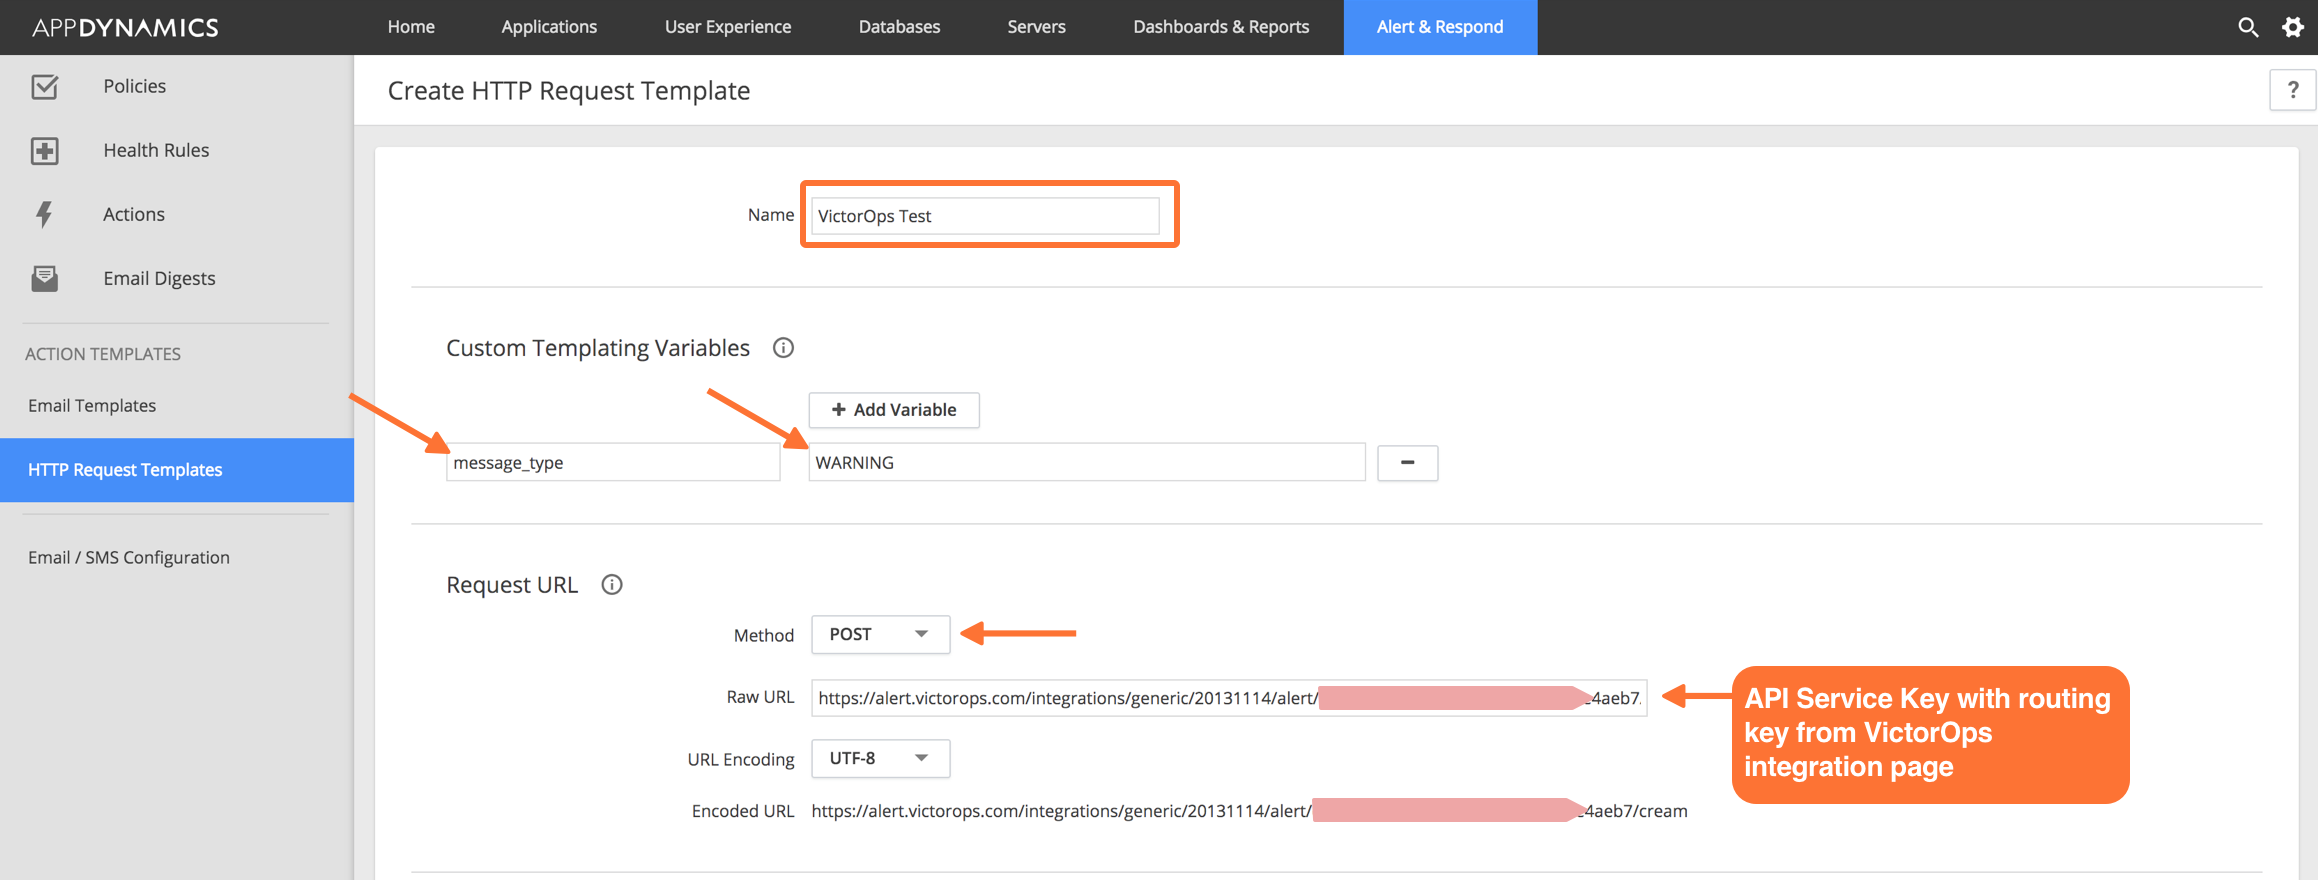
Set a Custom Templating Variable with a field name of message_type and a value of WARNING.
Under Request URL set the Method to POST.
Paste in your Splunk On-Call Service API Key into the box labeled Raw URL using the following format: https://alert.victorops.com/integrations/generic/20131114/alert/YOUR_SERVICE_API_KEY_HERE/YOUR_ROUTING_KEY_HERE
Example: (Assuming a routing_key value of “app-monitoring”) https://alert.victorops.com/integrations/generic/20131114/alert/<api-key-here>/app-monitoring
No custom headers are required.
Under Payload select the MIME Type of application/json.
Paste the following payload into the box in AppDynamics:
#foreach(${eventList} in ${fullEventsByTypeMap.values()})

  #foreach(${event} in ${eventList})

    #if ($event.eventType == "POLICY_OPEN_CRITICAL")

          #set ( $message_type = "CRITICAL" )

    #elseif ($event.eventType == "POLICY_UPGRADED")

          #set ( $message_type = "CRITICAL" )

    #elseif ($event.eventType == "ERROR")

          #set ( $message_type = "CRITICAL" )

    #elseif ($event.eventType == "APPLICATION_ERROR")

          #set ( $message_type = "CRITICAL" )

    #elseif ($event.eventType == "POLICY_CLOSE_WARNING")

          #set ( $message_type = "RECOVERY" )

    #elseif ($event.eventType == "POLICY_CLOSE_CRITICAL")

         #set ( $message_type = "RECOVERY" )

    #elseif ($event.eventType == "POLICY_CANCELED_CRITICAL")

         #set ( $message_type = "RECOVERY" )

    #else

          #set ( $message_type = "WARNING" )

    #end

{

    "message_type":"${message_type}",

    "entity_id":"${latestEvent.incident.id}",

    "state_message":"${event.eventMessage}",

    "alert_url":"${event.deepLink}",

    "ad_event_type":"${event.eventType}",

    "monitoring_tool":"AppDynamics"

}

  #end

#end
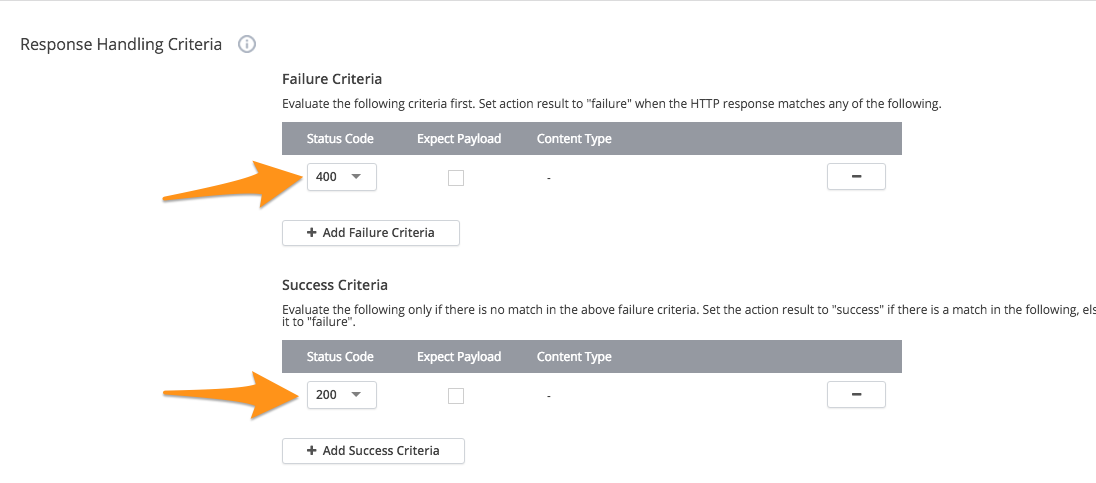
Under Response Handling Criteria set the Failure Criteria status code to 400 and the Success Criteria status code to 200.
Make sure to uncheck the box for Expected Payload for both items.
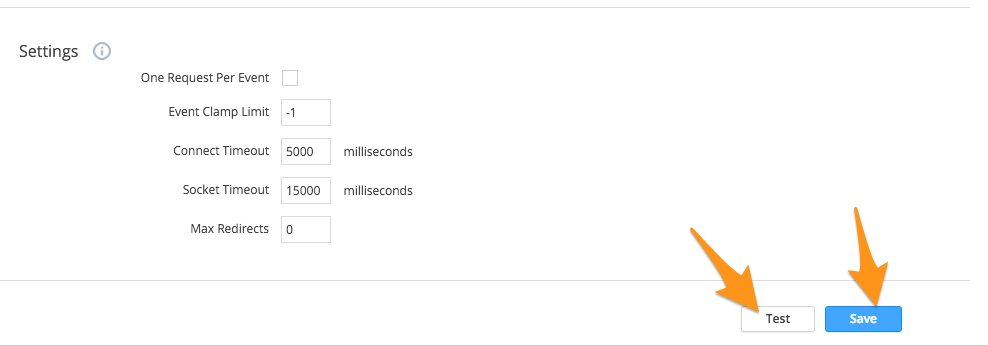
At the bottom of the page, make any changes to the settings you would like and then select Save and Test.
When testing, add an Event Type Trigger with a count of 1 and hit Run Test.
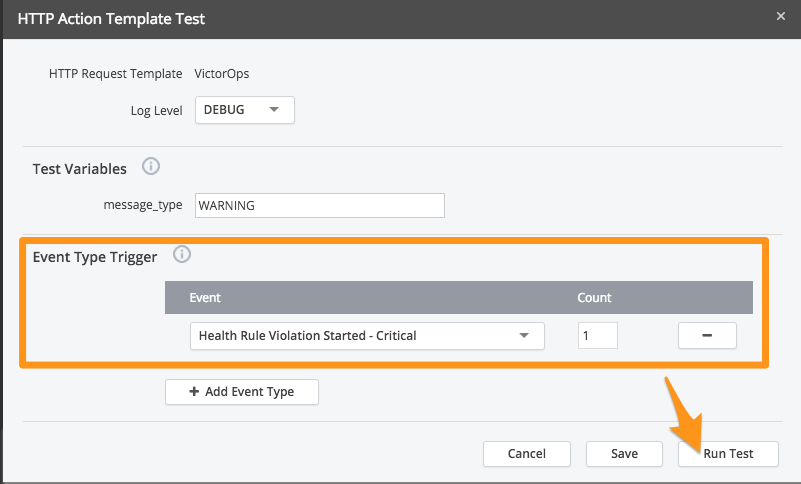
Check your VictorOps timeline to make sure you get the associated alert.
You can now use the VictorOps HTTP Request Template with any of your alerts in AppDynamics. If you have any questions please contact us at support.
The post AppDynamics Integration Guide – Splunk On-Call appeared first on Knowledge Base.
]]>The post Atatus Integration Guide – Splunk On-Call appeared first on Knowledge Base.
]]>Versions Supported: All
VictorOps Version Required: Starter, Growth, or Enterprise
What you need to know: Annotating the links provided by Atatus to your alerts requires use of the Alert Rules Engine (Enterprise only feature)
Atatus is an application performance management and error tracking solution that captures performance metrics and errors from your servers, frontend environment, and mobile applications.
In Splunk On-Call
From the main timeline select Integrations >> Atatus.
If the integration has not yet been enabled, click the “Enable Integration” button. Copy the “Service API Key” to your clipboard.

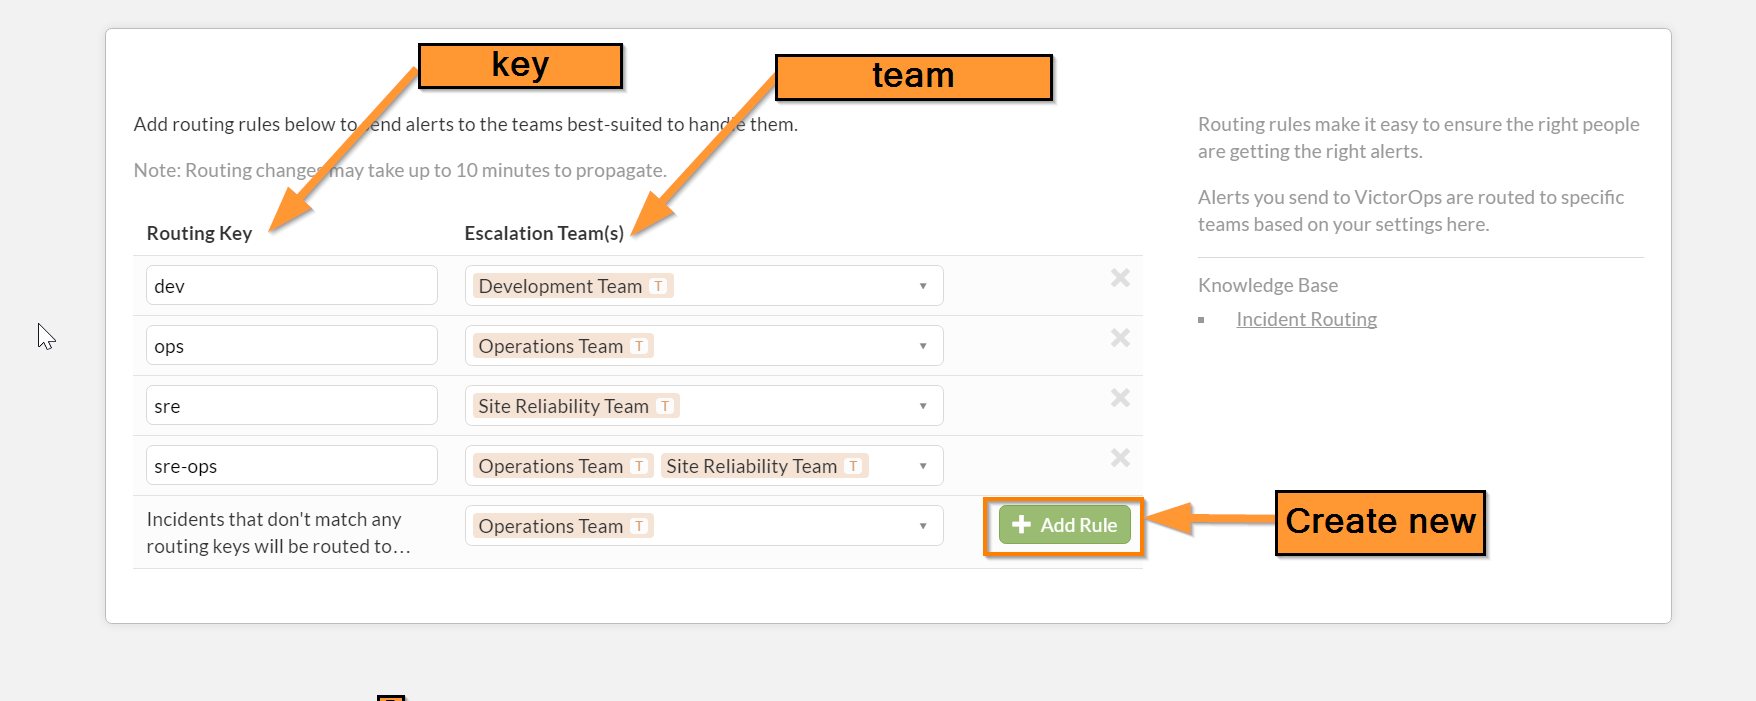
2. Once you have copied the API key to your clipboard, click on Settings >> Routing Keys page to find your routing key configuration. Decide which routing_key will be used with this integration and make sure it is associated to the correct team/s. (You may need to create a new key) Routing keys are case sensitive.
In Atatus
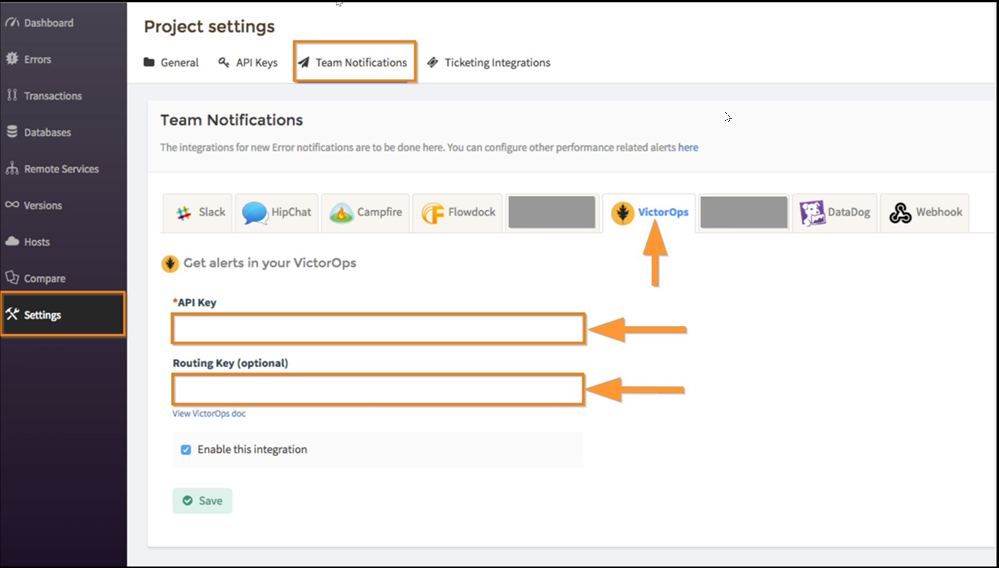
1. Navigate to Project Settings>>Team Notifications and choose the “VictorOps” tab. Paste your API key and routing_key from Splunk On-Call, check the box for “Enable this integration” then click “Save”.
Alert Rules Engine: Annotate the Links to Atatus Alerts
Using the Alert Rules Engine to annotate the links sent by Atatus will make those links more visible and clickable for users viewing the incidents in VictorOps, which saves you time when seconds matter.
1. In VictorOps, navigate to Settings >> Alert Rules Engine and select “Add a rule”
2. Configure the Alert Rules Engine rule as follows then click “Save”:
– When monitoring_tool matches Atatus
– Annotate alert with:
– URL >> “Error Details” >> ${{details.errorUrl}}
![]()
Test the Integration
1. From the VictorOps integration settings page in Atatus, click on “Send test message”
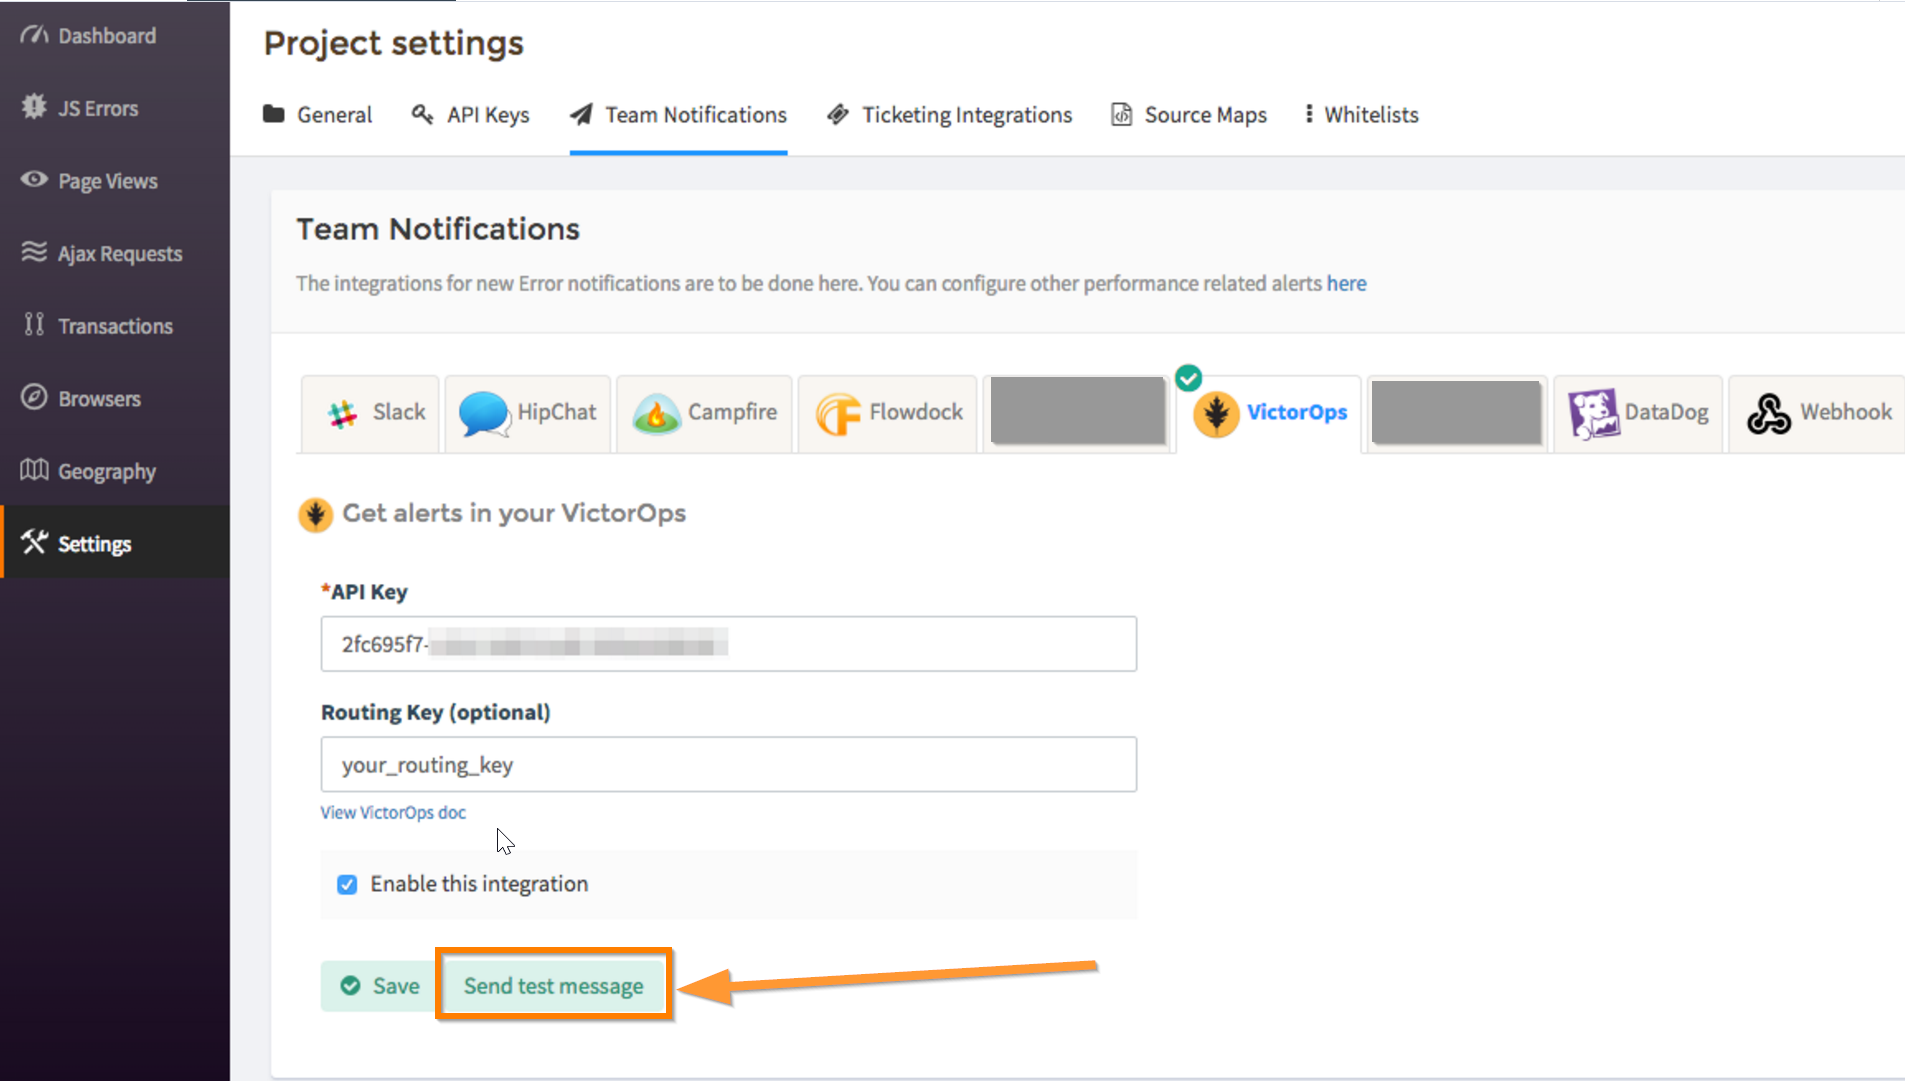
2. Check your Splunk On-Call timeline to make sure an event is registered from Atatus.
The post Atatus Integration Guide – Splunk On-Call appeared first on Knowledge Base.
]]>The post BMC TrueSight Pulse Integration (Boundary) Guide – VictorOps appeared first on Knowledge Base.
]]>Versions Supported: N/A (SaaS)
VictorOps Version Required: Starter, Growth, or Enterprise
BMC TrueSight Pulse (formerly Boundary) is a one stop shop for all of your metrics. It provides easy-to-use alarms, which will be triggered when the monitored metric goes above (or below) the defined threshold. Each alarm can be connected to one or more “Actions”, so users can be notified when an alarm status changes.
BMC TrueSight Pulse users can now send their alerts to Splunk On-Call using an “Action”. The following steps walk through the implementation process.
In Splunk On-Call
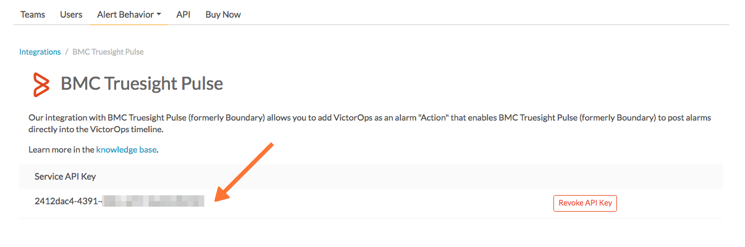
From the main timeline select Integrations >> BMC Truesight Pulse.
If the integration has not yet been enabled, click the “Enable Integration” button. Copy the “Service API Key” to your clipboard.
In BMC Truesight Pulse
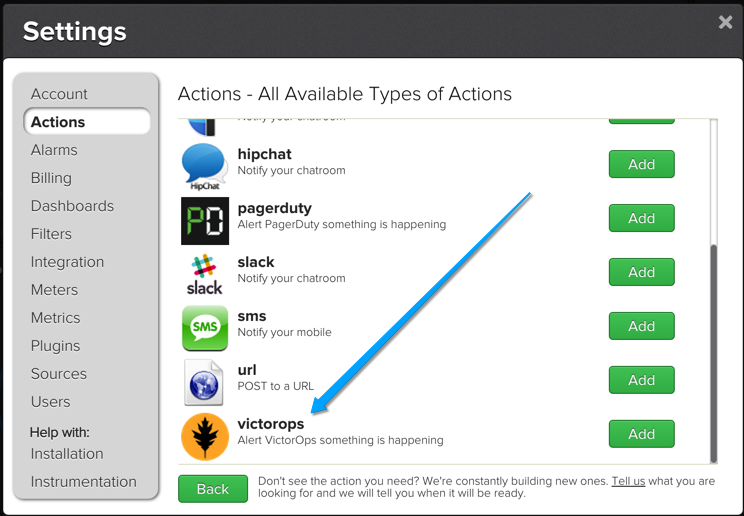
First, add the Splunk On-Call “Action” to your BMC Truesight Pulse account. Click “Settings” on left toolbar to open the dialog and go to Actions tab. Click on the “Add Action” button and select “VictorOps” on the next screen and click “Add”.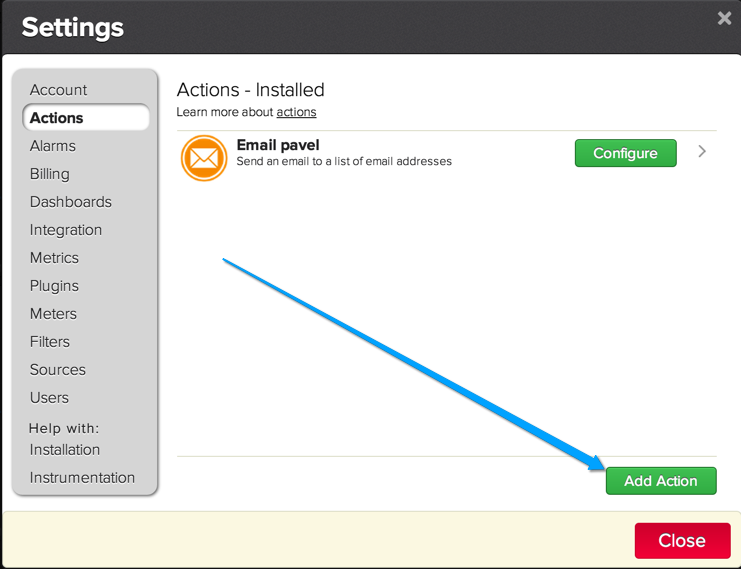
Give the “Action” a name, paste in your API key, select the severity level and add your Routing Key. Now hit save and you are done setting up the VictorOps “Action”.
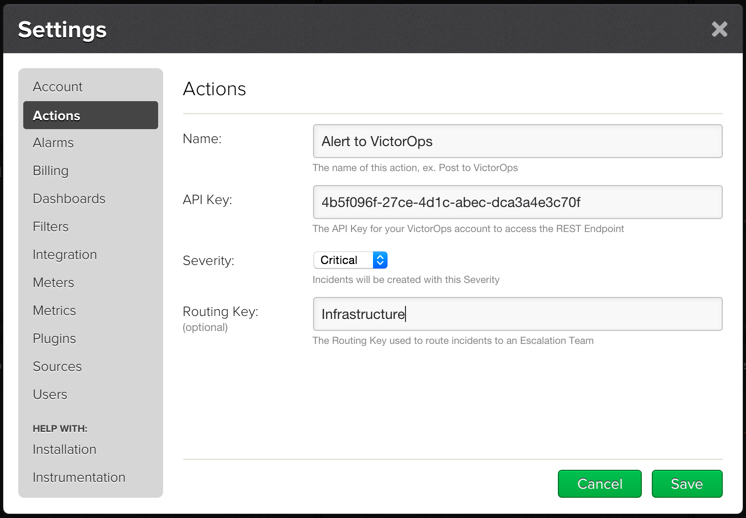
Now you can use the VictorOps action with any of your BMC Truesight Pulse Alarms.
The post BMC TrueSight Pulse Integration (Boundary) Guide – VictorOps appeared first on Knowledge Base.
]]>The post Bugsnag Integration Guide – VictorOps appeared first on Knowledge Base.
]]>Versions Supported: N/A (SaaS)
VictorOps Version Required: Starter, Growth, or Enterprise
Bugsnag’s cross platform error monitoring automatically detects crashes in your applications, letting you ship with confidence.
The following will guide you through the steps needed to send you bugsnag “Team Notifications” into the Splunk On-Call timeline.
In Splunk On-Call
From the main timeline select Integrations >> BugSnag
If the integration has not yet been enabled, click the “Enable Integration” button. Copy the “Service API Key” to your clipboard.
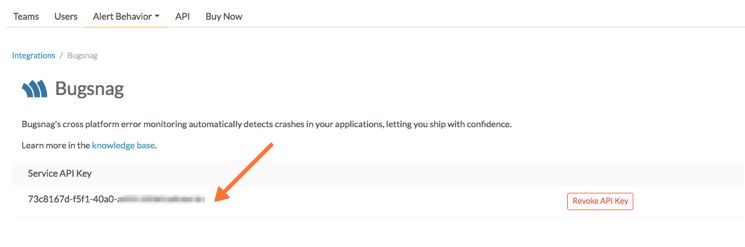
Once you have copied the API key to your clipboard, click on Settings >> Routing Keys page to find your routing key configuration. Decide which routing_key will be used with this integration and make sure it is associated to the correct team/s. (You may need to create a new key) Routing keys are case sensitive.
In Bugsnag
From the main web client, go into Settings.
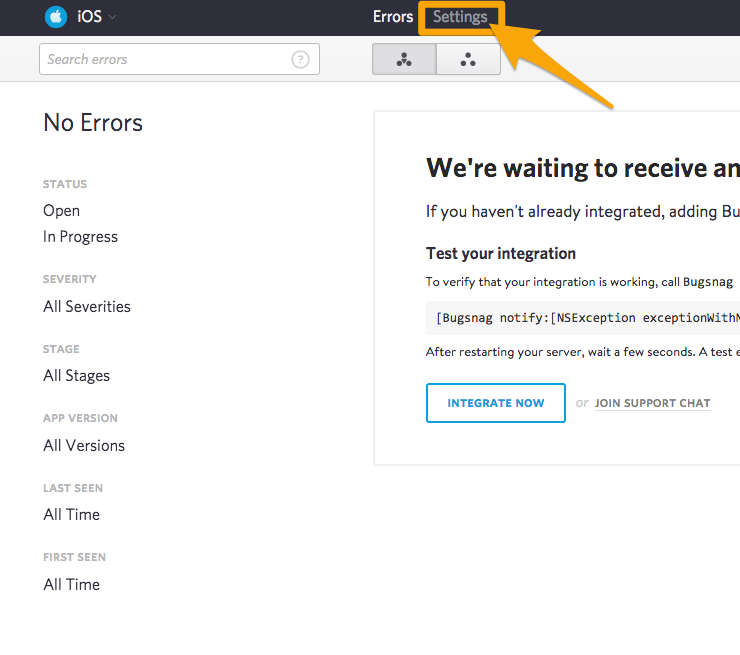
In settings, select Team Notifications and then VictorOps.
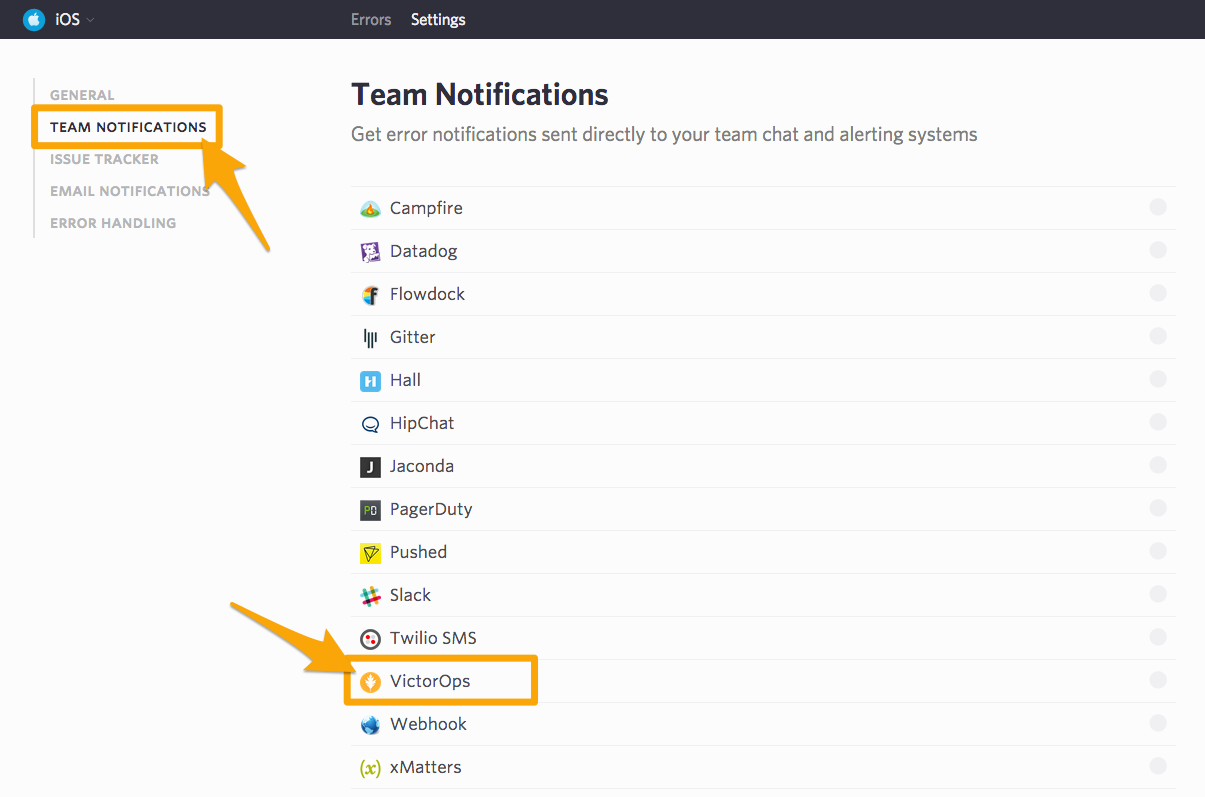
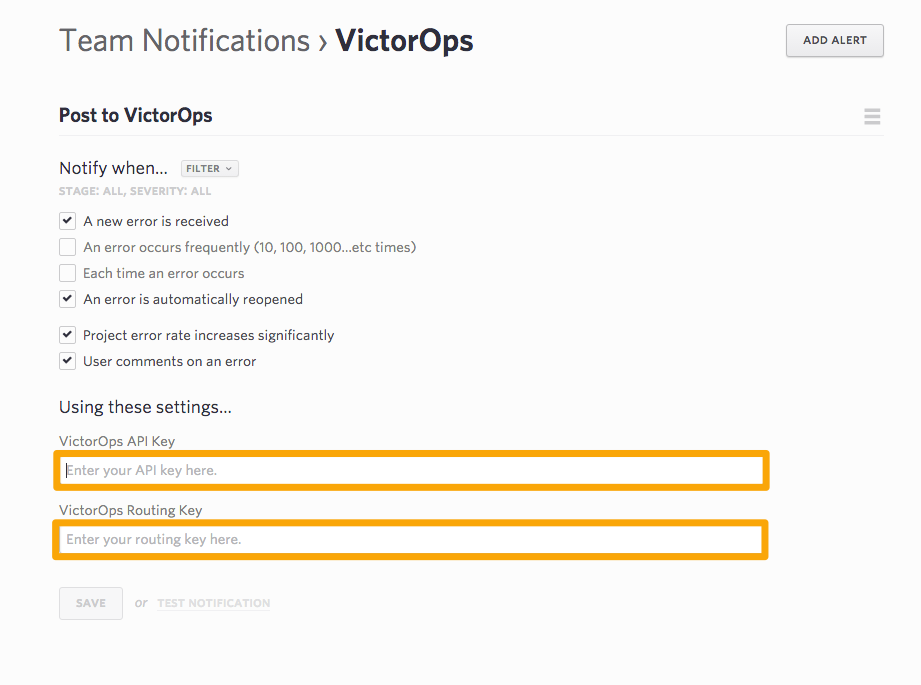
Setup the alert to notify based on the options provided, and then drop in your “VictorOps API Key” and the appropriate Routing key. Hit save and you are done!
The post Bugsnag Integration Guide – VictorOps appeared first on Knowledge Base.
]]>The post Cabot Integration Guide – VictorOps appeared first on Knowledge Base.
]]>Note: this is not an officially supported 3rd party integration. Results may vary.
The post Cabot Integration Guide – VictorOps appeared first on Knowledge Base.
]]>The post Catchpoint Integration Guide – VictorOps appeared first on Knowledge Base.
]]>Versions Supported: N/A (SaaS)
VictorOps Version Required: Starter, Growth, or Enterprise
What you need to know: If you would like to customize the alert payload, refer to this article for more information on formatting.
Catchpoint delivers world-class Web Performance Monitoring for all Internet services: Website, Mobile, App, Ads, API, DNS, CDN, Streaming, Cloud, & more.
The following will walk you through the steps needed to integrate Catchpoint with Splunk On-Call.
In Splunk On-Call
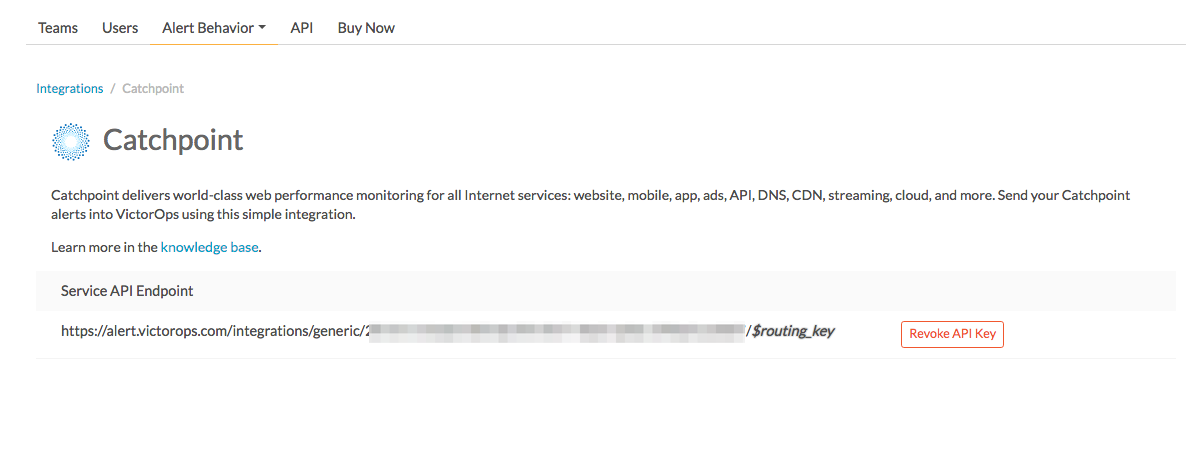
In VictorOps, select Integrations >> Catchpoint
If the integration has not yet been enabled, click the “Enable Integration” button to generate your endpoint URL as seen below. Be sure to replace the “$routing_key” section with the actual routing key you intend to use. (To view or configure route keys in Splunk On-Call, click Settings>> Routing Keys)
In Catchpoint
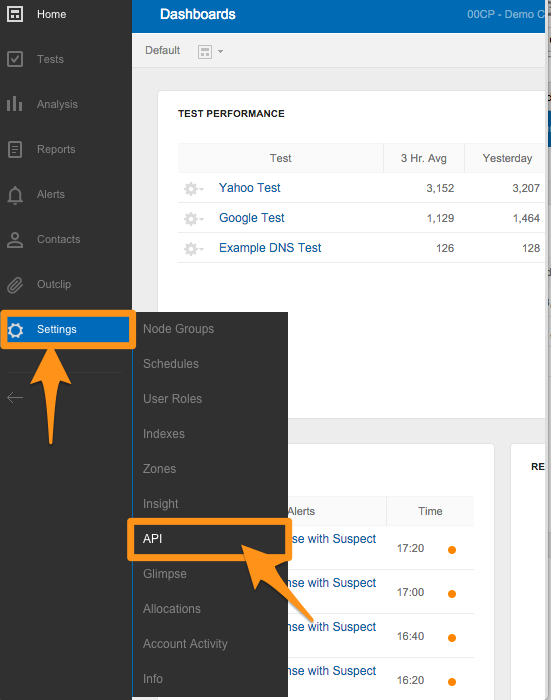
1) Navigate to Settings >> API.
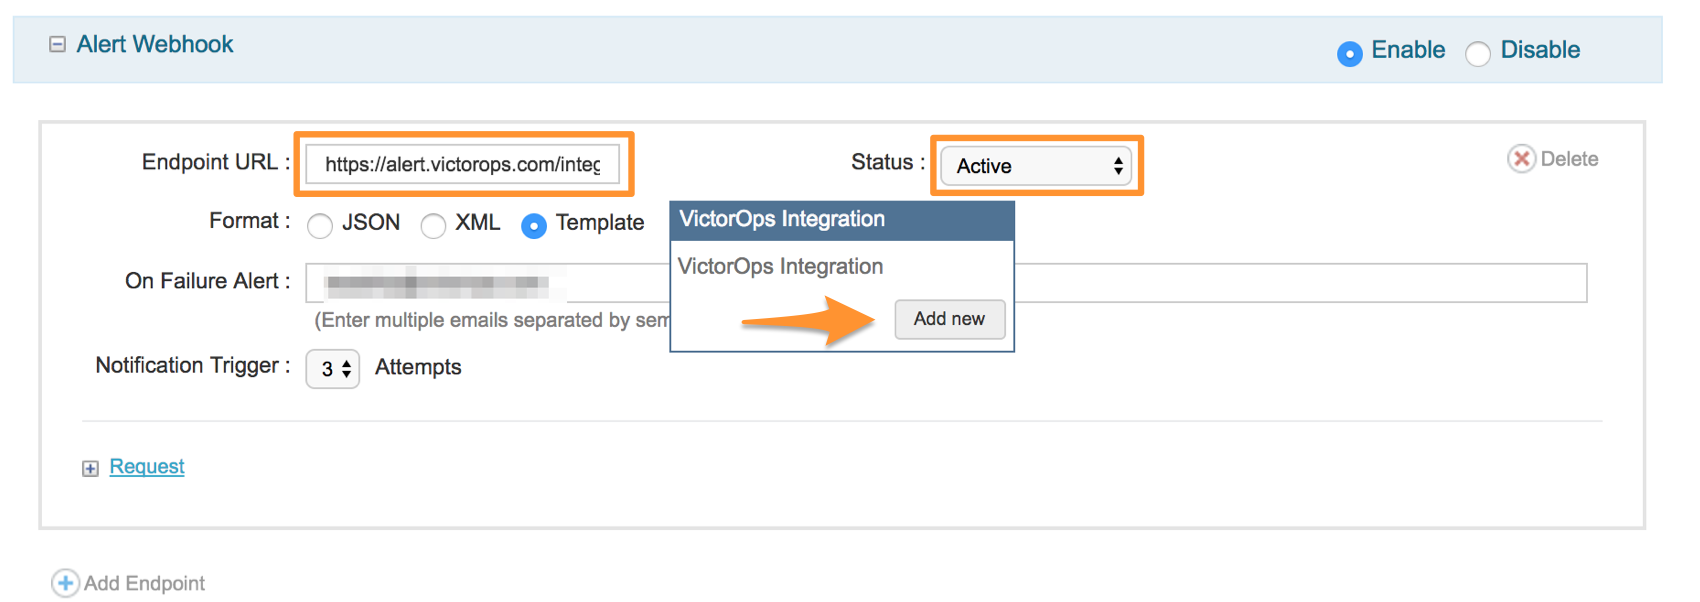
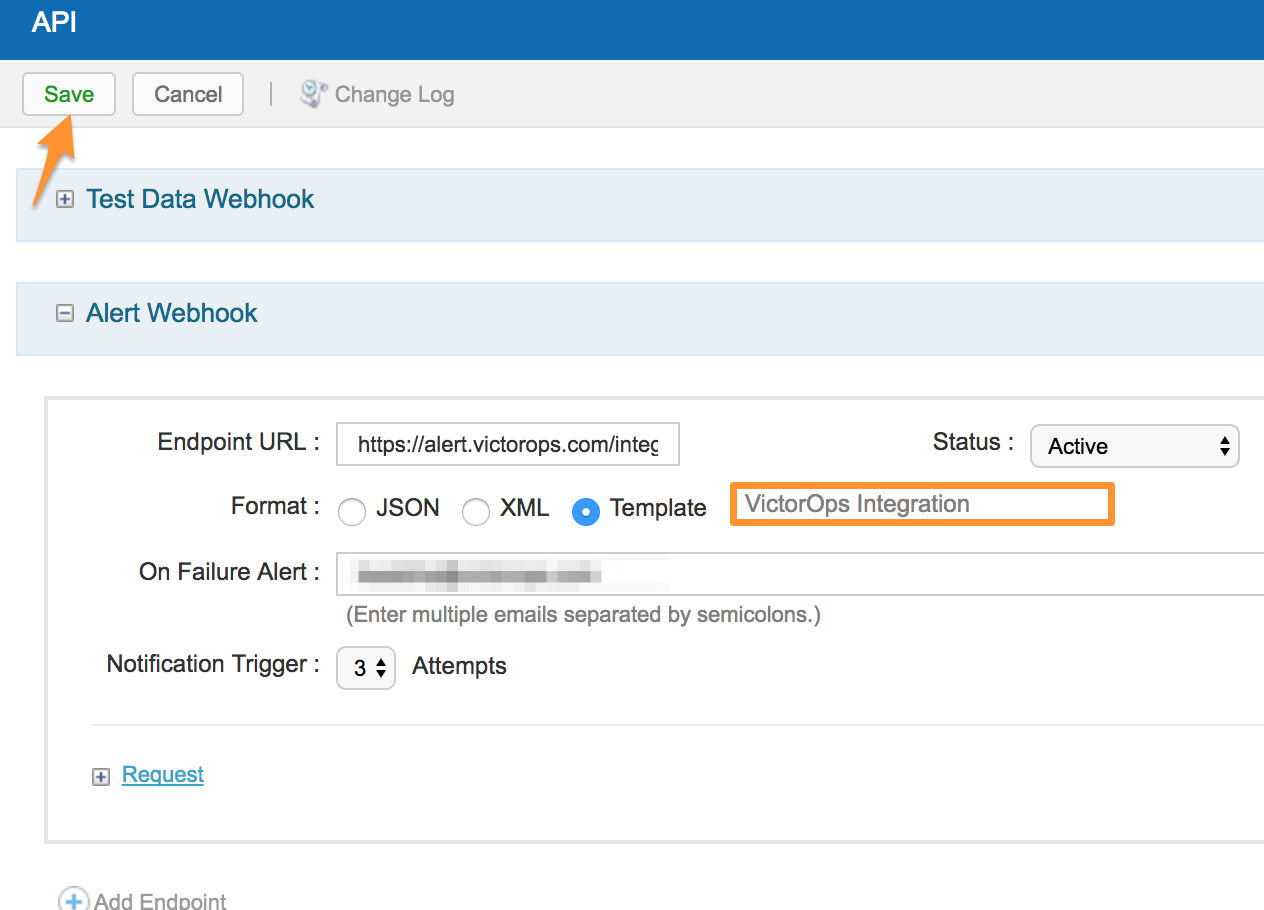
2) Under Alert Webhook set the status to Active, Paste in your “API URL” that you got in Splunk On-Call.
3) Select Template and then Add new
4) Give it a name (“VictorOps Integration” for example) and then set the Format to JSON
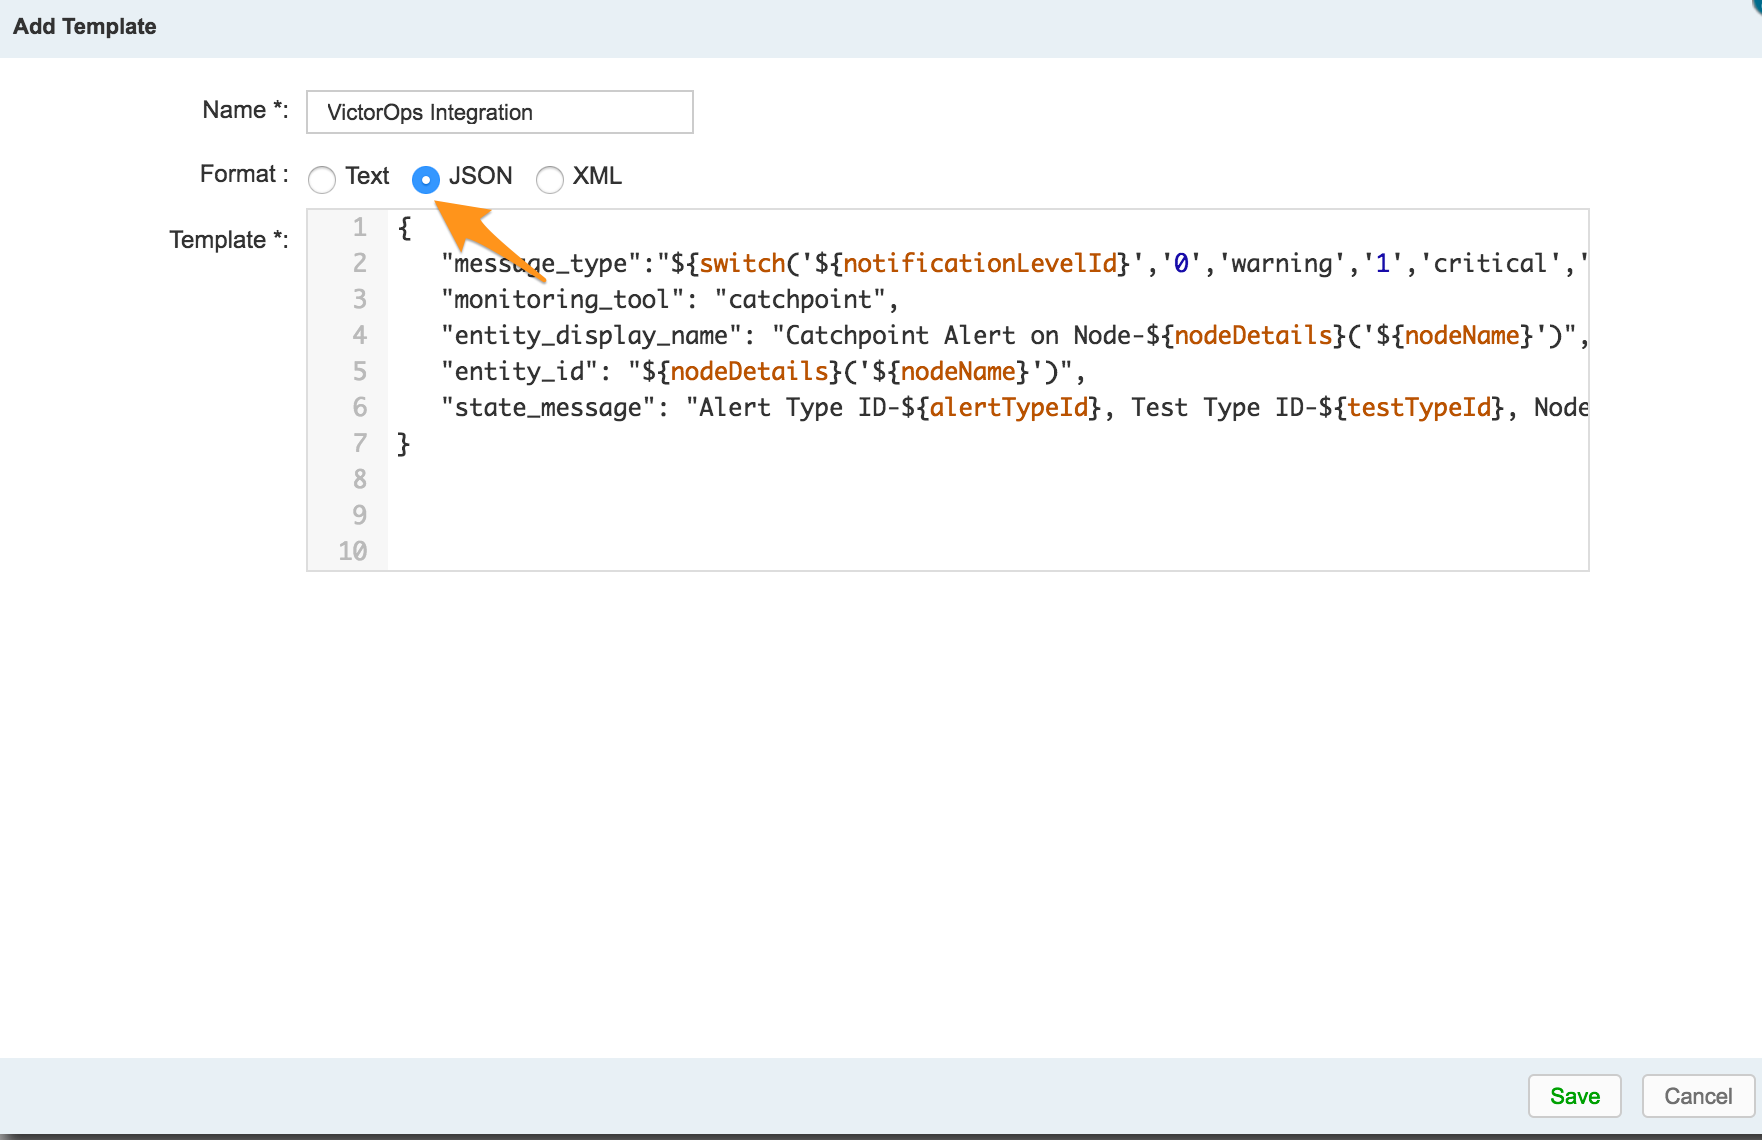
5) Paste the following code in the Template section:
{
   "message_type":"${switch('${notificationLevelId}','0','warning','1','critical','2','recovery','3','recovery')}",
   "monitoring_tool": "Catchpoint",
   "entity_display_name": "Catchpoint Alert for ${testName} on node ${nodeDetails(${nodeName})}",
   "entity_id": "${testId}_${AlertInitialTriggerDateUtcEpoch}",
   "state_message": "Alert Type ID-${alertTypeId}, Test Type ID-${testTypeId}, Node-${nodeDetails('${nodeName}')}, Product- ${productId}, Test_url-${testUrl}"
}
6) Select your newly created template, hit Save, and you’re done!
Also, if you’re looking for additional variables to add to your payload, please seek out the Alert Webhook Macros in the support section of the Catchpoint platform. Please note, you may add as many variables as you want, but customizing the parameters of the existing Template may result in degraded functionality.
The post Catchpoint Integration Guide – VictorOps appeared first on Knowledge Base.
]]>The post Checkmk Integration Guide – VictorOps appeared first on Knowledge Base.
]]>Versions Supported: Checkmk Raw, Checkmk Enterprise
VictorOps Version Required: Starter, Growth, or Enterprise
What you need to know: The Splunk On-Call plugin for CheckMK is only compatible with the legacy Nagios Core CheckMK. The plugin is not compatible with the new CheckMK Micro Core (CMC).
The following guide will walk you through the integration between Checkmk and Splunk On-Call. For more information on Checkmk, please visit https://checkmk.com/
Integrating with CheckMK
Configuration in Splunk On-Call
- In Splunk On-Call, under the Integrations tab, select the Generic REST endpoint.
- Copy the REST endpoint URL on the resulting page
Configuration in CheckMK
- Create a notification in CheckMK
- For the Notification Method select the VictorOps option.
- Input the REST endpoint URL from Splunk On-Call in the VictorOPS REST URL textbox (with REST Endpoint URL selected in the dropdown
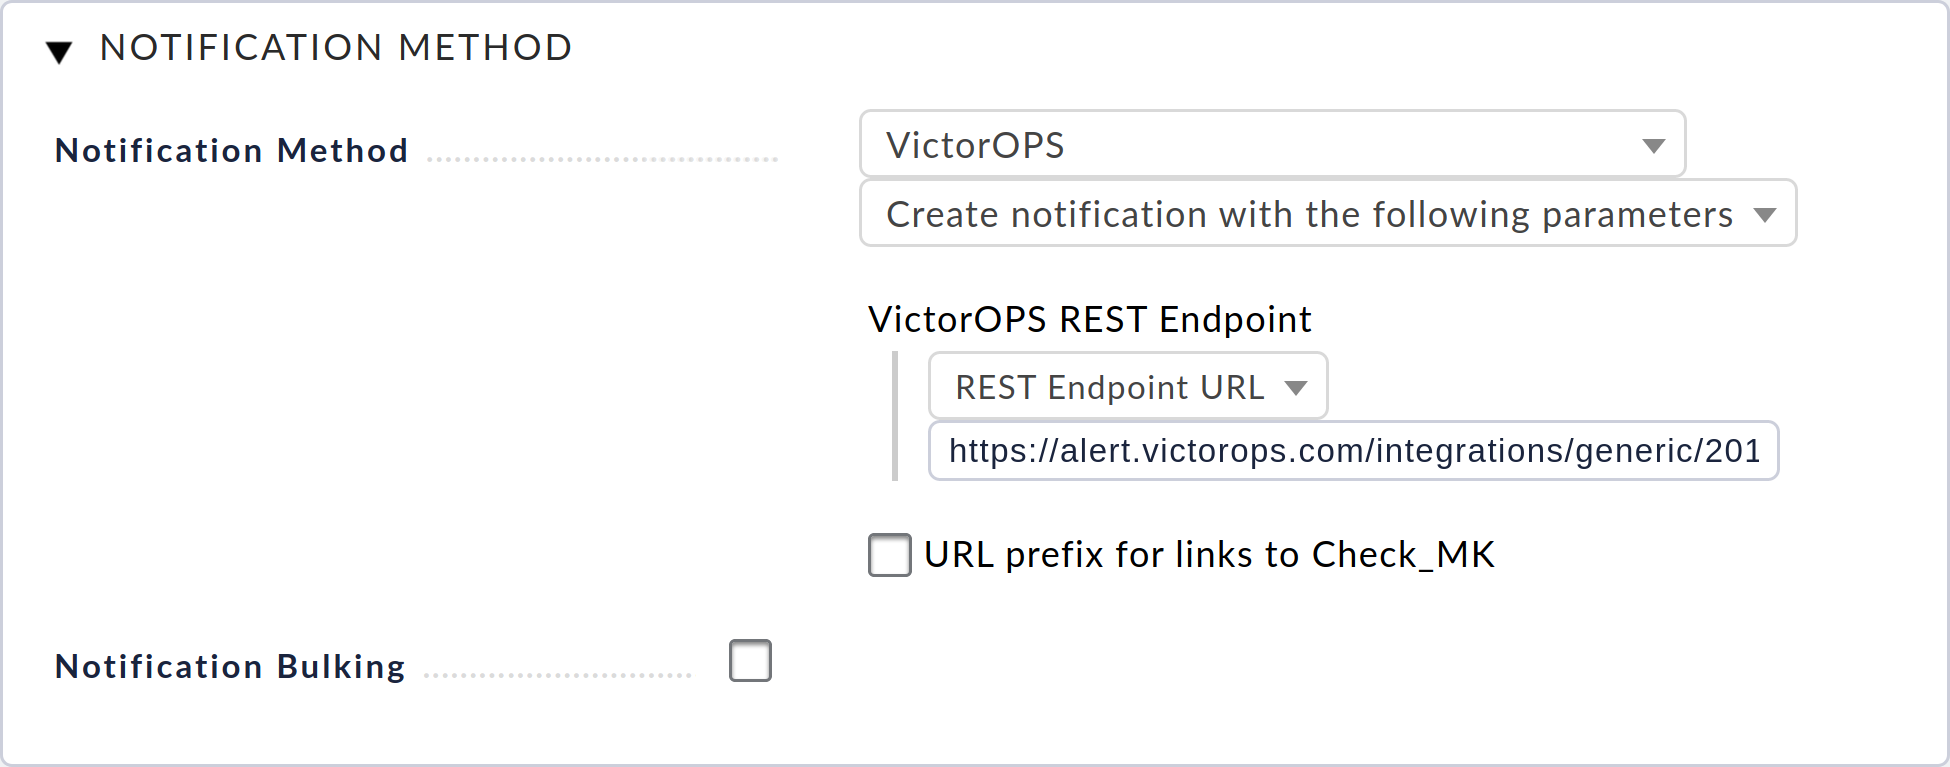
Visit CheckMK’s documentation for more information on integrating and testing.
Legacy CheckMK (Nagios Core) Plugin Installation
Installation
Depending on your system you may need to use sudo with these commands.
deb install
- Execute
wget https://github.com/victorops/monitoring_tool_releases/releases/download/victorops-nagios-1.4.20/victorops-nagios_1.4.20_all.deb
- Execute
dpkg -i <path_to_file>
If you don’t want to use dpkg you can also use
sudo apt install <path_to_file>
rpm install
- Execute
wget https://github.com/victorops/monitoring_tool_releases/releases/download/victorops-nagios-1.4.20/victorops-nagios-1.4.20-1.noarch.rpm
- Execute
rpm -i <path_to_file>
In Checkmk
Assuming “mysite” is your omd site name:
Run /opt/victorops/nagios_plugin/omd_check_mk/install.sh <omd site name>. I.e.
/opt/victorops/nagios_plugin/omd_check_mk/install.sh mysite
This command will create copies of Nagios and environment configuration files and create symlinks to them in the site Nagios directory.
Edit /opt/victorops/nagios_plugin/conf/env.<omd site name>.sh. I.e.
vi /opt/victorops/nagios_plugin/conf/env.mysite.sh
Update the file, setting the appropriate values for your organization id and key, as well as failsafe email and monitor name. To get the organization ID, you will need the slugified version of your organization name (org slug). When you are logged into the main Splunk On-Call timeline, your org slug is located at the end of the URL. (Ex. if the URL is https://portal.victorops.com/client/my-company, then the org slug, in this case, is “my-company”)
Your organization key can be found by selecting the Nagios integration in the Splunk On-Call web portal. From the main timeline select Integrations then select the Nagios/Nagios XI integration from the resulting list of integrations.
The API Key needed is located under Service API Key. (Please note: you may need to enable the integration if you do not see Service API Key)
As always with the Nagios plugin, if your localhost is not configured as “localhost” in the Nagios instance, you will need to edit /opt/victorops/nagios_plugin/nagios_conf/victorops.<omd site name>.cfg to change the service hostname on or about line 52. I.e.
vi /opt/victorops/nagios_plugin/nagios_conf/victorops.mysite.cfg
Verify the Nagios configuration
/omd/sites/;/bin/nagios -v /omd/sites/<omd site name>/tmp/nagios/nagios.cfg
Once you have taken all necessary configuration steps, you can restart your omd instance. The usual VictorOps services will appear on your Nagios host dashboard. They will also appear on the Checkmk service status for the host. You can look for logs in /var/log/victorops.
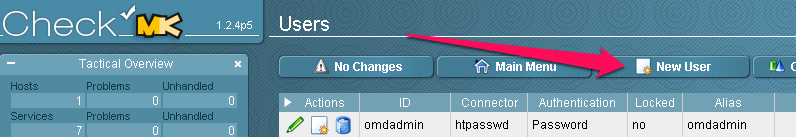
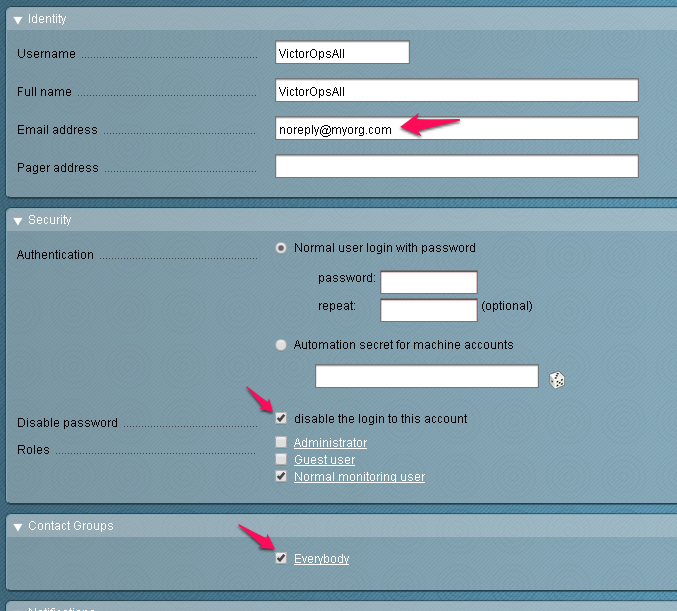
Next, you will need to configure the contact settings from the Checkmk console. Start by selecting Users.
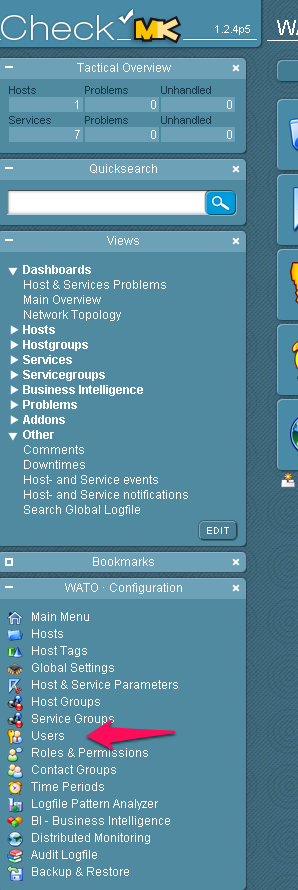
Make a New User.
Configure the user. Email is required even though no emails will be sent. Disable logins for this user and add the user to a contact group.
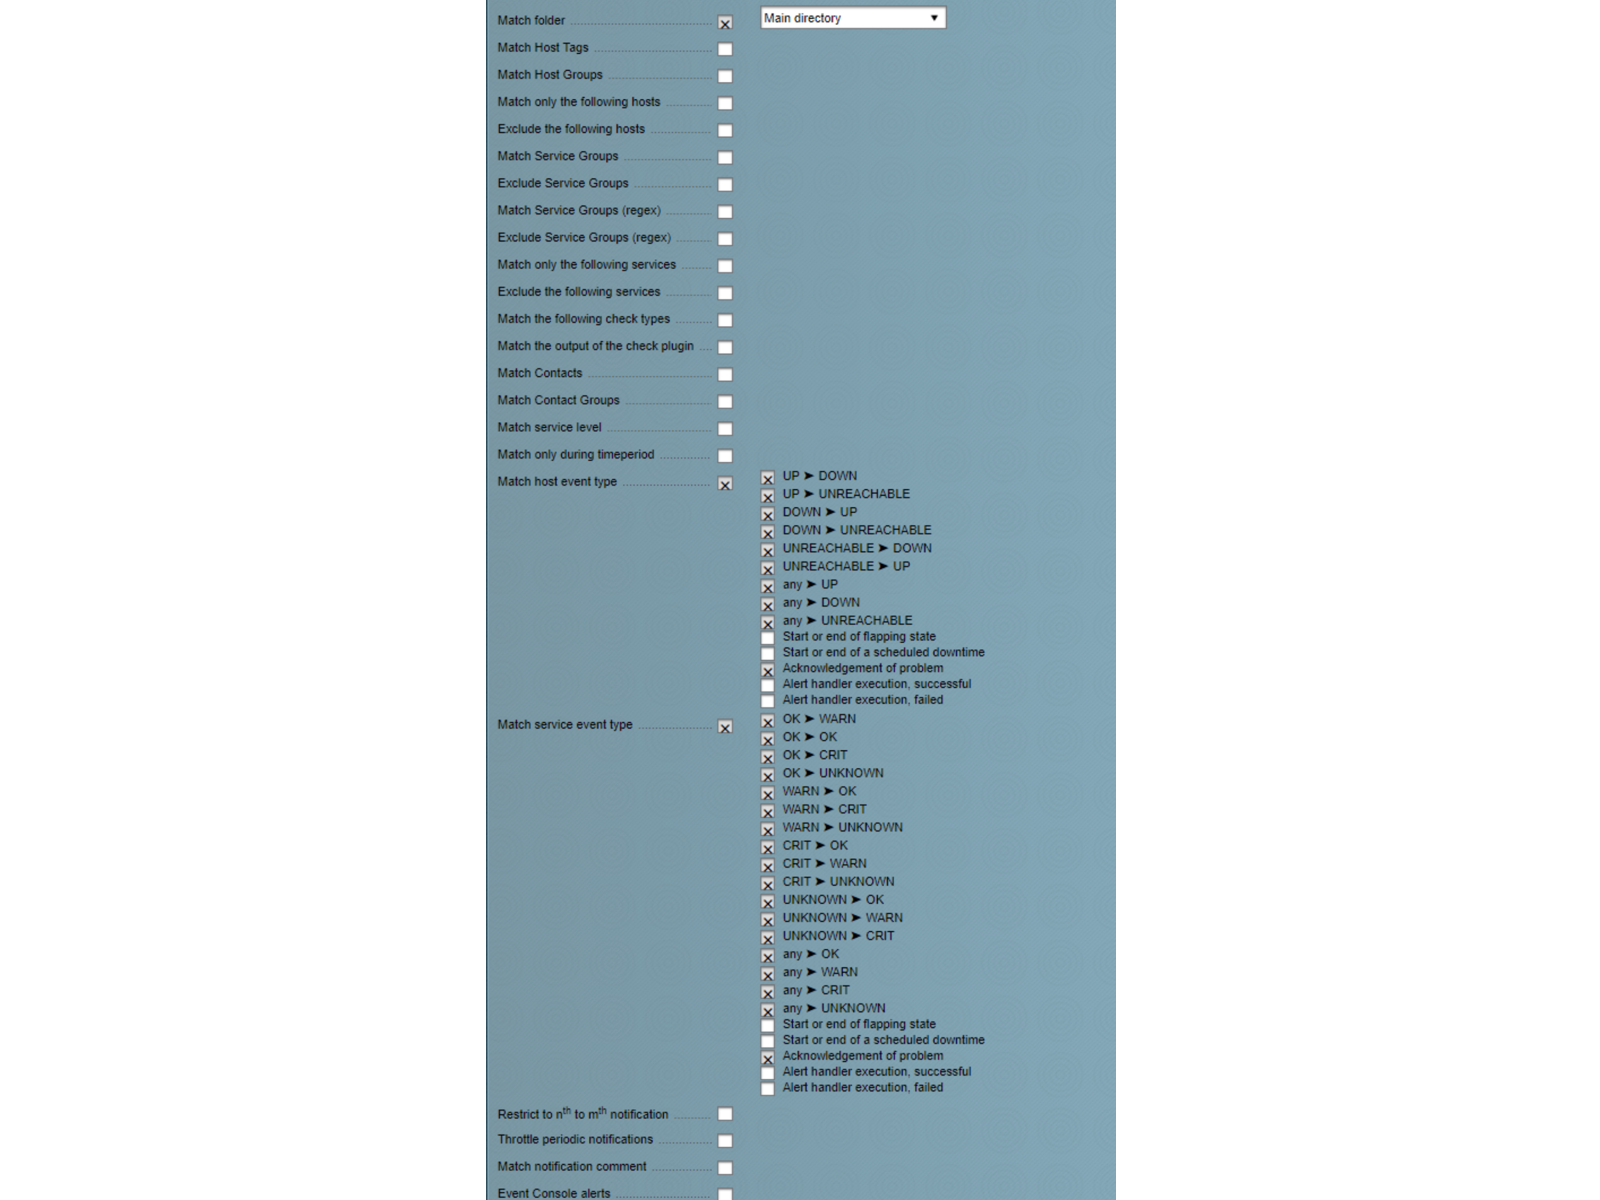
Enable notifications for the user and configure the notification method for “VictorOps” and “Call with the following parameters” as pictured here.

Disable flapping and downtime events for hosts and services, as follows (VictorOps does not currently represent these states):
You should then be able to send a test notification that will reach Splunk On-Call using the “send custom notification” features of either Checkmk or Nagios. The VictorOps Forwarder service does not notify through the usual mechanisms, though, so avoid sending custom notifications with that service.
If you have any questions regarding this integration please contact our support team.
The post Checkmk Integration Guide – VictorOps appeared first on Knowledge Base.
]]>The post Circonus Integration Guide – VictorOps appeared first on Knowledge Base.
]]>Versions Supported: N/A (SaaS)
Splunk On-Call Version Required: Getting Started, Growth, or Enterprise
The Circonus integration with Splunk On-Call (formerly VictorOps) allows you to add Splunk On-Call as a Contact Group in Circonus so you can send alerts into the Splunk On-Call timeline.
Circonus combines multiple monitoring, alerting, event reporting, and analytical tools into one unified solution. Use any data, in any application, from any system, and visualize it in real-time.
In Splunk On-Call
In Splunk On-Call, select Settings >> Integrations >> Circonus.
If the integration has not yet been enabled, click the Enable Integration button to generate your endpoint URL as seen below. Be sure to replace the “$routing_key” section with the actual routing key you intend to use. It is essential that you replace what you see here with the actual routing key you intend to use. Everything after the final forward slash must be replaced with you your key. For example, assuming a routing_key value of “database”:
………36437/$routing_key ==> ……..36437/database
Routing keys in VictorOps can be set up and associated by clicking on Settings >> Alert Behavior >> Route Keys.
For more information on routing keys and best practices, click HERE.
In Circonus
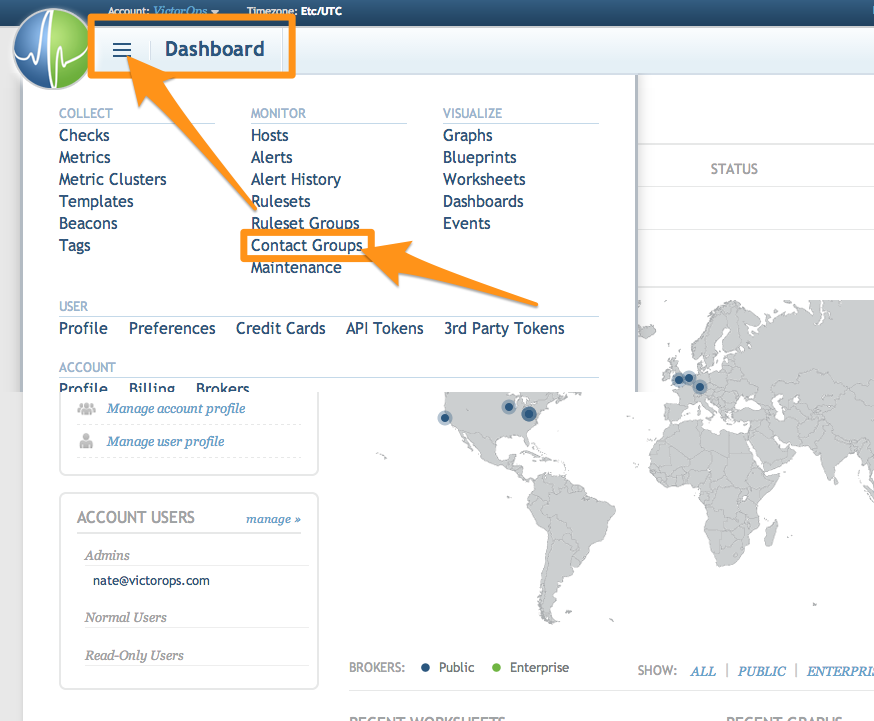
From the Circonus Dashboard select the drop down in the upper left hand corner and the Contact Groups.
Create a new Contact Group.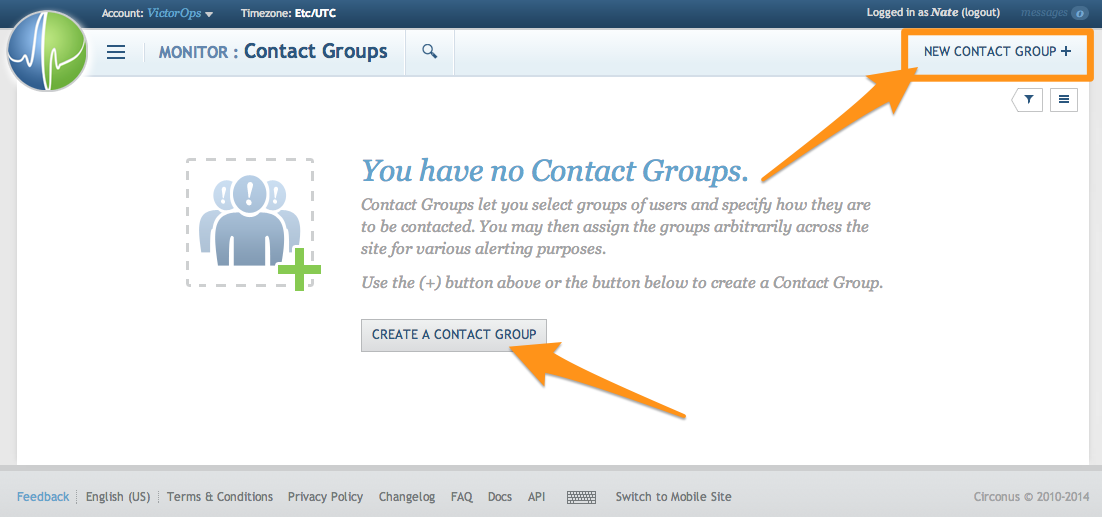
Give it a name, select VictorOps for the Use Third Party option, then hit OK.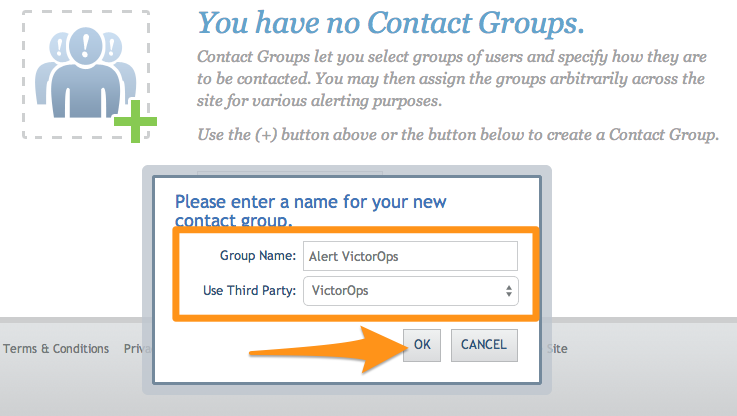
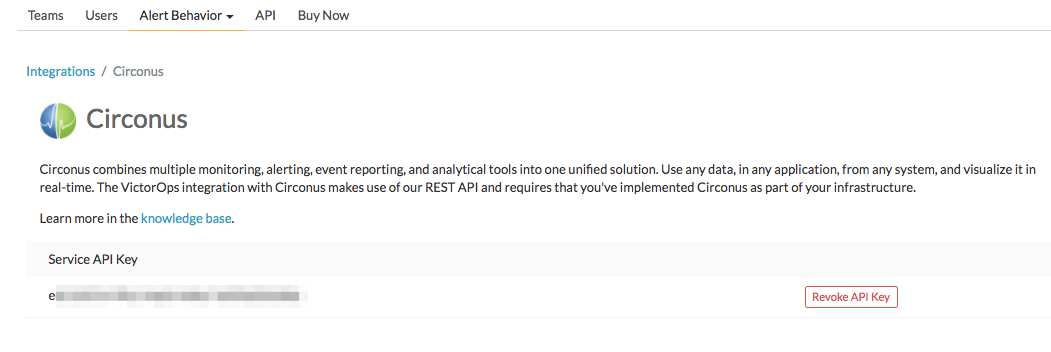
Grab your API key from the REST Endpoint URL on the Splunk On-Call integrations page. From the main timeline select Settings >> Integrations >> Circonus, as mentioned in the In Splunk On-Call section above.
Copy the API key into the box provided in Circonus. In the Team box you can define the Splunk On-Call routing key you would like to use for this integration.
If you would like further clarification on Splunk On-Call routing keys please click here.
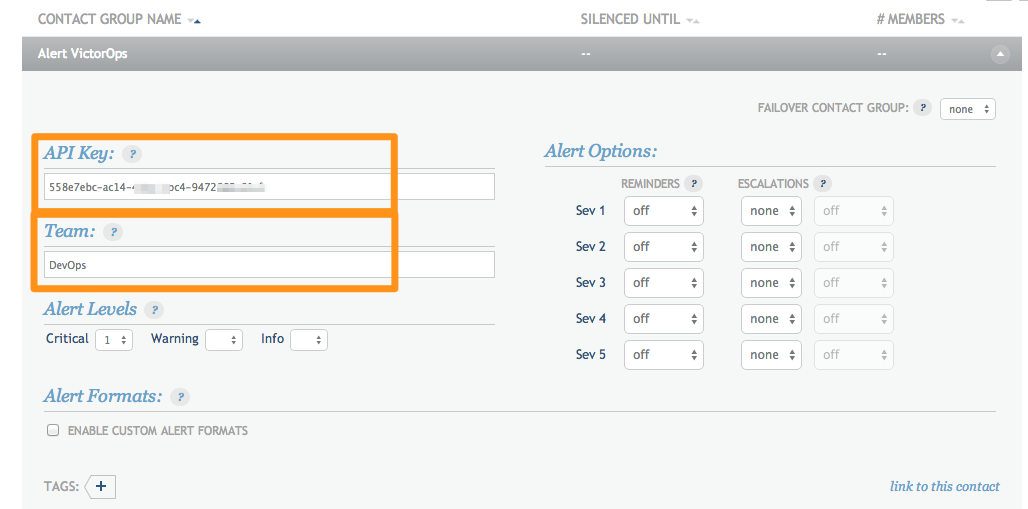
Adjust the Alert Levels and Alert Options so that Splunk On-Call will only creates incidents when needed.
That’s it! You can send a test message, just to make sure everything is configured appropriately, and an info message will be sent into the Splunk On-Call timeline.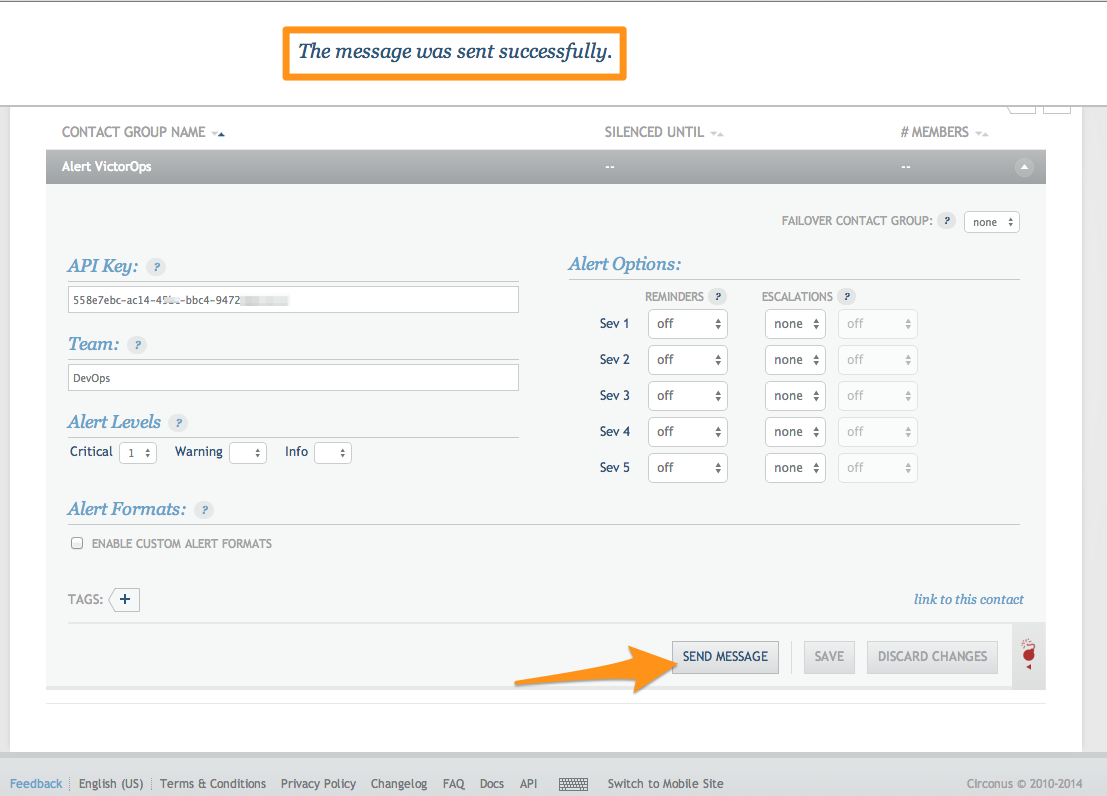
Sending Acknowledgements to Circonus
To send acknowledgements back to Circonus we will use Splunk On-Call’s Custom Outbound Webhooks. To begin we will create a new outbound webhook in Splunk On-Call.
From the settings page select Integrations >> Outgoing Webhooks.
Select Add Webhook.
Next fill in the fields as shown. Make sure to paste in the Webhook URL from your Splunk On-Call Contact Group from Circonus into the To: field.
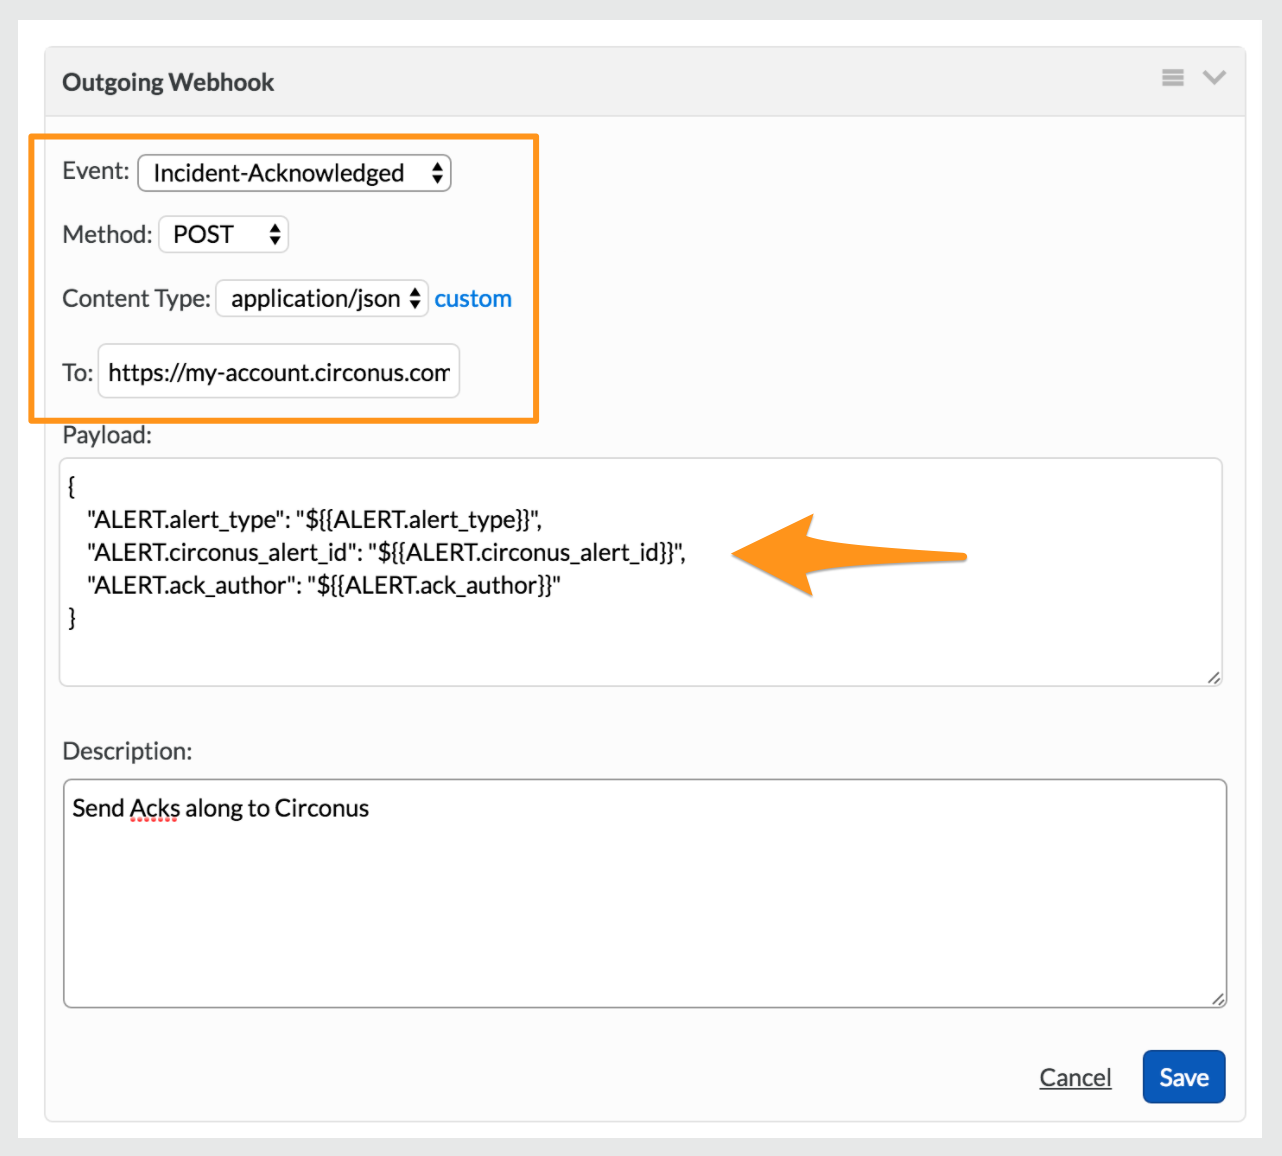
Paste in the following into the Payload field:
{
   "ALERT.alert_type": "${{ALERT.alert_type}}",
   "ALERT.circonus_alert_id": "${{ALERT.circonus_alert_id}}",
   "ALERT.ack_author": "${{ALERT.ack_author}}"
}
Note: If you want alerts that are “Resolved” via Splunk On-Call to clear the acknowledgment at Circonus (allowing the alert to be triggered again) set the Event field to Any-Incident. Otherwise, set it to “Incident-Acknowledged” and the acknowledgement at Circonus will expire normally (if the alert condition doesn’t clear first).
When acknowledging alerts via Splunk On-Call, the alert at Circonus is acknowledged for 30 minutes by default. You can change this by adding the following option to the Webhook URL query string: ?acknowledge_minutes=X
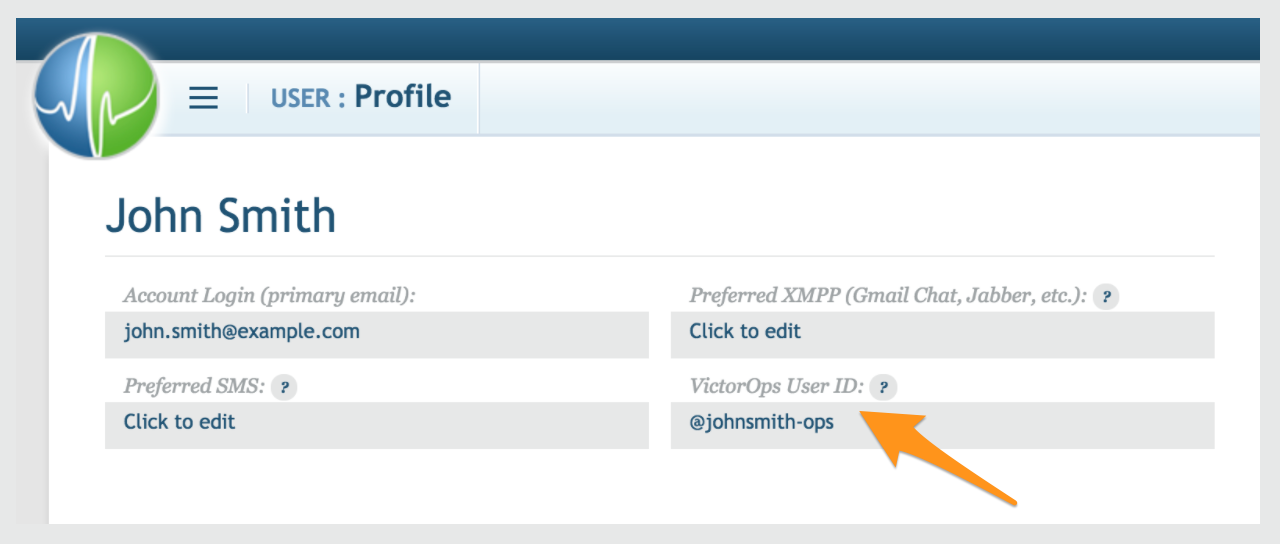
Important: The Splunk On-Call team member who acks the alert must have a Circonus account that has write (Normal or Admin) access to the account whose metric is alerting. To link the Splunk On-Call user to the Circonus user, go to the User Profile page at Circonus and type in the Splunk On-Call username:
The post Circonus Integration Guide – VictorOps appeared first on Knowledge Base.
]]>The post AWS CloudWatch Integration Guide – VictorOps appeared first on Knowledge Base.
]]>The Splunk On-Call (formerly VictorOps) and AWS Cloudwatch integration allows you to forward AWS Cloudwatch alerts into Splunk On-Call to notify the correct on-call users. Create on-call schedules, rotations, and escalation policies in Splunk On-Call, then route AWS alerts based on those parameters.
When events meet predetermined monitoring criteria, AWS sends an alert notification. Then, in the Splunk On-Call timeline, users can route and escalate critical alert data to the correct people. With the Splunk On-Call and AWS integration, on-call responders can collaborate in real-time around system data to reduce MTTA/MTTR and resolve incidents faster.
Versions Supported: N/A (SaaS)
VictorOps Version Required: Starter, Growth, or Enterprise
What you need to know: This integration works with Amazon CloudWatch only. SNS messages sent from other Amazon services will fail if sent directly to your CloudWatch endpoint in VictorOps.
Our CloudWatch integration allows you to send alerts from Amazon’s CloudWatch into your Splunk On-Call timeline. This guide assumes that you’ve already set up CloudWatch to send alarms to a queue in SNS and that you’re receiving them through some other means, such as email. If you need more information on how to create a new alarm please consult Amazon’s documentation.
NOTE: SNS Messages sent from other Amazon services will fail if sent directly to the Cloudwatch endpoint in Splunk On-Call.
Enable AWS Cloudwatch in Splunk On-Call
In Splunk On-Call, select Integrations >> AWS CloudWatch.
If the integration has not yet been enabled, click the Enable Integration button to generate your endpoint URL. Be sure to replace the “$routing_key” section of your new endpoint with the actual routing key you intend to use. If no routing key is included as part of the endpoint URL, the subscription will not be confirmed. (To view or configure routing keys in VictorOps, click Settings >> Routing Keys)
Multiple SNS subscriptions should be pointed towards the same AWS CloudWatch endpoint in VictorOps. The subscription will not be confirmed if it hits a different endpoint.
Linking Splunk On-Call in AWS Simple Notification Service (SNS)
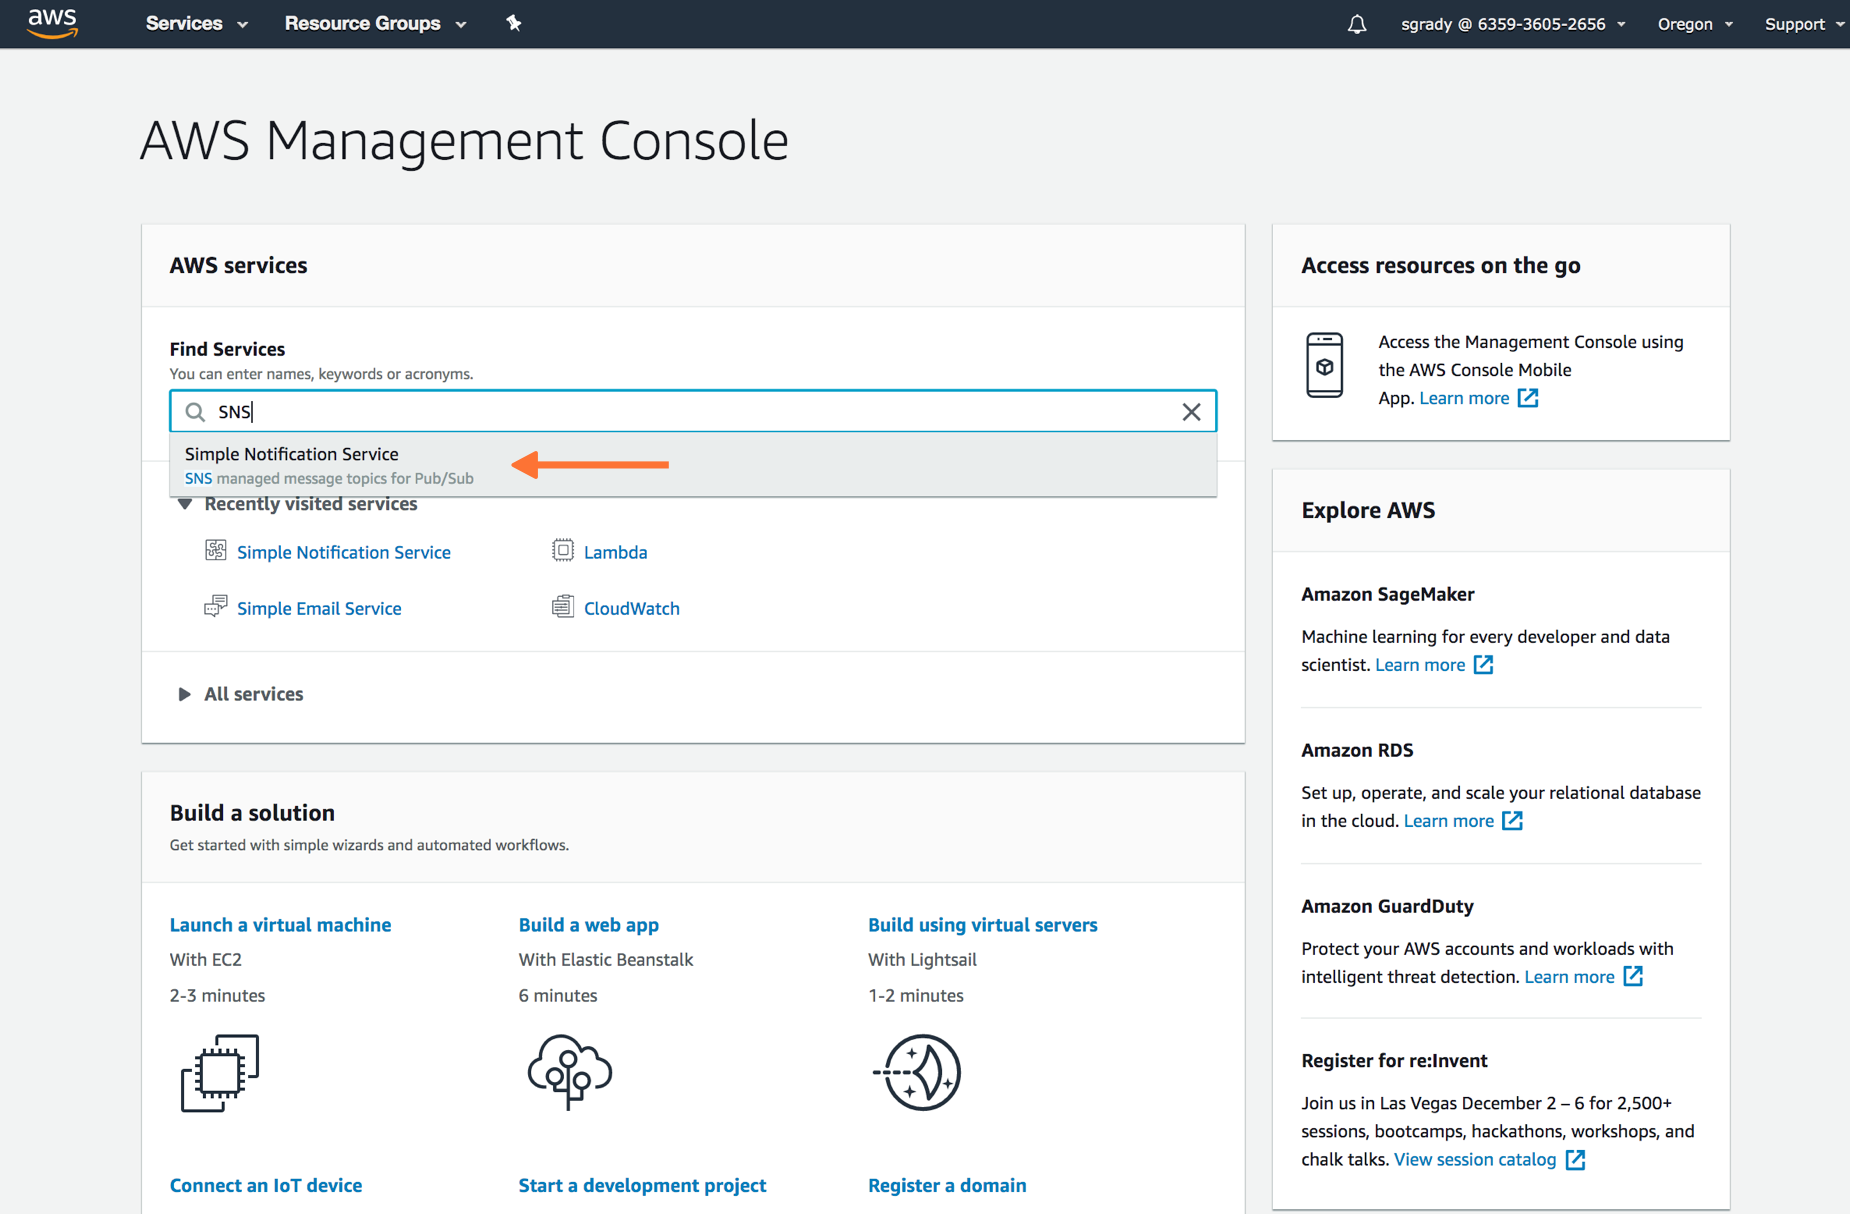
From the main AWS Management Console, navigate to your SNS control panel by searching for “SNS“, in the main search bar.
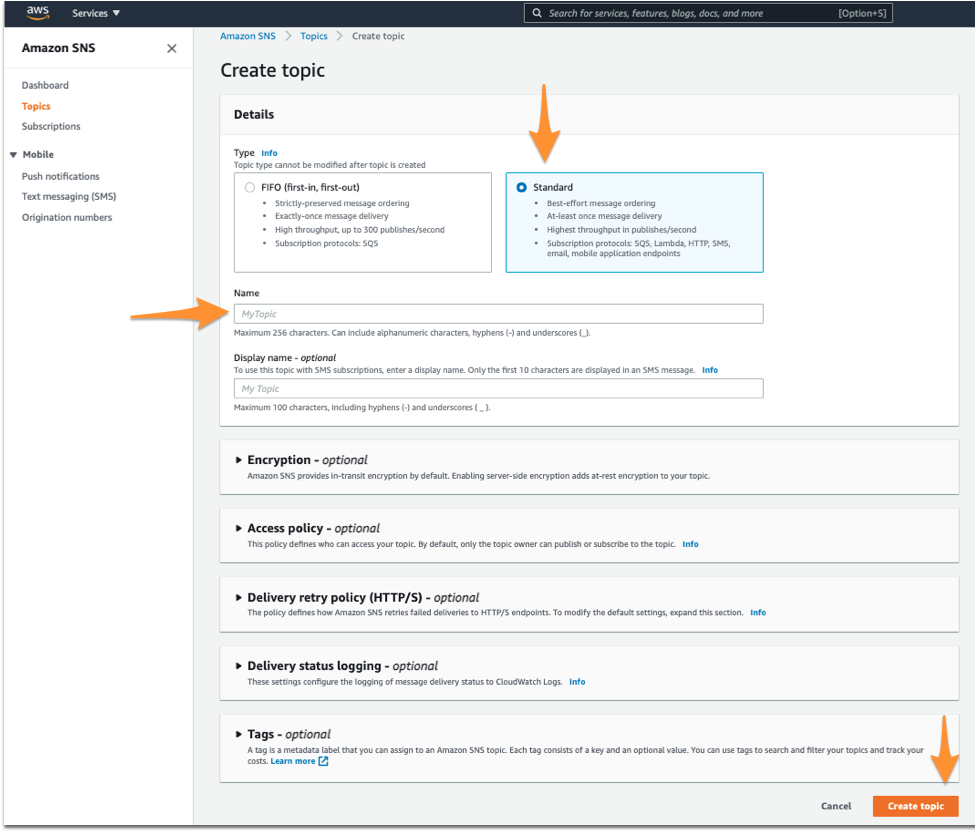
From the SNS dashboard, choose Topics and then select Create topic.
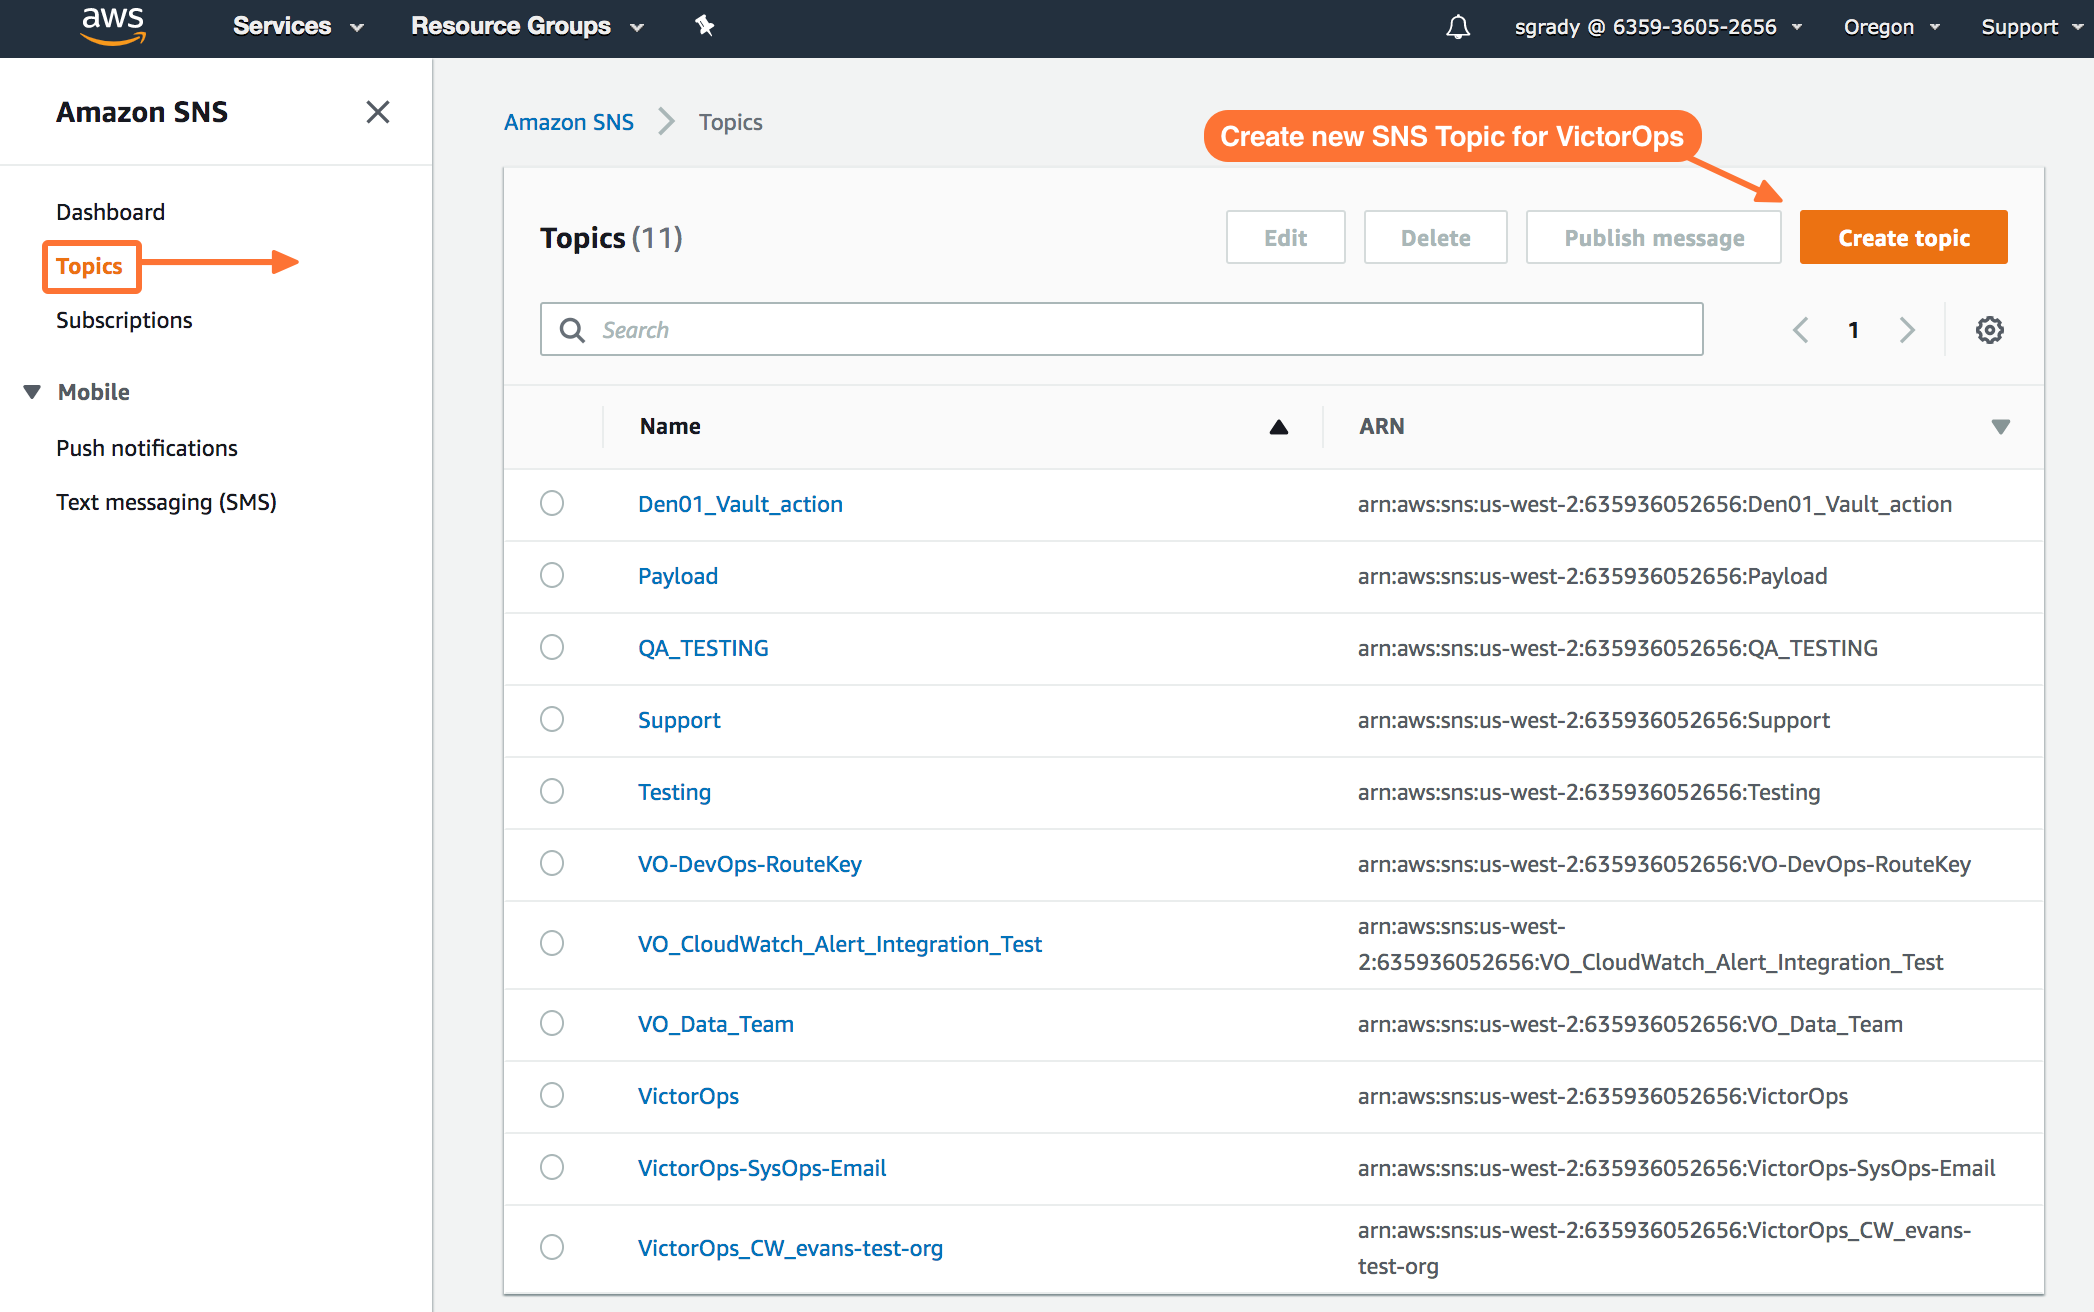
Select Standard for Type. Name your Topic. Then, hit Create Topic at the bottom.
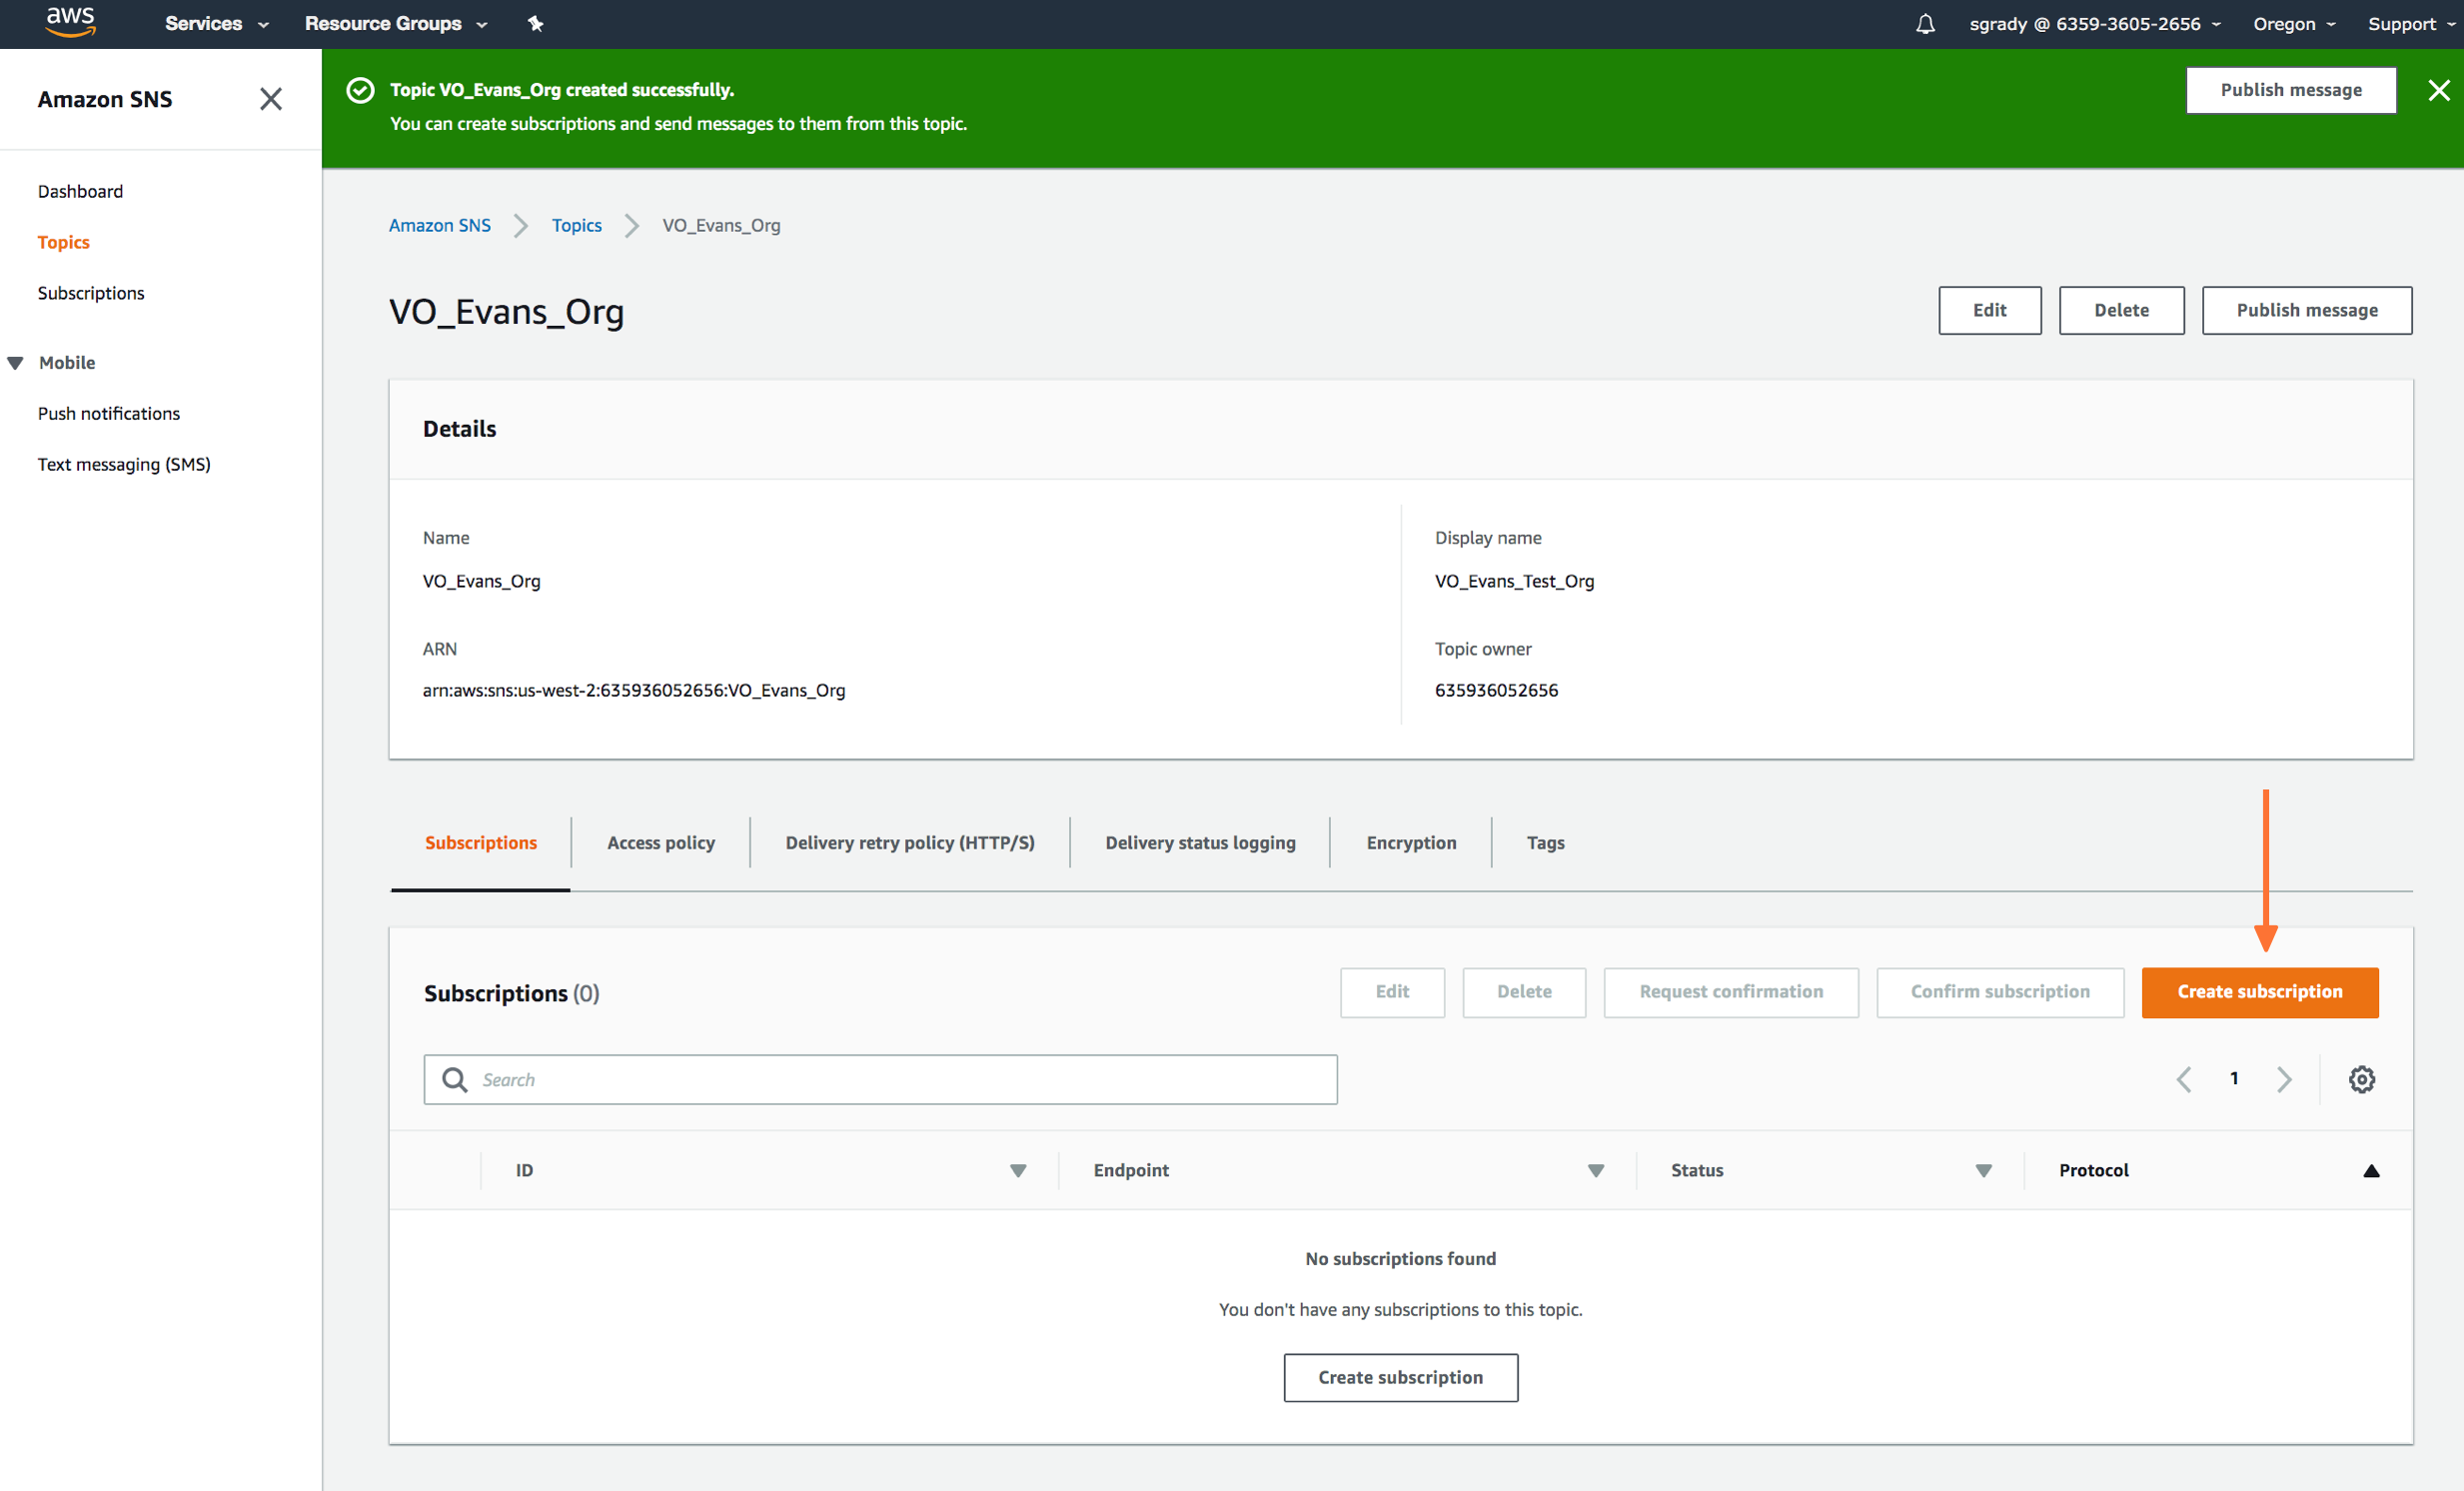
Once you’ve created your Splunk On-Call related Topic, you’ll be required to create a Subscription to the new Topic you created.
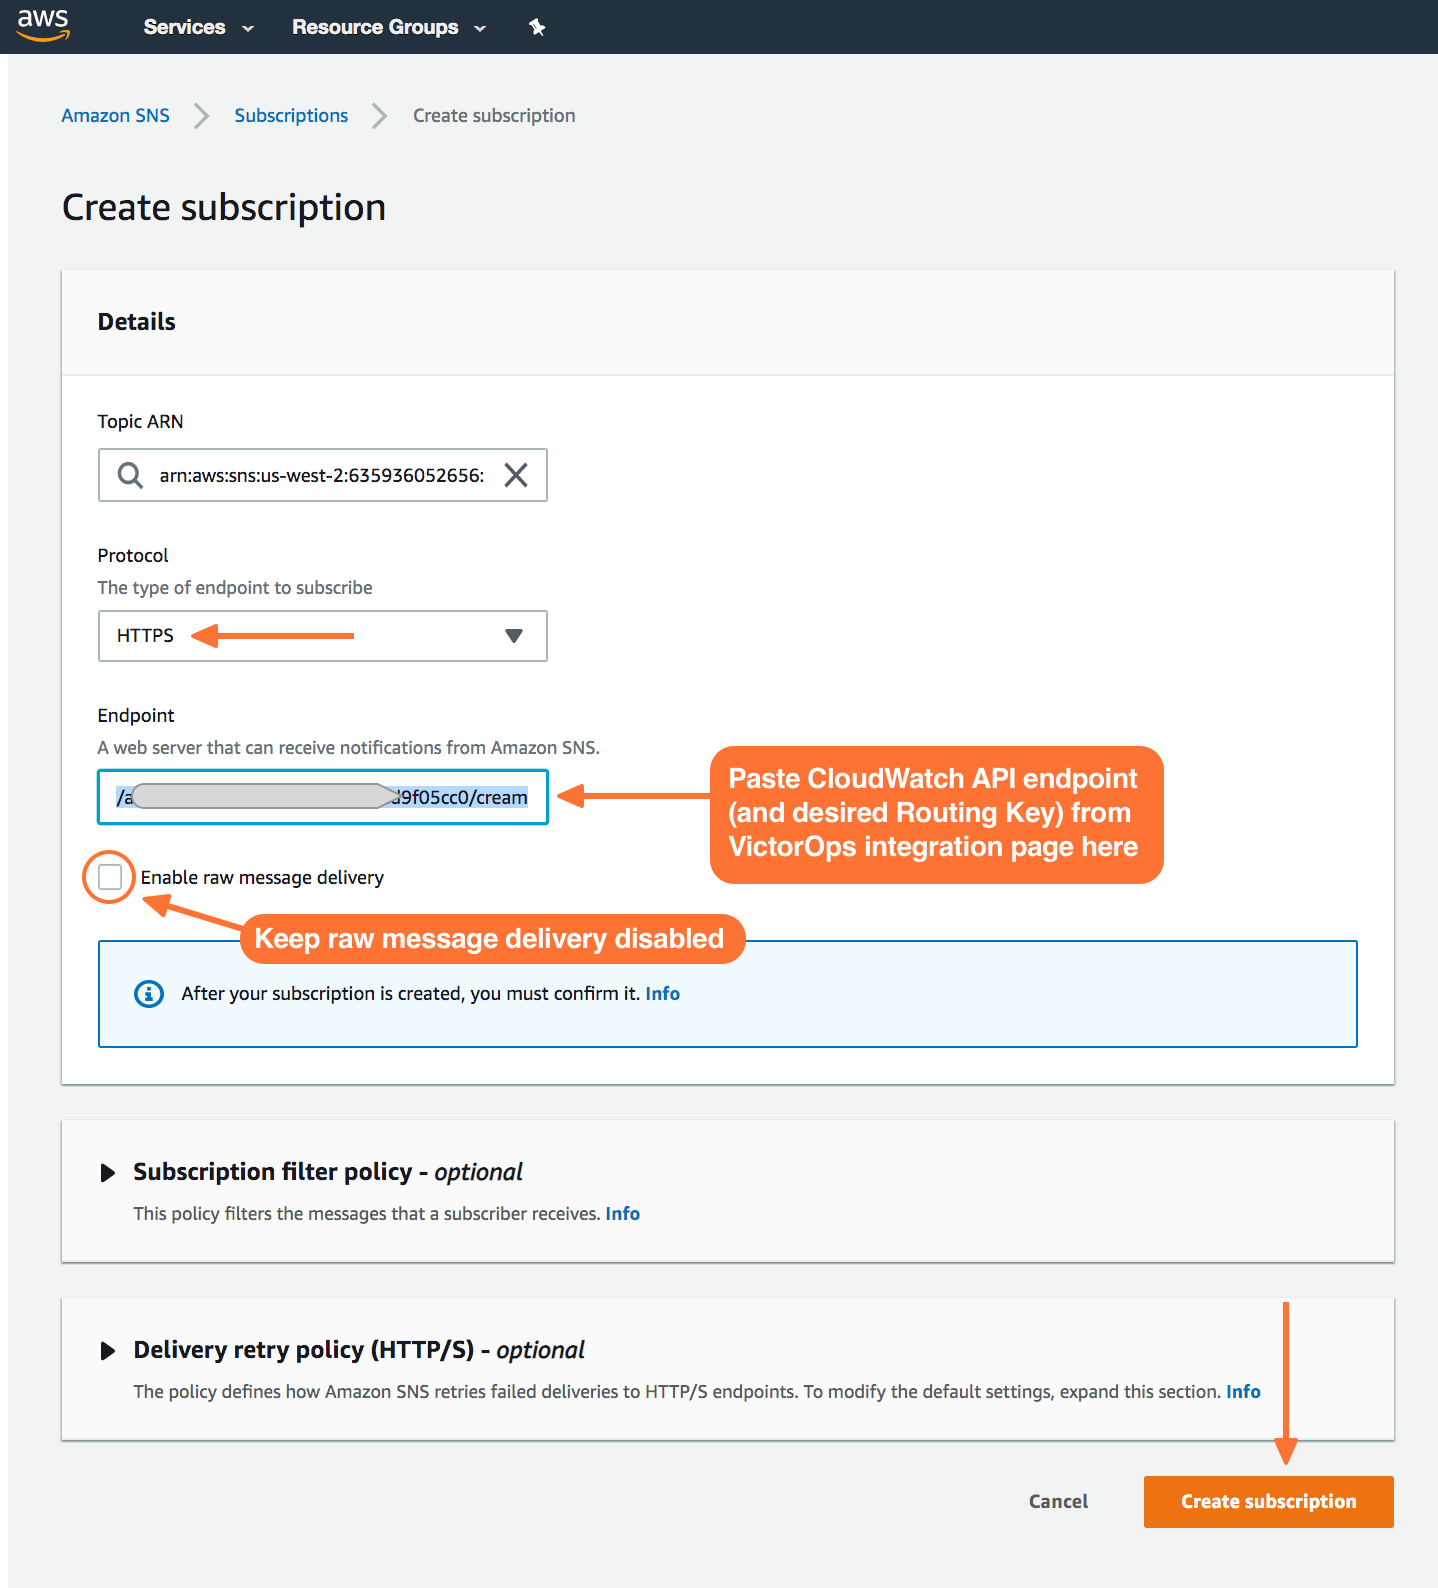
Here you’ll define the protocol type as HTTPS, paste in the custom endpoint with the desired routing key.
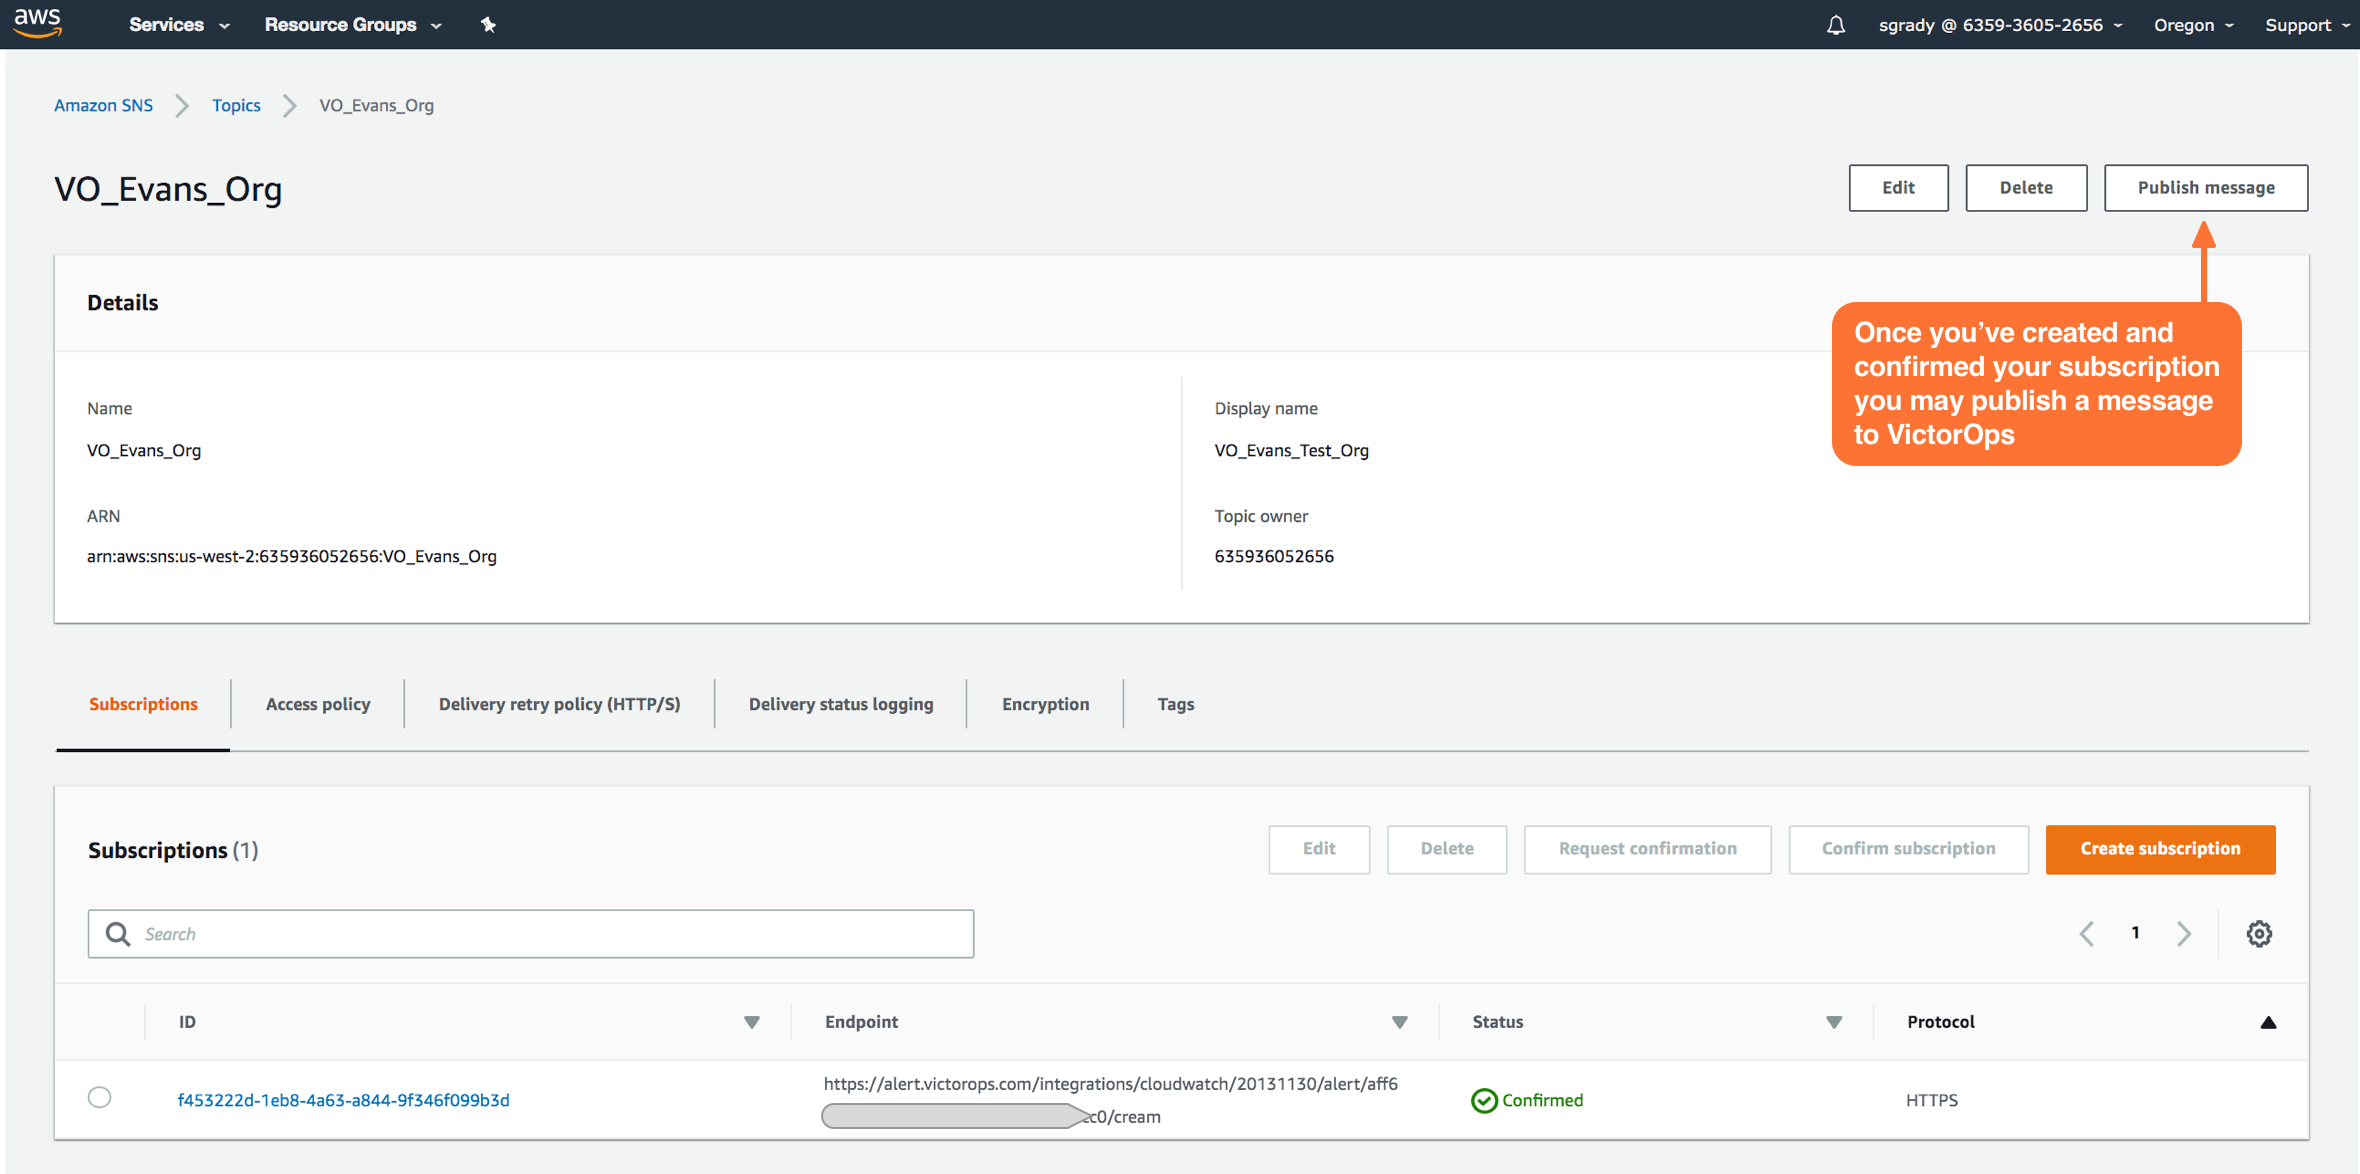
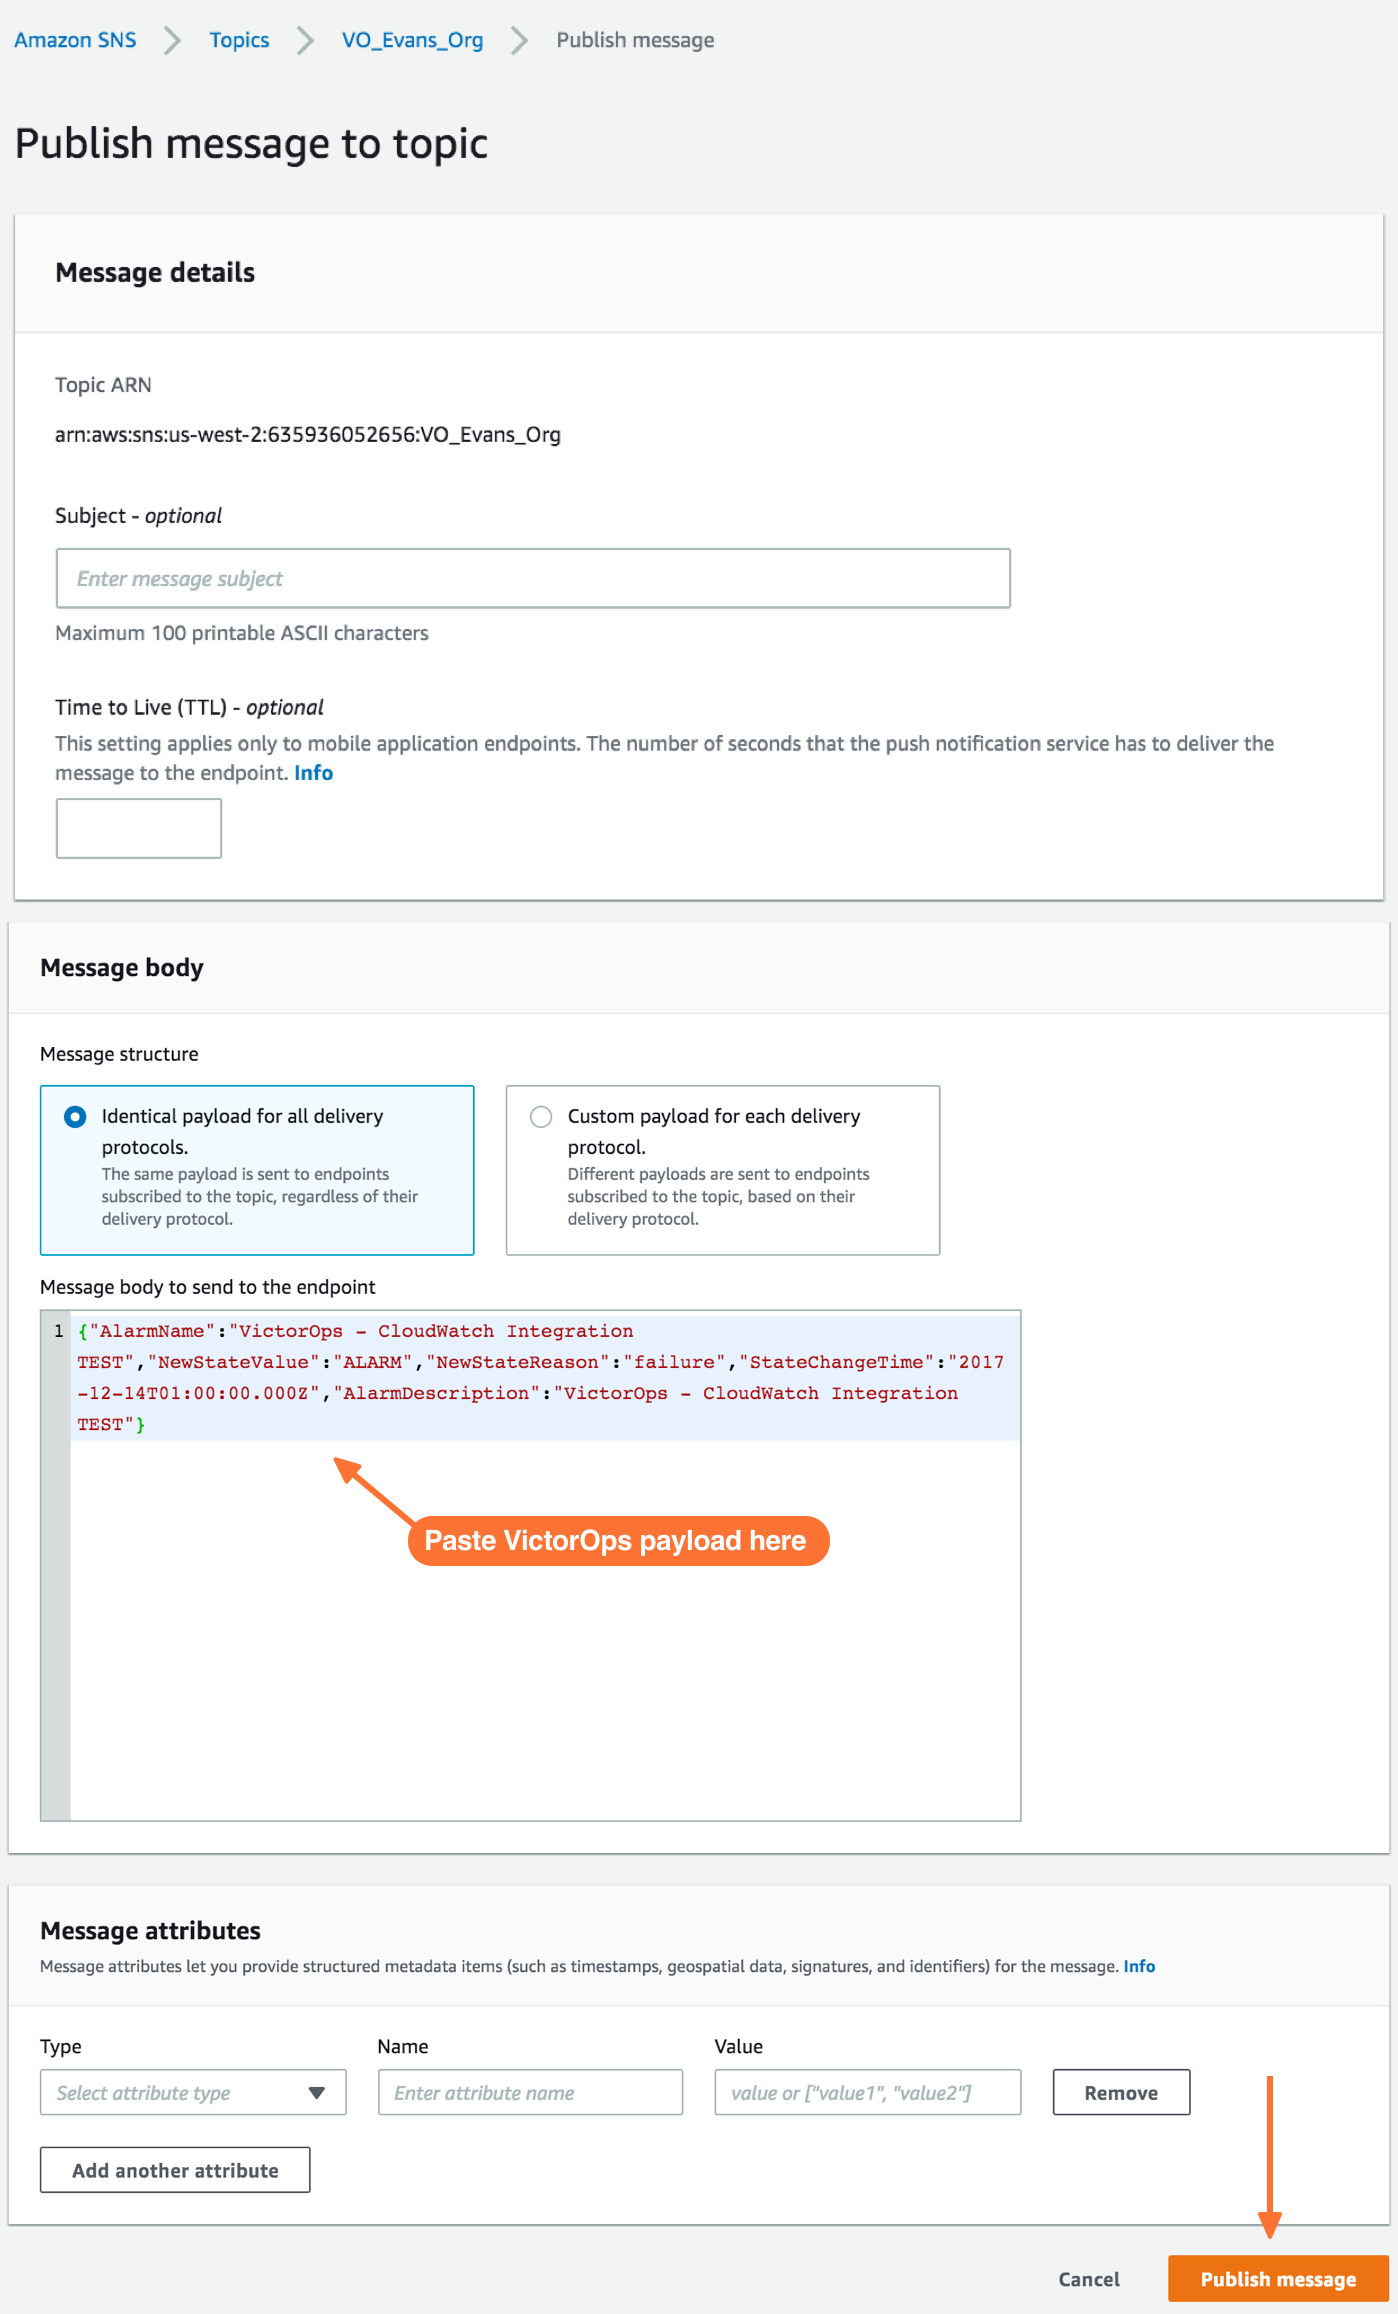
Once your subscription is confirmed, select Publish Message. In the following steps, you’ll be able to send a test incident to Splunk On-Call.
Testing the Integration
In the Publish message page, add the following payload to the Message box. Do not change the formatting. Changes here, including changes to the granularity of StateChangeTime to microseconds/nanoseconds, will result in failure of Cloudwatch incident delivery to Splunk On-Call.
Custom Payload
{"AlarmName":"VictorOps - CloudWatch Integration TEST","NewStateValue":"ALARM","NewStateReason":"failure","StateChangeTime":"2017-12-14T01:00:00.000Z","AlarmDescription":"VictorOps - CloudWatch Integration TEST"}
Once you’ve published a message to a topic with the required Splunk On-Call payload, you should see a green bar display a success message in CloudWatch.
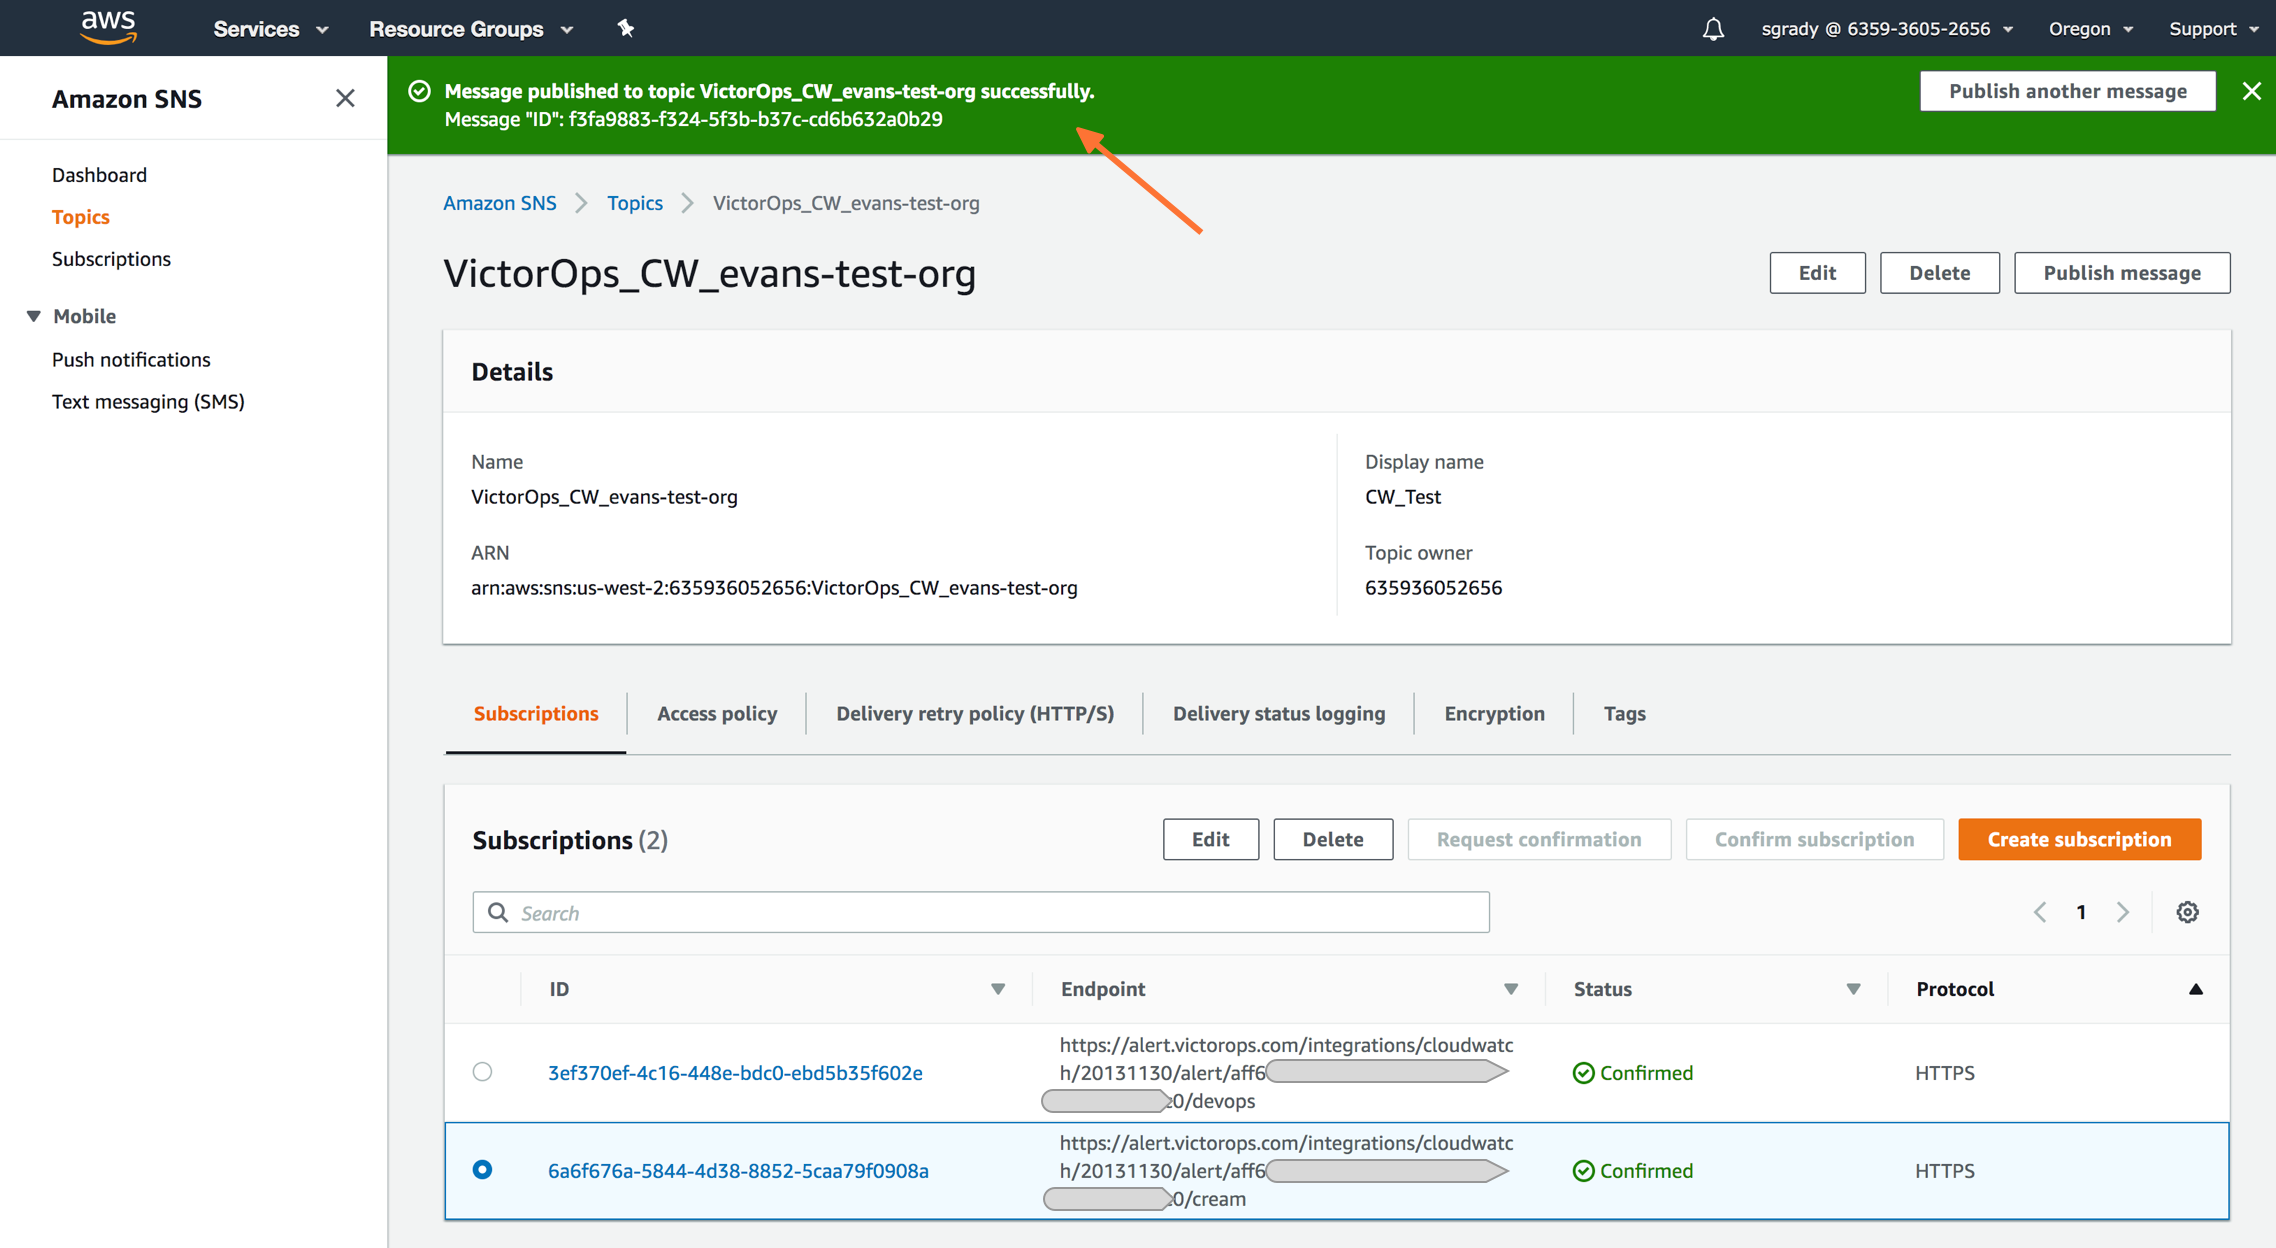
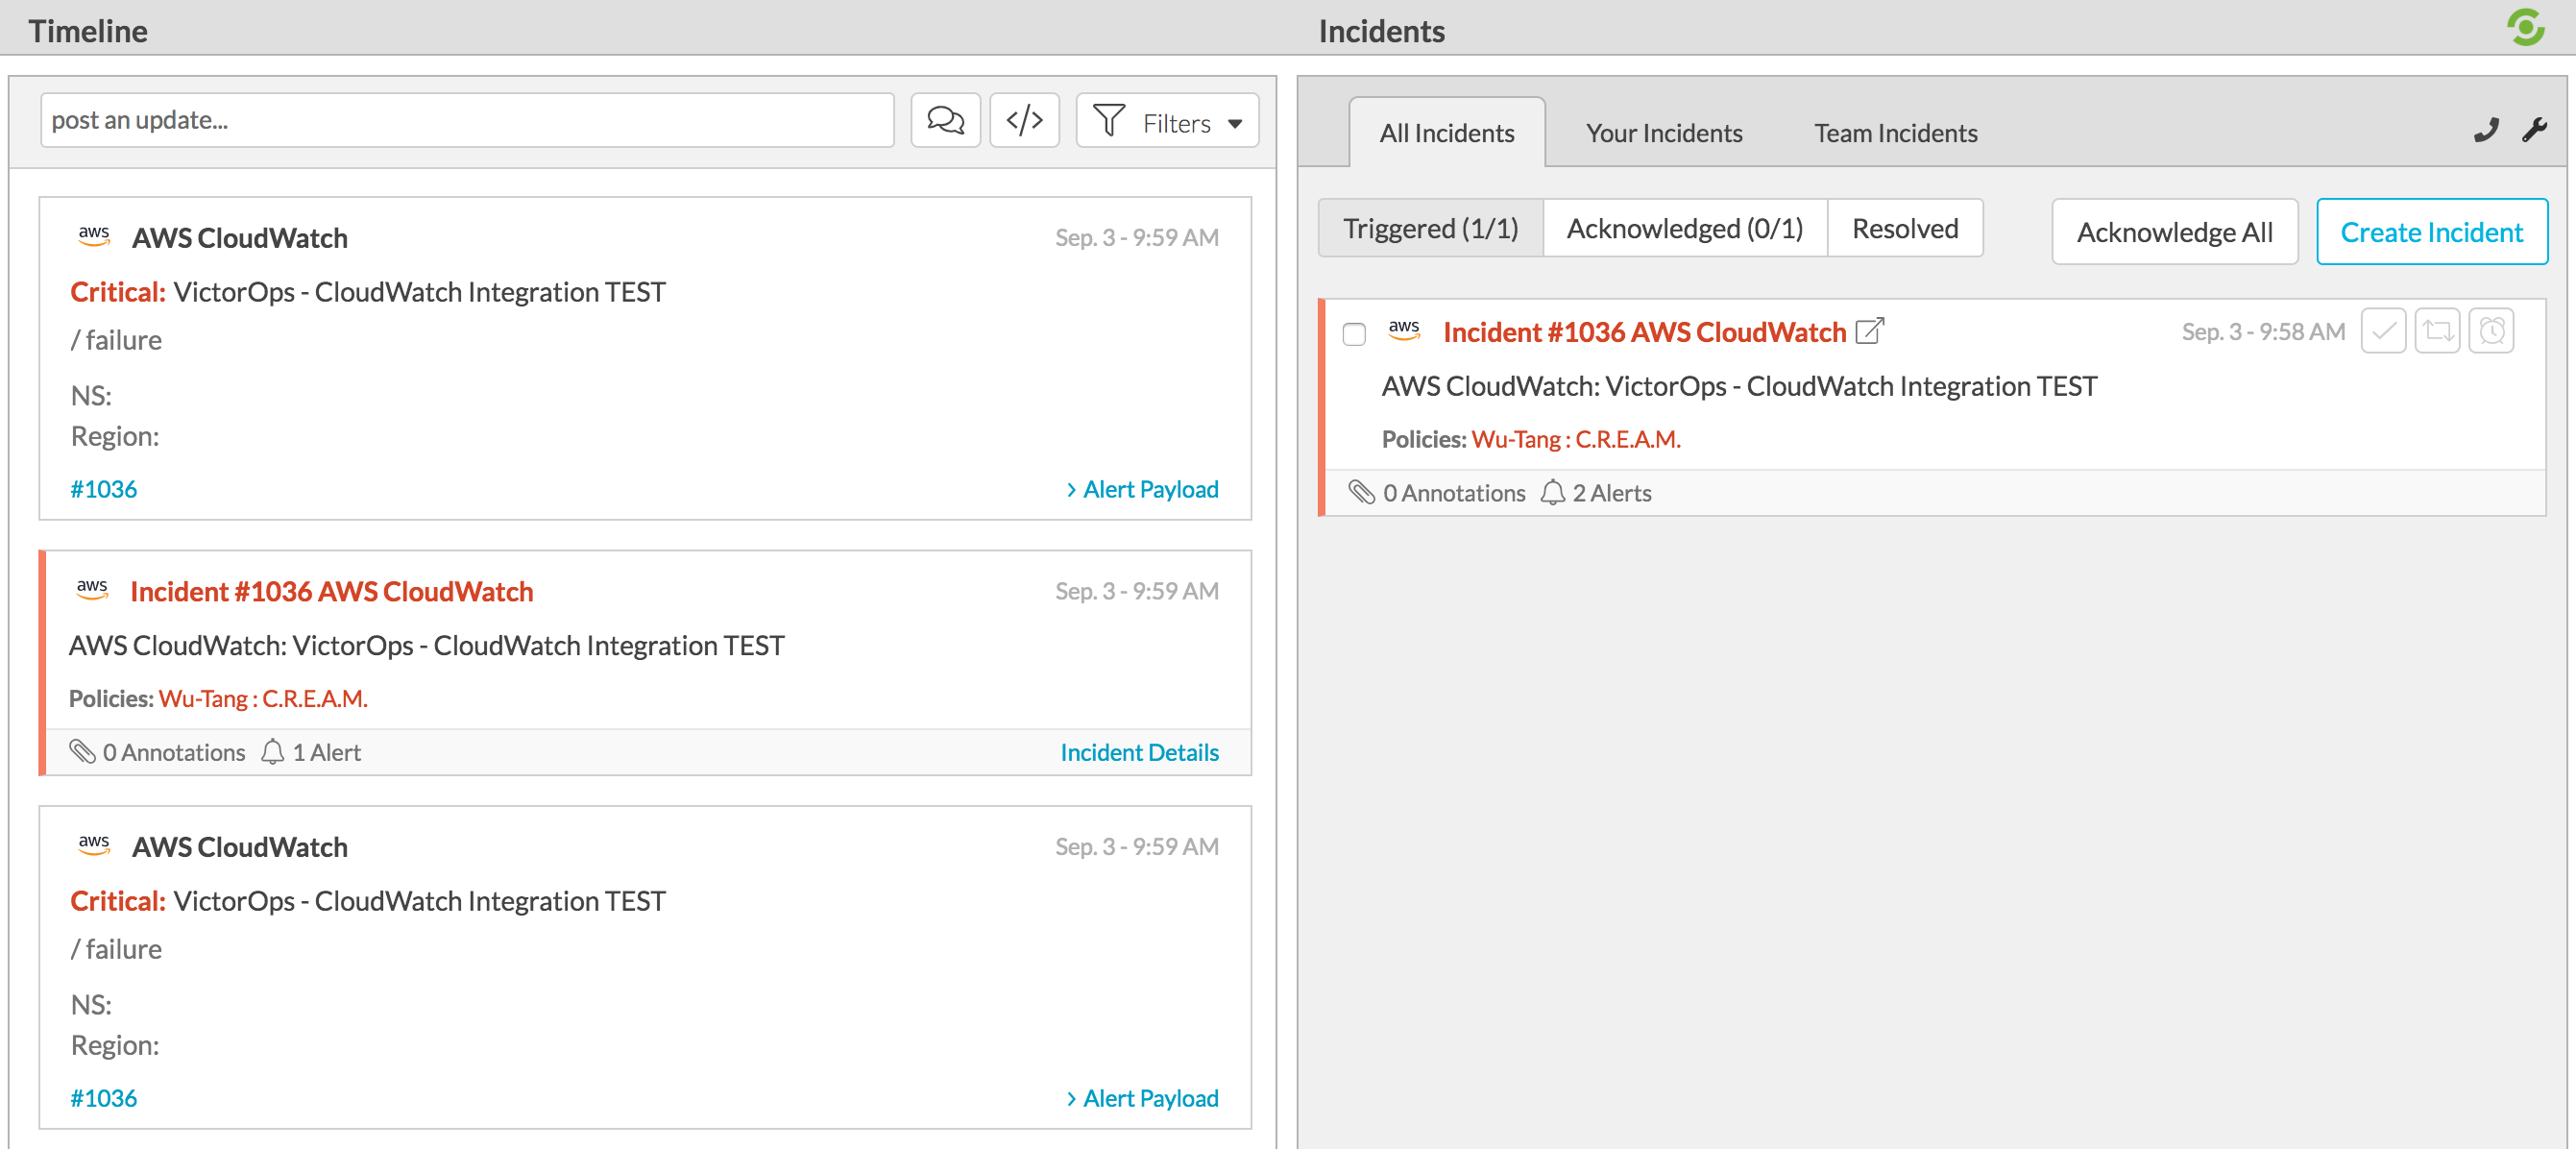
Navigate back to Splunk On-Call and you should see a new incident created.
To send in a RECOVERY to Splunk On-Call simply replace the “Alarm” variable in the field “NewStateValue” to “OK” in the provided payload and publish the message again:
"NewStateValue":"OK"
Auto-Recovery Alarms from CloudWatch
Cloudwatch is where you set the alerts that triggers the event that sends Splunk On-Call an incident.
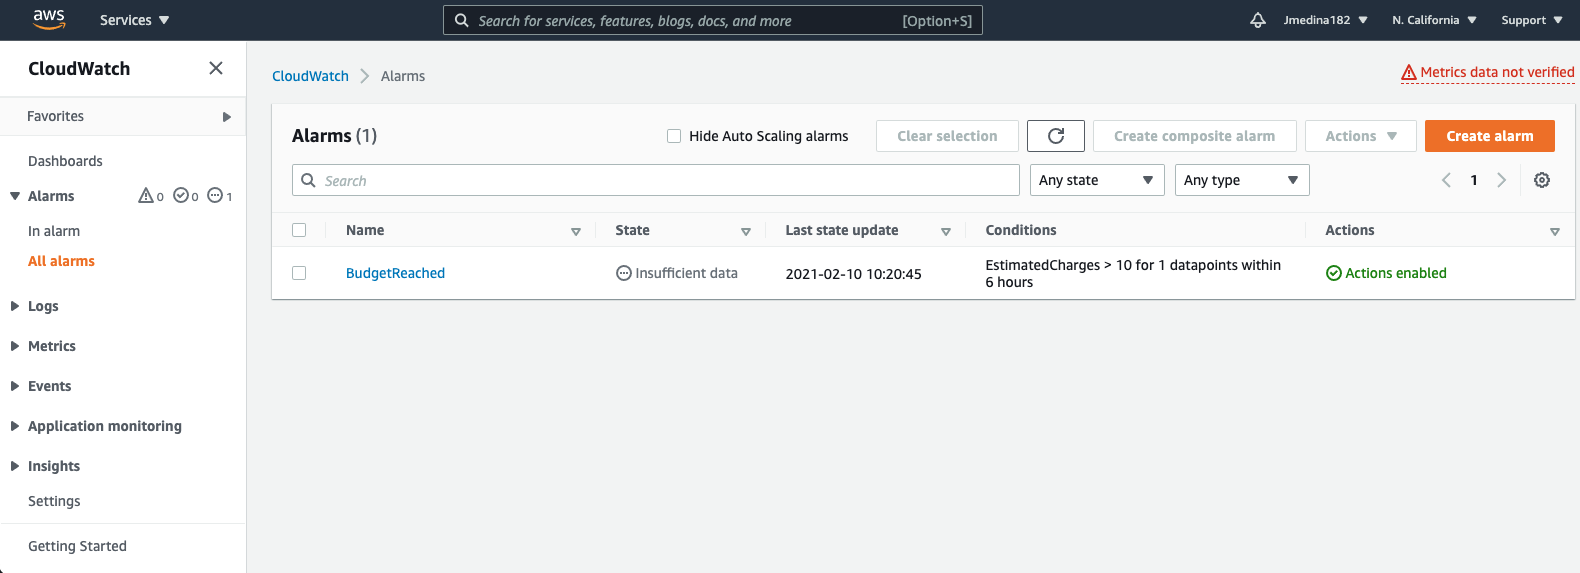
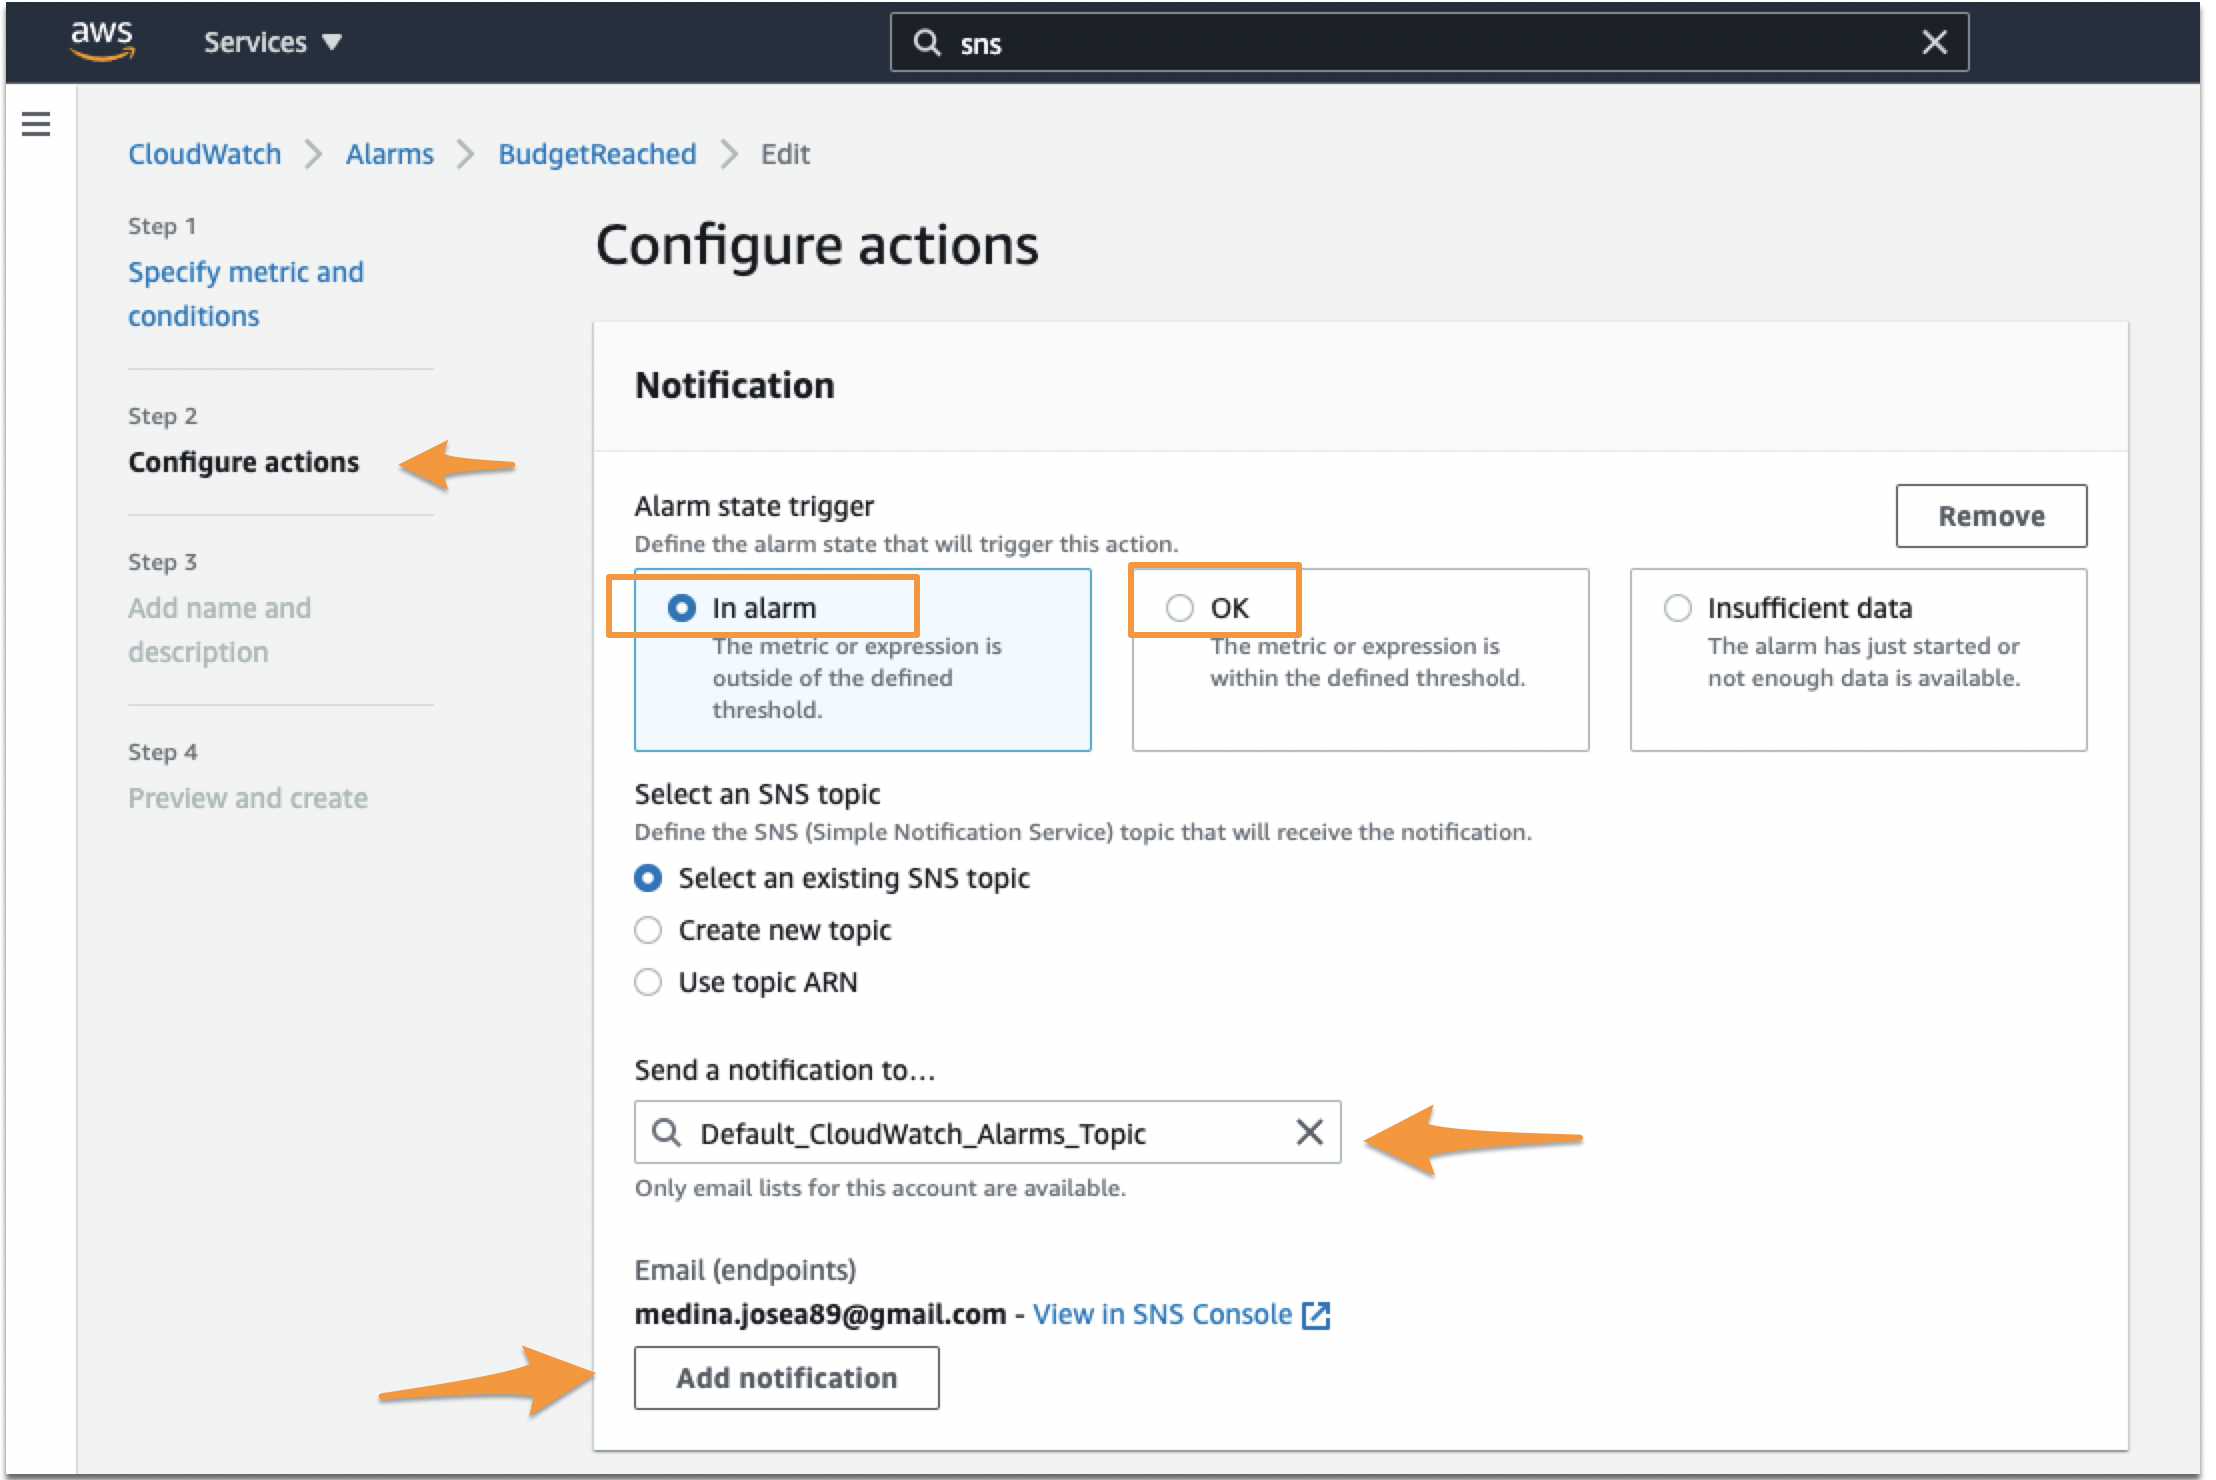
When setting up the Alarm (or if you are editing one that you have already), the second step is to configure the actions for the notifications. In here, you want to make sure you set two different trigger notifications, one for ‘In Alarm’ and another for ‘OK’.
Set the first notification as In Alarm. Then make sure you tie this notification to the Topic you just created in SNS. Click Add Notification after that.
Set the second notification as OK. Make sure again you set the right Topic. Click Next or Update Alarm at the end of the page.
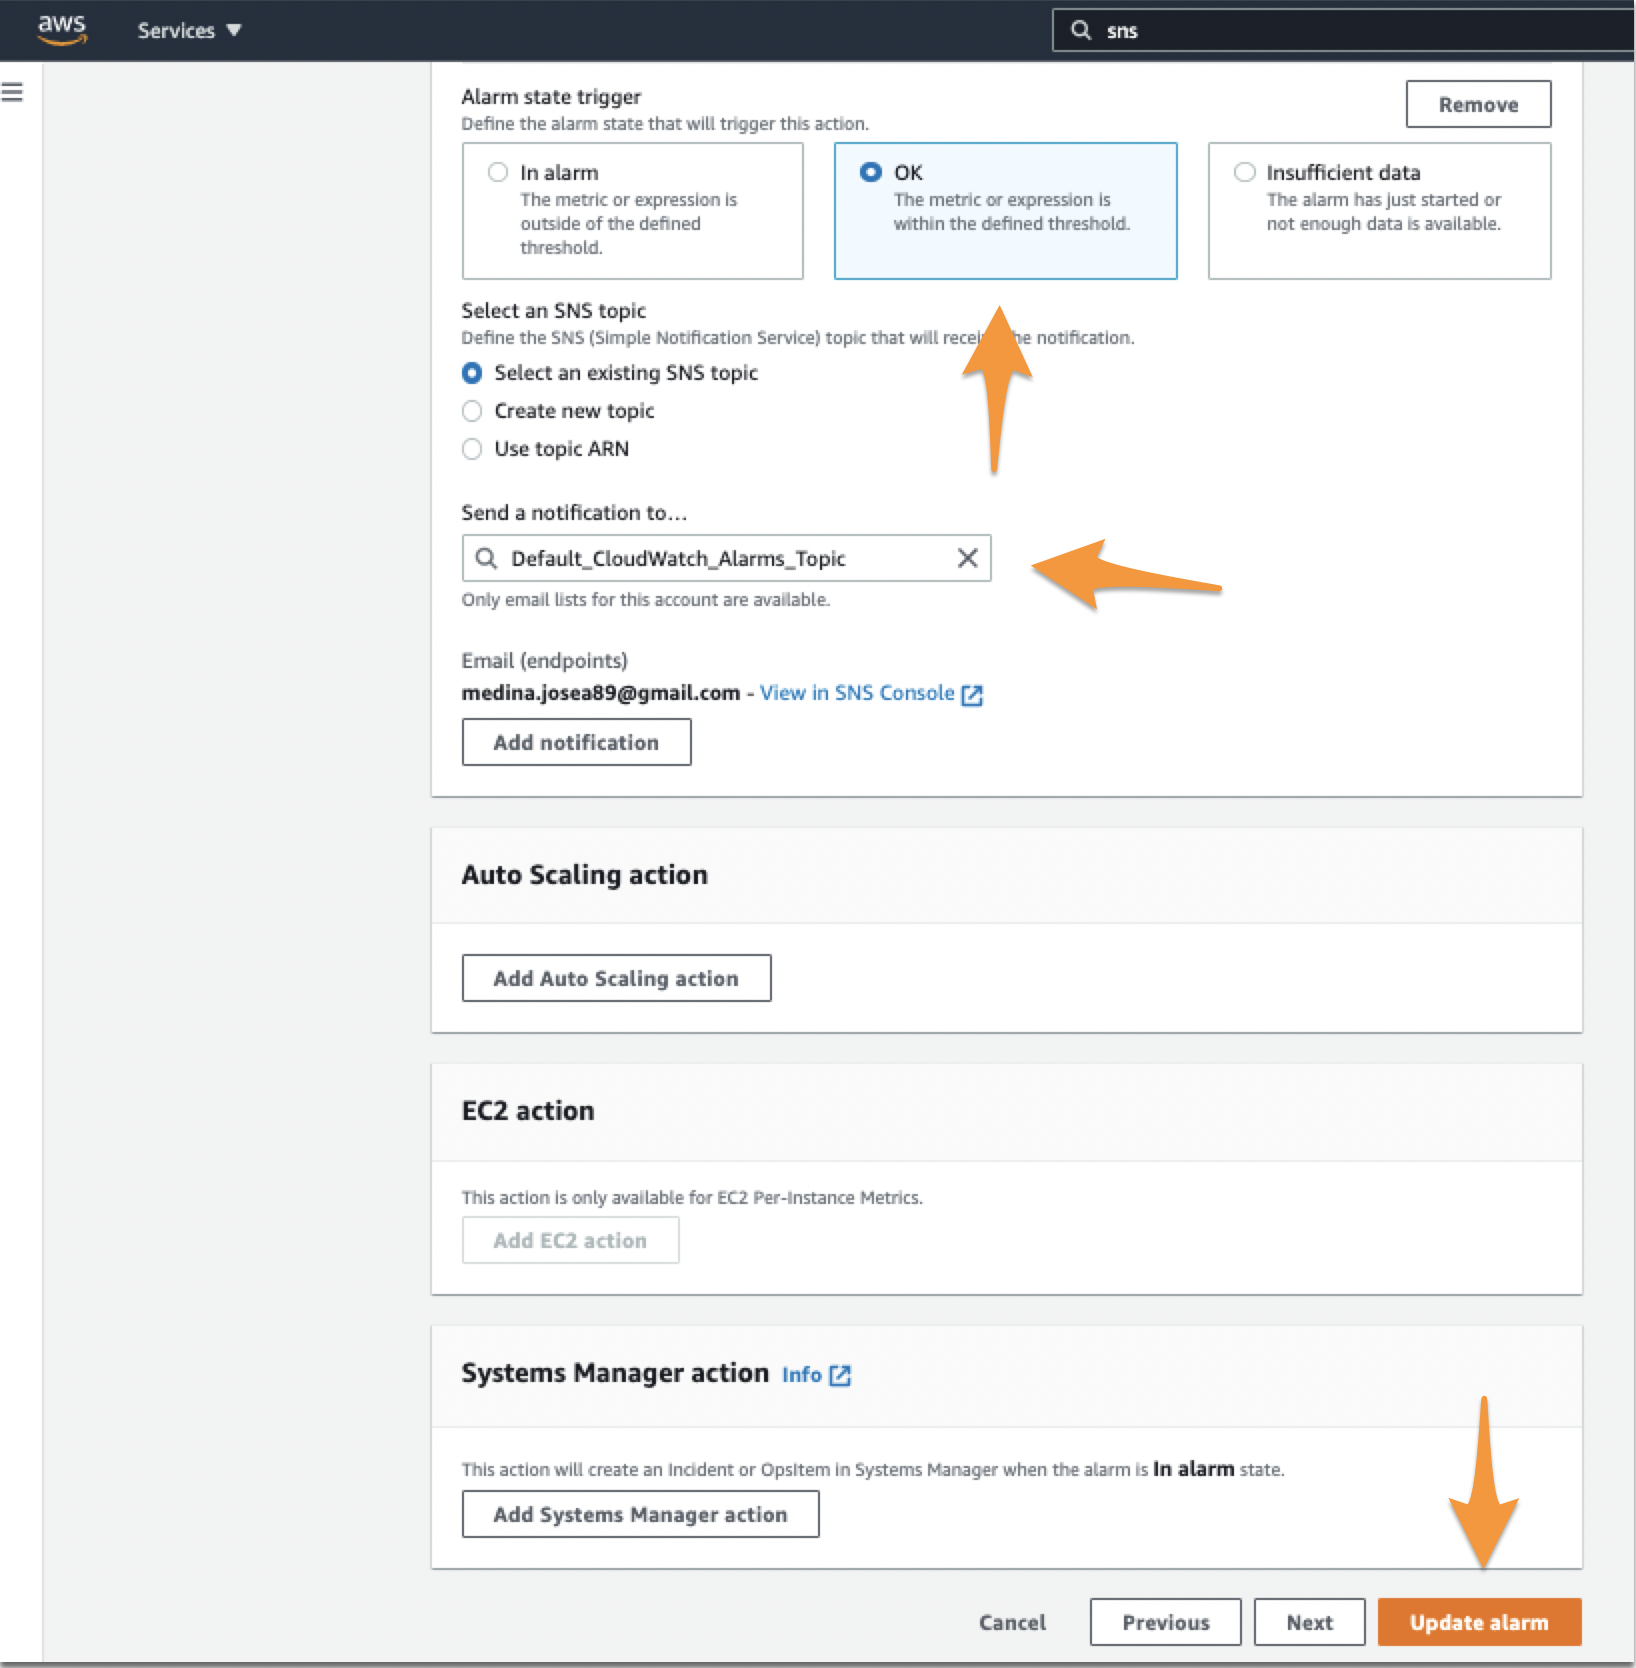
When you make sure you add that second notification, if the event ‘In-Alert’ event that triggered in AWS resolves itself, it will send an OK (or Recovery) alert to Splunk On-Call, resolving the incident on SpOC’s end.
Required and Custom Fields
For advanced users looking to tailor their Cloudwatch integration, there are a few mandates which must be considered. Alerts reaching the Cloudwatch alerting endpoint do need to have a basic form. There are three fields which must be present within the message sent from CloudWatch:
- AlarmName – This field can be any string and will map to the entity_id. Since the entity_id is the field used to link different alerts together, it is important to maintain a consistent naming convention for each incident.
- NewStateValue – This field, populated by Cloudwatch, should be either “ALARM”, triggering a critical incident; or “OK” resolving an incident.
- StateChangeTime – This field, also populated by Cloudwatch, will map to the timestamp used in Splunk On-Call.
Additionally, custom fields can be added to any message payload so long as the required three fields are present and valid.
The post AWS CloudWatch Integration Guide – VictorOps appeared first on Knowledge Base.
]]>