Want to dive deeper? Check out our infrastructure related blog posts.
The post How GitHub engineers tackle platform problems appeared first on The GitHub Blog.
]]>In my spare time I enjoy building Gundam models, which are model kits to build iconic mechas from the Gundam universe. You might be wondering what this has to do with software engineering. Product engineers can be seen as the engineers who take these kits and build the Gundam itself. They are able to utilize all pieces and build a working product that is fun to collect or even play with!
Platform engineers, on the other hand, supply the tools needed to build these kits (like clippers and files) and maybe even build a cool display so everyone can see the final product. They ensure that whoever is constructing it has all the necessary tools, even if they don’t physically build the Gundam themselves.

About a year ago, my team at GitHub moved to the infrastructure organization, inheriting new roles and Areas of Responsibility (AoRs). Previously, the team had tackled external customer problems, such as building the new deployment views across environments. This involved interacting with users who depend on GitHub to address challenges within their respective industries. Our new customers as a platform engineering team are internal, which makes our responsibilities different from the product-focused engineering work we were doing before.
Going back to my Gundam example, rather than constructing kits, we’re now responsible for building the components of the kits. Adapting to this change meant I had to rethink my approach to code testing and problem solving.
Whether you’re working on product engineering or on the platform side, here are a few best practices to tackle platform problems.
Understanding your domain
One of the most critical steps before tackling problems is understanding the domain. A “domain” is the business and technical subject area in which a team and platform organization operate. This requires gaining an understanding of technical terms and how these systems interact to provide fast and reliable solutions. Here’s how to get up to speed:
- Talk to your neighbors: Arrange a handover meeting with a team that has more knowledge and experience with the subject matter. This meeting provides an opportunity to ask questions about terminology and gain a deeper understanding of the problems the team will be addressing.
- Investigate old issues: If there is a backlog of issues that are either stale or still persistent, they may give you a better understanding of the system’s current limitations and potential areas for improvement.
- Read the docs: Documentation is a goldmine of knowledge that can help you understand how the system works.
Bridging concepts to platform-specific skills
While the preceding advice offers general guidance applicable to both product and platform teams, platform teams — serving as the foundational layer — necessitate a more in-depth understanding.
- Networks: Understanding network fundamentals is crucial for all engineers, even those not directly involved in network operations. This includes concepts like TCP, UDP, and L4 load balancing, as well as debugging tools such as dig. A solid grasp of these areas is essential to comprehend how network traffic impacts your platform.
- Operating systems and hardware: Selecting appropriate virtual machines (VMs) or physical hardware is vital for both scalability and cost management. Making well-informed choices for particular applications requires a strong grasp of both. This is closely linked to choosing the right operating system for your machines, which is important to avoid systems with vulnerabilities or those nearing end of life.
- Infrastructure as Code (IaC): Automation tools like Terraform, Ansible, and Consul are becoming increasingly essential. Proficiency in these tools is becoming a necessity as they significantly decrease human error during infrastructure provisioning and modifications.
- Distributed systems: Dealing with platform issues, particularly in distributed systems, necessitates a deep understanding that failures are inevitable. Consequently, employing proactive solutions like failover and recovery mechanisms is crucial for preserving system reliability and preventing adverse user experiences. The optimal approach for this depends entirely on the specific problem and the desired system behavior.
Knowledge sharing
By sharing lessons and ideas, engineers can introduce new perspectives that lead to breakthroughs and innovations. Taking the time to understand why a project or solution did or didn’t work and sharing those findings provides new perspectives that we can use going forward.
Here are three reasons why knowledge sharing is so important:
- Teamwork makes the dream work: Collaboration often results in quicker problem resolution and fosters new solution innovation, as engineers have the opportunity to learn from each other and expand upon existing ideas.
- Prevent lost knowledge: If we don’t share our lessons learned, we prevent the information from being disseminated across the team or organization. This becomes a problem if an engineer leaves the company or is simply unavailable.
- Improve our customer success: As engineers, our solutions should effectively serve our customers. By sharing our knowledge and lessons learned, we can help the team build reliable, scalable, and secure platforms, which will enable us to create better products that meet customer needs and expectations!
But big differences start to appear between product engineering and infrastructure engineering when it comes to the impact radius and the testing process.
Impact radius
With platforms being the fundamental building blocks of a system, any change (small or large) can affect a wide range of products. Our team is responsible for DNS, a foundational service that impacts numerous products. Even a minor alteration to this service can have extensive repercussions, potentially disrupting access to content across our site and affecting products ranging from GitHub Pages to GitHub Copilot.
- Understand the radius: Or understand the downstream dependencies. Direct communication with teams that depend on our service provides valuable insights into how proposed changes may affect other services.
- Postmortems: By looking at past incidents related to our platform and asking “What is the impact of this incident?”, we can form more context around what change or failure was introduced, how our platform played a role in it, and how it was fixed.
- Monitoring and telemetry: Condense important monitoring and logging into a small and quickly digestible medium to give you the general health of the system. This could be a Single Availability Metric (SAM), for example. The ability to quickly glance at a single dashboard allows engineers to rapidly pinpoint the source of an issue and streamlines the debugging and incident mitigation process, as compared to searching through and interpreting detailed monitors or log messages.
Testing changes
Testing changes in a distributed environment can be challenging, especially for services like DNS. A crucial step in solving this issue is utilizing a test site as a “real” machine where you can implement and assess all your changes.
- Infrastructure as Code (IaC): When using tools like Terraform or Ansible, it’s crucial to test fundamental operations like provisioning and deprovisioning machines. There are circumstances where a machine will need to be re-provisioned. In these cases, we want to ensure the machine is not accidentally deleted and that we retain the ability to create a new one if needed.
- End-to-End (E2E): Begin directing some network traffic to these servers. Then the team can observe host behavior by directly interacting with it, or we can evaluate functionality by diverting a small portion of traffic.
- Self-healing: We want to test the platform’s ability to recover from unexpected loads and identify bottlenecks before they impact our users. Early identification of bottlenecks or bugs is crucial for maintaining the health of our platform.
Ideally changes will be implemented on a host-by-host basis once testing is complete. This approach allows for individual machine rollback and prevents changes from being applied to unaffected hosts.
What to remember
Platform engineering can be difficult. The systems GitHub operates with are complex and there are a lot of services and moving parts. However, there’s nothing like seeing everything come together. All the hard work our engineering teams do behind the scenes really pays off when the platform is running smoothly and teams are able to ship faster and more reliably — which allows GitHub to be the home to all developers.
The post How GitHub engineers tackle platform problems appeared first on The GitHub Blog.
]]>The post How GitHub reduced testing time for iOS apps with new runner features appeared first on The GitHub Blog.
]]>GitHub Actions 🤝 GitHub for iOS
The GitHub iOS and GitHub Actions macOS runner teams are integral parts of each other’s development inner loop. Each team partners on testing new runner images and hardware long before the features land in the hands of developers. GitHub Actions has been working hard at bringing the latest Mac hardware to the community. Apple silicon (M1) macOS runners are available for free in public repositories, along with larger options available for those jobs that need more performance.
The GitHub iOS team has been busy improving the user experience in the app, recently shipping such as GitHub Copilot Chat, code search, localization for German and Korean, and making it easier to work with issues and projects. In this blog, we will discuss how the GitHub iOS team brings the app to developers around the world, the benefits of Apple silicon, and building on GitHub Actions using macOS runners.
How GitHub reduced testing time for iOS apps with new runner features
The GitHub iOS team previously used a single workflow with one job to build and test the entire codebase on GitHub Actions that took 38 minutes to complete with the prior generation runners. The GitHub iOS app consists of about 60 first-party modules, consisting of various targets, such as dynamic frameworks, static libraries, app extensions, or the GitHub app itself. These modules range from networking layers to design system components to entire features or products, helping us maintain the app.
Breaking down the monolith
We decided to leverage the power of Apple silicon to speed up their testing process. We switched to M1 macOS runners (macos-14-xlarge YAML label) on GitHub Actions and split their test suite into separate jobs for each module. This way, they could build and test each module independently and get faster feedback. Some of the smallest modules completed their tests in as little as 2-3 minutes on M1 macOS runners, getting feedback to developers on their pull requests faster than ever before. This also made it easier to identify and fix failures on specific modules without waiting for a monolithic build to finish.
By using Apple silicon, we reduced their testing time by 60%, from 38 minutes to 15 minutes, and improved our productivity and efficiency. The figure below demonstrates how we broke down the monolith into small modules in order to improve our build times.

As each build is kicked off, GitHub Actions is behind the scenes preparing the required number of machines to execute the workflow. Each request is sent to the GitHub Actions service where it picks up a freshly reimaged virtual machine to execute the required number of jobs. The figure below shows how a request travels from our repository to the Actions Mac servers in Azure.

With shorter build times and a scaling CI fleet, Apple silicon hosts allowed the GitHub iOS team to scale their jobs out across many shorter, faster steps, with GitHub Actions abstracting over the complexity of distributing CI jobs.
Analyzing CI performance
We further investigated the CI performance and divided each module’s CI into two separate steps, build and test, using xcodebuild’s build-without-testing and test-without-building. This helped us identify unit tests that ran for a long time or highlighted fast unit tests that finished in seconds.
Native development and test environments
With Apple silicon powering GitHub Actions runners and the developers’ laptops, our CI now had the same architecture as local development machines. Engineers could identify patterns that took a long time to compile or tests that failed due to the architecture from CI and fix them locally with confidence.
Benefits of Apple silicon
Apple silicon improves build performance, increases reliability, and lets iOS teams test natively for all Apple platforms throughout the software development lifecycle. They can avoid problems from cross-compilation or emulation and use the latest simulators on our GitHub Actions runner image. This ensures that their apps work well with the newest versions of iOS, iPadOS, watchOS, and tvOS. Our GitHub Actions M1 macOS runners help iOS teams leverage these benefits and deliver high-quality apps to their users faster and more efficiently. Additionally, GitHub Actions offers 50 concurrent runners for enterprise accounts and five for GitHub Free and Team plans. The GitHub for iOS team takes full advantage of these concurrent runners and initiates 50 jobs for every pull request to perform modular testing on the app in parallel.
Get started building on GitHub Actions using macOS runners
GitHub-hosted macOS runners are YAML-driven, meaning they are accessed by updating the runs on: key in your workflow file.
- Standard GitHub-hosted runners for Public repositories
- Standard GitHub-hosted runners for Private repositories
- macOS larger runners
The post How GitHub reduced testing time for iOS apps with new runner features appeared first on The GitHub Blog.
]]>The post Upgrading GitHub.com to MySQL 8.0 appeared first on The GitHub Blog.
]]>Over 15 years ago, GitHub started as a Ruby on Rails application with a single MySQL database. Since then, GitHub has evolved its MySQL architecture to meet the scaling and resiliency needs of the platform—including building for high availability, implementing testing automation, and partitioning the data. Today, MySQL remains a core part of GitHub’s infrastructure and our relational database of choice.
This is the story of how we upgraded our fleet of 1200+ MySQL hosts to 8.0. Upgrading the fleet with no impact to our Service Level Objectives (SLO) was no small feat–planning, testing and the upgrade itself took over a year and collaboration across multiple teams within GitHub.
Motivation for upgrading
Why upgrade to MySQL 8.0? With MySQL 5.7 nearing end of life, we upgraded our fleet to the next major version, MySQL 8.0. We also wanted to be on a version of MySQL that gets the latest security patches, bug fixes, and performance enhancements. There are also new features in 8.0 that we want to test and benefit from, including Instant DDLs, invisible indexes, and compressed bin logs, among others.
GitHub’s MySQL infrastructure
Before we dive into how we did the upgrade, let’s take a 10,000-foot view of our MySQL infrastructure:
- Our fleet consists of 1200+ hosts. It’s a combination of Azure Virtual Machines and bare metal hosts in our data center.
- We store 300+ TB of data and serve 5.5 million queries per second across 50+ database clusters.
- Each cluster is configured for high availability with a primary plus replicas cluster setup.
- Our data is partitioned. We leverage both horizontal and vertical sharding to scale our MySQL clusters. We have MySQL clusters that store data for specific product-domain areas. We also have horizontally sharded Vitess clusters for large-domain areas that outgrew the single-primary MySQL cluster.
- We have a large ecosystem of tools consisting of Percona Toolkit, gh-ost, orchestrator, freno, and in-house automation used to operate the fleet.
All this sums up to a diverse and complex deployment that needs to be upgraded while maintaining our SLOs.
Preparing the journey
As the primary data store for GitHub, we hold ourselves to a high standard for availability. Due to the size of our fleet and the criticality of MySQL infrastructure, we had a few requirements for the upgrade process:
- We must be able to upgrade each MySQL database while adhering to our Service Level Objectives (SLOs) and Service Level Agreements (SLAs).
- We are unable to account for all failure modes in our testing and validation stages. So, in order to remain within SLO, we needed to be able to roll back to the prior version of MySQL 5.7 without a disruption of service.
- We have a very diverse workload across our MySQL fleet. To reduce risk, we needed to upgrade each database cluster atomically and schedule around other major changes. This meant the upgrade process would be a long one. Therefore, we knew from the start we needed to be able to sustain operating a mixed-version environment.
Preparation for the upgrade started in July 2022 and we had several milestones to reach even before upgrading a single production database.
Prepare infrastructure for upgrade
We needed to determine appropriate default values for MySQL 8.0 and perform some baseline performance benchmarking. Since we needed to operate two versions of MySQL, our tooling and automation needed to be able to handle mixed versions and be aware of new, different, or deprecated syntax between 5.7 and 8.0.
Ensure application compatibility
We added MySQL 8.0 to Continuous Integration (CI) for all applications using MySQL. We ran MySQL 5.7 and 8.0 side-by-side in CI to ensure that there wouldn’t be regressions during the prolonged upgrade process. We detected a variety of bugs and incompatibilities in CI, helping us remove any unsupported configurations or features and escape any new reserved keywords.
To help application developers transition towards MySQL 8.0, we also enabled an option to select a MySQL 8.0 prebuilt container in GitHub Codespaces for debugging and provided MySQL 8.0 development clusters for additional pre-prod testing.
Communication and transparency
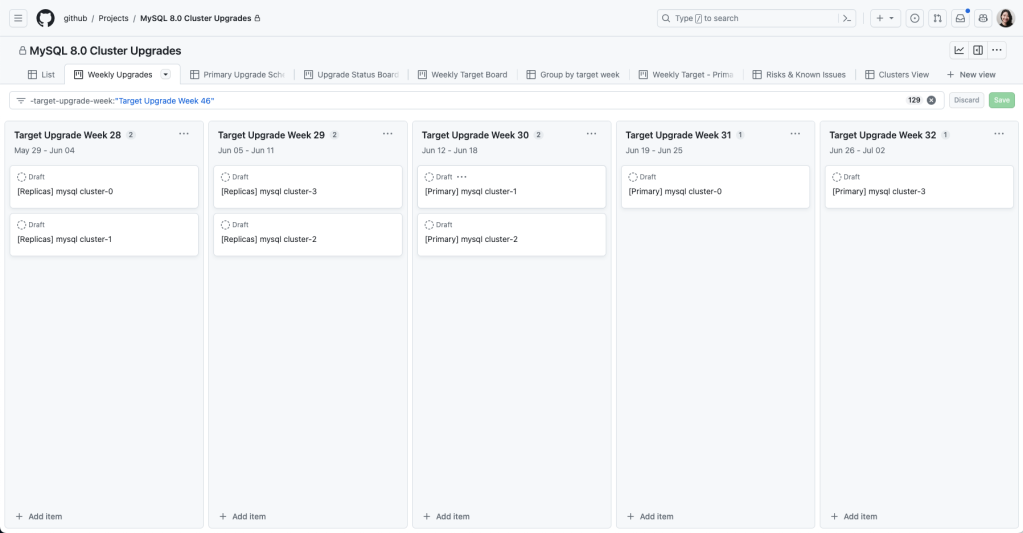
We used GitHub Projects to create a rolling calendar to communicate and track our upgrade schedule internally. We created issue templates that tracked the checklist for both application teams and the database team to coordinate an upgrade.
Upgrade plan
To meet our availability standards, we had a gradual upgrade strategy that allowed for checkpoints and rollbacks throughout the process.
Step 1: Rolling replica upgrades
We started with upgrading a single replica and monitoring while it was still offline to ensure basic functionality was stable. Then, we enabled production traffic and continued to monitor for query latency, system metrics, and application metrics. We gradually brought 8.0 replicas online until we upgraded an entire data center and then iterated through other data centers. We left enough 5.7 replicas online in order to rollback, but we disabled production traffic to start serving all read traffic through 8.0 servers.

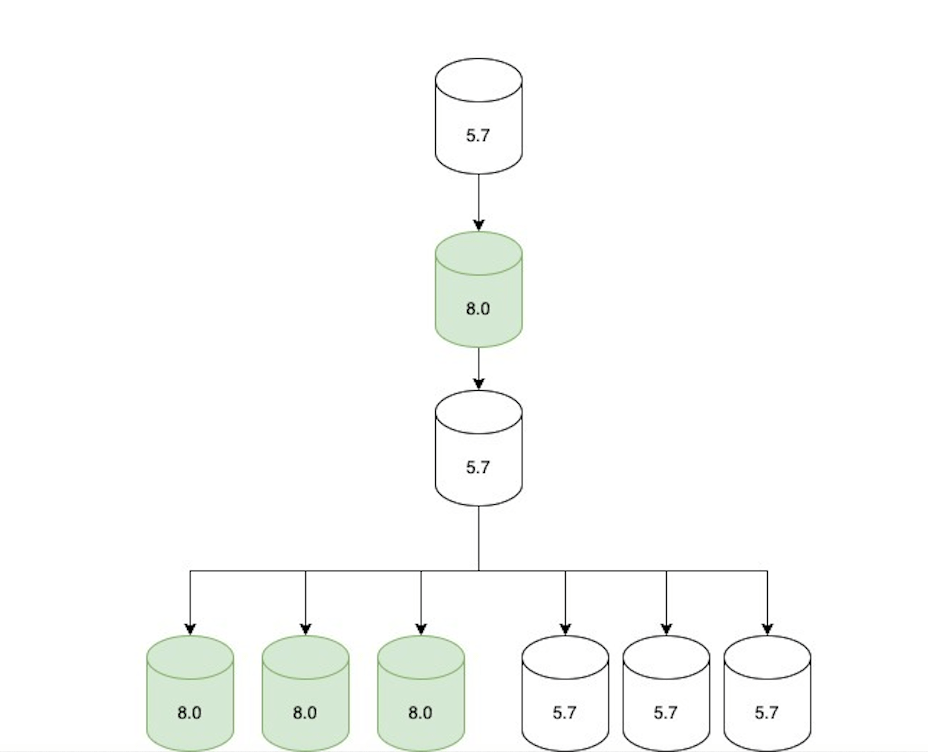
Step 2: Update replication topology
Once all the read-only traffic was being served via 8.0 replicas, we adjusted the replication topology as follows:
- An 8.0 primary candidate was configured to replicate directly under the current 5.7 primary.
- Two replication chains were created downstream of that 8.0 replica:
- A set of only 5.7 replicas (not serving traffic, but ready in case of rollback).
- A set of only 8.0 replicas (serving traffic).
- The topology was only in this state for a short period of time (hours at most) until we moved to the next step.
Step 3: Promote MySQL 8.0 host to primary
We opted not to do direct upgrades on the primary database host. Instead, we would promote a MySQL 8.0 replica to primary through a graceful failover performed with Orchestrator. At that point, the replication topology consisted of an 8.0 primary with two replication chains attached to it: an offline set of 5.7 replicas in case of rollback and a serving set of 8.0 replicas.
Orchestrator was also configured to blacklist 5.7 hosts as potential failover candidates to prevent an accidental rollback in case of an unplanned failover.
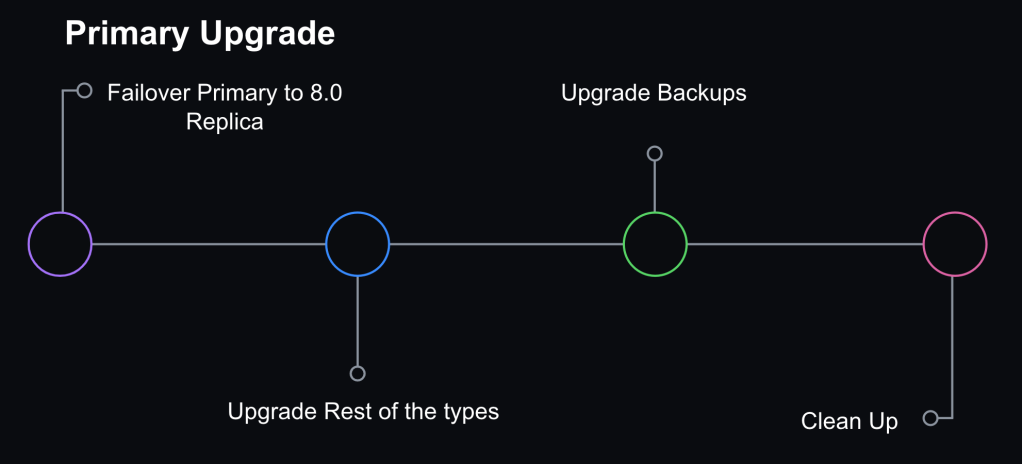
Step 4: Internal facing instance types upgraded
We also have ancillary servers for backups or non-production workloads. Those were subsequently upgraded for consistency.
Step 5: Cleanup
Once we confirmed that the cluster didn’t need to rollback and was successfully upgraded to 8.0, we removed the 5.7 servers. Validation consisted of at least one complete 24 hour traffic cycle to ensure there were no issues during peak traffic.
Ability to Rollback
A core part of keeping our upgrade strategy safe was maintaining the ability to rollback to the prior version of MySQL 5.7. For read-replicas, we ensured enough 5.7 replicas remained online to serve production traffic load, and rollback was initiated by disabling the 8.0 replicas if they weren’t performing well. For the primary, in order to roll back without data loss or service disruption, we needed to be able to maintain backwards data replication between 8.0 and 5.7.
MySQL supports replication from one release to the next higher release but does not explicitly support the reverse (MySQL Replication compatibility). When we tested promoting an 8.0 host to primary on our staging cluster, we saw replication break on all 5.7 replicas. There were a couple of problems we needed to overcome:
- In MySQL 8.0,
utf8mb4is the default character set and uses a more modernutf8mb4_0900_ai_cicollation as the default. The prior version of MySQL 5.7 supported theutf8mb4_unicode_520_cicollation but not the latest version of Unicodeutf8mb4_0900_ai_ci. - MySQL 8.0 introduces roles for managing privileges but this feature did not exist in MySQL 5.7. When an 8.0 instance was promoted to be a primary in a cluster, we encountered problems. Our configuration management was expanding certain permission sets to include role statements and executing them, which broke downstream replication in 5.7 replicas. We solved this problem by temporarily adjusting defined permissions for affected users during the upgrade window.
To address the character collation incompatibility, we had to set the default character encoding to utf8 and collation to utf8_unicode_ci.
For the GitHub.com monolith, our Rails configuration ensured that character collation was consistent and made it easier to standardize client configurations to the database. As a result, we had high confidence that we could maintain backward replication for our most critical applications.
Challenges
Throughout our testing, preparation and upgrades, we encountered some technical challenges.
What about Vitess?
We use Vitess for horizontally sharding relational data. For the most part, upgrading our Vitess clusters was not too different from upgrading the MySQL clusters. We were already running Vitess in CI, so we were able to validate query compatibility. In our upgrade strategy for sharded clusters, we upgraded one shard at a time. VTgate, the Vitess proxy layer, advertises the version of MySQL and some client behavior depends on this version information. For example, one application used a Java client that disabled the query cache for 5.7 servers—since the query cache was removed in 8.0, it generated blocking errors for them. So, once a single MySQL host was upgraded for a given keyspace, we had to make sure we also updated the VTgate setting to advertise 8.0.
Replication delay
We use read-replicas to scale our read availability. GitHub.com requires low replication delay in order to serve up-to-date data.
Earlier on in our testing, we encountered a replication bug in MySQL that was patched on 8.0.28:
Replication: If a replica server with the system variable
replica_preserve_commit_order= 1 set was used under intensive load for a long period, the instance could run out of commit order sequence tickets. Incorrect behavior after the maximum value was exceeded caused the applier to hang and the applier worker threads to wait indefinitely on the commit order queue. The commit order sequence ticket generator now wraps around correctly. Thanks to Zhai Weixiang for the contribution. (Bug #32891221, Bug #103636)
We happen to meet all the criteria for hitting this bug.
- We use
replica_preserve_commit_orderbecause we use GTID based replication. - We have intensive load for long periods of time on many of our clusters and certainly for all of our most critical ones. Most of our clusters are very write-heavy.
Since this bug was already patched upstream, we just needed to ensure we are deploying a version of MySQL higher than 8.0.28.
We also observed that the heavy writes that drove replication delay were exacerbated in MySQL 8.0. This made it even more important that we avoid heavy bursts in writes. At GitHub, we use freno to throttle write workloads based on replication lag.
Queries would pass CI but fail on production
We knew we would inevitably see problems for the first time in production environments—hence our gradual rollout strategy with upgrading replicas. We encountered queries that passed CI but would fail on production when encountering real-world workloads. Most notably, we encountered a problem where queries with large WHERE IN clauses would crash MySQL. We had large WHERE IN queries containing over tens of thousands of values. In those cases, we needed to rewrite the queries prior to continuing the upgrade process. Query sampling helped to track and detect these problems. At GitHub, we use Solarwinds DPM (VividCortex), a SaaS database performance monitor, for query observability.
Learnings and takeaways
Between testing, performance tuning, and resolving identified issues, the overall upgrade process took over a year and involved engineers from multiple teams at GitHub. We upgraded our entire fleet to MySQL 8.0 – including staging clusters, production clusters in support of GitHub.com, and instances in support of internal tools. This upgrade highlighted the importance of our observability platform, testing plan, and rollback capabilities. The testing and gradual rollout strategy allowed us to identify problems early and reduce the likelihood for encountering new failure modes for the primary upgrade.
While there was a gradual rollout strategy, we still needed the ability to rollback at every step and we needed the observability to identify signals to indicate when a rollback was needed. The most challenging aspect of enabling rollbacks was holding onto the backward replication from the new 8.0 primary to 5.7 replicas. We learned that consistency in the Trilogy client library gave us more predictability in connection behavior and allowed us to have confidence that connections from the main Rails monolith would not break backward replication.
However, for some of our MySQL clusters with connections from multiple different clients in different frameworks/languages, we saw backwards replication break in a matter of hours which shortened the window of opportunity for rollback. Luckily, those cases were few and we didn’t have an instance where the replication broke before we needed to rollback. But for us this was a lesson that there are benefits to having known and well-understood client-side connection configurations. It emphasized the value of developing guidelines and frameworks to ensure consistency in such configurations.
Prior efforts to partition our data paid off—it allowed us to have more targeted upgrades for the different data domains. This was important as one failing query would block the upgrade for an entire cluster and having different workloads partitioned allowed us to upgrade piecemeal and reduce the blast radius of unknown risks encountered during the process. The tradeoff here is that this also means that our MySQL fleet has grown.
The last time GitHub upgraded MySQL versions, we had five database clusters and now we have 50+ clusters. In order to successfully upgrade, we had to invest in observability, tooling, and processes for managing the fleet.
Conclusion
A MySQL upgrade is just one type of routine maintenance that we have to perform – it’s critical for us to have an upgrade path for any software we run on our fleet. As part of the upgrade project, we developed new processes and operational capabilities to successfully complete the MySQL version upgrade. Yet, we still had too many steps in the upgrade process that required manual intervention and we want to reduce the effort and time it takes to complete future MySQL upgrades.
We anticipate that our fleet will continue to grow as GitHub.com grows and we have goals to partition our data further which will increase our number of MySQL clusters over time. Building in automation for operational tasks and self-healing capabilities can help us scale MySQL operations in the future. We believe that investing in reliable fleet management and automation will allow us to scale github and keep up with required maintenance, providing a more predictable and resilient system.
The lessons from this project provided the foundations for our MySQL automation and will pave the way for future upgrades to be done more efficiently, but still with the same level of care and safety.
The post Upgrading GitHub.com to MySQL 8.0 appeared first on The GitHub Blog.
]]>The post How GitHub uses GitHub Actions and Actions larger runners to build and test GitHub.com appeared first on The GitHub Blog.
]]>Read on to see how we run 15,000 CI jobs within an hour across 150,000 cores of compute!
Brief history of CI at GitHub
GitHub has invested in a variety of different CI systems throughout its history. With each system, our aim has been to enhance the development experience for both GitHub engineers writing and deploying code and for engineers maintaining the systems.
However, with past CI systems we faced challenges with scaling the system to meet the needs of our engineering team to provide both stable and ephemeral build environments. Neither of these challenges allowed us to provide the optimal developer experience.
Then, GitHub released GitHub Actions larger runners. This gave us an opportunity not only to transition to a fully featured CI system, but also to develop, experience, and utilize the systems we are creating for our customers and to drive feedback to help build the product. For the GitHub DX team, this transition was a great opportunity to move away from maintaining our past CI systems while delivering a superior developer experience.
What are larger runners?
Larger runners are GitHub Actions runners that are hosted by GitHub. They are managed virtual machines (VMs) with more RAM, CPU, and disk space than standard GitHub-hosted runners. There are a variety of different machine sizes offered for the runners as well as some additional features compared to the standard GitHub-hosted runners.
Larger runners are available to GitHub Team and GitHub Enterprise Cloud customers. Check out these docs to learn more about larger runners.
Why did we pick larger runners?
Autoscaling and managed
Coming from previous iterations of GitHub’s CI systems, we needed the ability to create CI machines on demand to meet the fast feedback cycles needed by GitHub engineers and to scale with the rate of change of the site.
With larger runners, we maintain the ability to autoscale our CI system because GitHub will automatically create multiple instances of a runner that scale up and down to match the job demands of our engineers. An added benefit is that the GitHub DX team no longer has to worry about the scaling of the runners since all of those complexities are handled by GitHub itself!
We wanted to share some raw numbers on our current peak utilization of larger runners:
- Uses 4,500 concurrent 32-core runners
- Runs 125,000 build minutes per hour
- Queues and runs approximately 15,000 jobs within an hour
- Allocates around 150,000 cores of compute
(Beta) Custom VM image support
GitHub Actions provides runners with a lot of tools already baked in, which is sufficient and convenient for a variety of projects across the company. However, for some complex production GitHub services, the prebuilt runners did not satisfy all our requirements.
To maintain an efficient and fast CI system, the DX team needed the ability to provide machines with all the tools needed to build those production services. We didn’t want to spend extra time installing tools or compiling projects during CI jobs.
We are currently building features into larger runners so they have the ability to be launched from a custom VM image, called custom images. While this feature is still in beta, using custom images is a huge benefit to GitHub’s CI lifecycle for a couple of reasons.
First, custom images allows GitHub to bundle all the required software and tools needed to build and test complex production bearing services. Anything that is unique to GitHub or one of our projects can be pre-installed on the image before a GitHub Actions workflow even starts.
Second, custom images enable GitHub to dramatically speed up our GitHub Actions workflows by acting as a bootstrapping cache for some projects. During custom image creation, we bundle a pre-built version of a project’s source code into the image. Subsequently, when the project starts a GitHub Actions workflow, it can utilize a cached version of its source code, and any other build artifacts, to speed up its build process.
The cached project source code on the custom VM image can quickly become out of date due to the rapid rate of development within GitHub. This, in turn, causes workflow durations to increase. The DX team worked with the GitHub Actions engineering team to create an API on GitHub to regularly update the custom image multiple times a day to keep the project source up to date.
In practice, this has reduced the bootstrapping time of our projects significantly. Without custom images, our workflows would take around 50 minutes from start to finish, versus the 12 minutes they take today. This is a game changer for our engineers.
We’re working on a way to offer this functionality at scale. If you are interested in custom images for your CI/CD workflows, please reach out to your account manager to learn more!
Important GitHub Actions features
There are thousands of projects at GitHub — from services that run production workloads to small tools that need to run CI to perform their daily operations. To make this a reality, GitHub leverages several important features in GitHub Actions that enable us to use the platform efficiently and securely across the company at scale.
Reusable workflows
One of the DX team’s driving goals is to pave paths for all repositories to run CI without introducing unnecessary repetition across repositories. Prior to GitHub Actions, we created single job configurations that could be used across multiple projects. In GitHub Actions, this was not as easy because any repository can define its own workflows. Reusable workflows to the rescue!
The reusable workflows feature in GitHub Actions provides a way to centrally manage a workflow in a repository that can be utilized by many other repositories in an organization. This was critical in our transition from our previous CI system to GitHub Actions. We were able to create several prebuilt workflows in a single repository, and many repositories could then use those workflows. This makes the process of adding CI to an existing or new project very much plug and play.
In our central repository hosting our reusable workflows, we can have workflows defined like:
on:
  workflow_call:
    inputs:
      cibuild-script:
        description: 'Which cibuild script to run.'
        type: string
        required: false
        default: "script/cibuild"
    secrets:
      service-api-key:
        required: true

jobs:
  reusable_workflow_job:
    runs-on: gh-larger-runner-medium
    name: Simple Workflow Job
    timeout-minutes: 20
    steps:
      - name: Checkout Project
        uses: actions/checkout@v3
      - name: Run cibuild script
        run: |
          bash ${{ inputs.cibuild-script }}
        shell: bash
And in consuming repositories, they can simply utilize the reusable workflow, with just a few lines of code!
name: my-new-project
on:
  workflow_dispatch:
  push:

jobs:
  call-reusable-workflow:
    uses: github/internal-actions/.github/workflows/default.yml@main
    with:
      cibuild-script: "script/cibuild-my-tests"
    secrets:
      service-api-key: ${{ secrets.SERVICE_API_KEY }}
Another great benefit of the reusable workflows feature is that the runner can be defined in the Reusable Workflow, meaning that we can guarantee all users of the workflow will run on our designated larger runner pool. Now, projects don’t need to worry about which runner they need to use!
(Beta) Reusing previous workflow outcomes
To optimize our developer experience, the DX team worked with our engineering team to create a feature for GitHub Actions that allows workflows to reuse the outcome of a previous workflow run where the outcomes would be the same.
In some cases, the file contents of a repository are exactly the same between workflow runs that run on different commits. That is, the Git tree IDs for the current commit is the same as the previous commit (there are no file differences). In these cases, we can bypass CI checks by reusing the previous workflow outcomes and allow engineers to not have to wait for CI to run again.
This feature saves GitHub engineers from running anywhere from 300 to 500 workflows runs a day!
Other challenges faced
Private service access
During some internal GitHub Actions workflow runs, the workflows need the ability to access some GitHub private services, within a GitHub virtual private cloud (VPC), over the network. These could be resources such as artifact storage, application metadata services, and other services that enable invocation of our test harness.
When we moved to larger runners, this requirement to access private services became a top-of-mind concern. In previous iterations of our CI infrastructure, these private services were accessible through other cloud and network configurations. However, larger runners are isolated from other production environments, meaning they cannot access our private services.
Like all companies, we need to focus on both the security of our platform as well as the developer experience. To satisfy these two requirements, GitHub developed a remote access solution that allows clients residing outside of our VPCs (larger runners) to securely access select private services.
This remote access solution works on the principle of minting an OIDC token in GitHub Actions, passing the OIDC token to a remote access gateway that authorizes the request by validating the OIDC token, and then proxying the request to the private service residing in a private network.
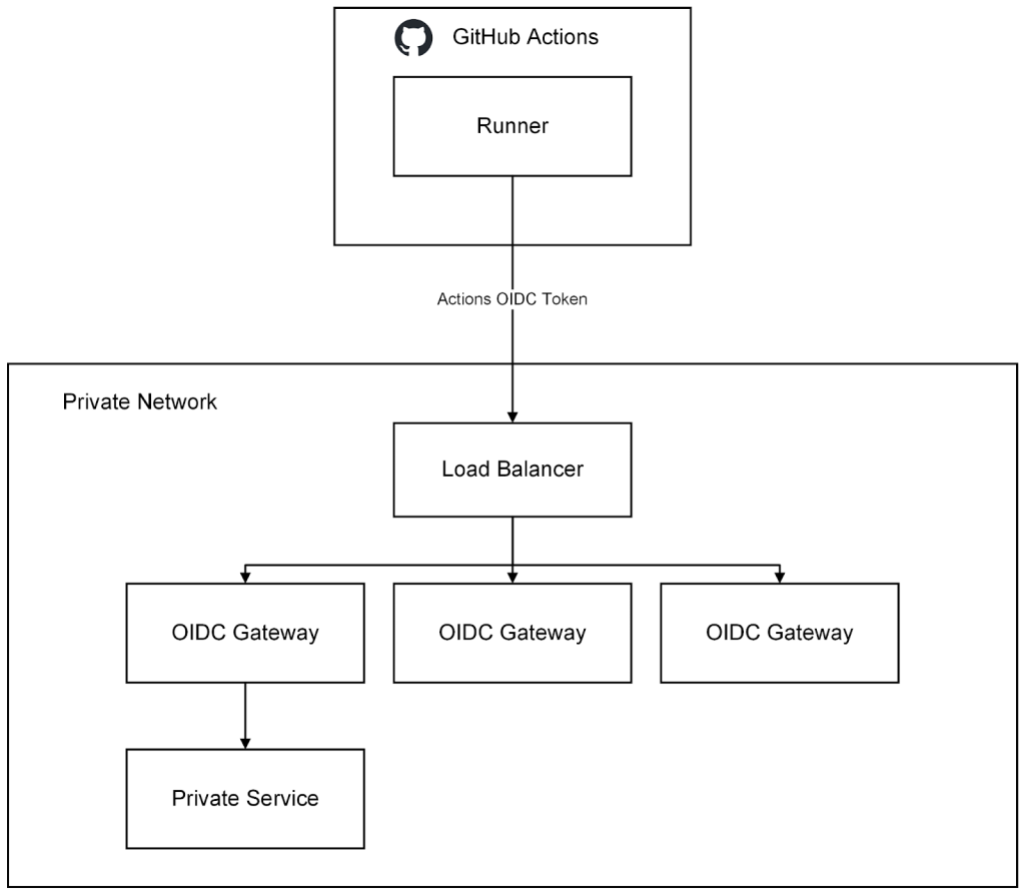
With this solution we are able to securely provide remote access from larger runners running GitHubActions to our private resources within our VPC.
GitHub has open sourced the basic scaffolding of this remote access gateway in the github/actions-oidc-gateway-example repository, so be sure to check it out!
Conclusion
GitHub Actions provides a robust and smooth developer experience for GitHub engineers working on GitHub.com. We have been able to accomplish this by using the power of GitHub Actions features, such as reusable workflows and reusable workflow outcomes, and by leveraging the scalability and manageability of the GitHub Actions larger runners. We have also used this effort to enhance the GitHub Actions product. To put it simply, GitHub runs on GitHub.
- Level up your GitHub Actions skillset with our learning pathways on automation.
- Explore how investing in a better developer experience frees developers to do what matters most: building great software.
- Learn how generative AI is changing the developer experience.
- Modernize your software development environment and transform your business with GitHub.
The post How GitHub uses GitHub Actions and Actions larger runners to build and test GitHub.com appeared first on The GitHub Blog.
]]>The post Scaling merge-ort across GitHub appeared first on The GitHub Blog.
]]>Our requirements for a merge strategy
There are a few non-negotiable parts of any merge strategy we want to employ:
- It has to be fast. At GitHub’s scale, even a small slowdown is multiplied by the millions of activities going on in repositories we host each day.
- It has to be correct. For merge strategies, what’s “correct” is occasionally a matter of debate. In those cases, we try to match what users expect (which is often whatever the Git command line does).
- It can’t check out the repository. There are both scalability and security implications to having a working directory, so we simply don’t.
Previously, we used libgit2 to tick these boxes: it was faster than Git’s default merge strategy and it didn’t require a working directory. On the correctness front, we either performed the merge or reported a merge conflict and halted. However, because of additional code related to merge base selection, sometimes a user’s local Git could easily merge what our implementation could not. This led to a steady stream of support tickets asking why the GitHub web UI couldn’t merge two files when the local command line could. We weren’t meeting those users’ expectations, so from their perspective, we weren’t correct.
A new strategy emerges
Two years ago, Git learned a new merge strategy, merge-ort. As the author details on the mailing list, merge-ort is fast, correct, and addresses many shortcomings of the older default strategy. Even better, unlike merge-recursive, it doesn’t need a working directory. merge-ort is much faster even than our optimized, libgit2-based strategy. What’s more, merge-ort has since become Git’s default. That meant our strategy would fall even further behind on correctness.
It was clear that GitHub needed to upgrade to merge-ort. We split this effort into two parts: first deploy merge-ort for merges, then deploy it for rebases.
merge-ort for merges
Last September, we announced that we’re using merge-ort for merge commits. We used Scientist to run both code paths in production so we can compare timing, correctness, etc. without risking much. The customer still gets the result of the old code path, while the GitHub feature team gets to compare and contrast the behavior of the new code path. Our process was:
- Create and enable a Scientist experiment with the new code path.
- Roll it out to a fraction of traffic. In our case, we started with some GitHub-internal repositories first before moving to a percentage-based rollout across all of production.
- Measure gains, check correctness, and fix bugs iteratively.
We saw dramatic speedups across the board, especially on large, heavily-trafficked repositories. For our own github/github monolith, we saw a 10x speedup in both the average and P99 case. Across the entire experiment, our P50 saw the same 10x speedup and P99 case got nearly a 5x boost.
merge-ort for rebases
Like merges, we also do a huge number of rebases. Customers may choose rebase workflows in their pull requests. We also perform test rebases and other “behind the scenes” operations, so we also brought merge-ort to rebases.
This time around, we powered rebases using a new Git subcommand: git-replay. git replay was written by the original author of merge-ort, Elijah Newren (a prolific Git contributor). With this tool, we could perform rebases using merge-ort and without needing a worktree. Once again, the path was pretty similar:
- Merge
git-replayinto our fork of Git. (We were running the experiment with Git 2.39, which didn’t include thegit-replayfeature.) - Before shipping, leverage our test suite to detect discrepancies between the old and the new implementations.
- Write automation to flush out bugs by performing test rebases of all open pull requests in
github/githuband comparing the results. - Set up a Scientist experiment to measure the performance delta between
libgit2-powered rebases and monitor for unexpected mismatches in behavior. - Measure gains, check correctness, and fix bugs iteratively.
Once again, we were amazed at the results. The following is a great anecdote from testing, as relayed by @wincent (one of the GitHub engineers on this project):
Another way to think of this is in terms of resource usage. We ran the experiment over 730k times. In that interval, our computers spent 2.56 hours performing rebases with
libgit2, but under 10 minutes doing the same work withmerge-ort. And this was running the experiment for 0.5% of actors. Extrapolating those numbers out to 100%, if we had done all rebases during that interval withmerge-ort, it would have taken us 2,000 minutes, or about 33 hours. That same work done withlibgit2would have taken 512 hours!
What’s next
While we’ve covered the most common uses, this is not the end of the story for merge-ort at GitHub. There are still other places in which we can leverage its superpowers to bring better performance, greater accuracy, and improved availability. Squashing and reverting are on our radar for the future, as well as considering what new product features it could unlock down the road.
Appreciation
Many thanks to all the GitHub folks who worked on these two projects. Also, GitHub continues to be grateful for the hundreds of volunteer contributors to the Git open source project, including Elijah Newren for designing, implementing, and continually improving merge-ort.
The post Scaling merge-ort across GitHub appeared first on The GitHub Blog.
]]>The post Experiment: The hidden costs of waiting on slow build times appeared first on The GitHub Blog.
]]>When you ask a developer whether they’d prefer more or less powerful hardware, the answer is almost always the same: they want more powerful hardware. That’s because more powerful hardware means less time waiting on builds—and that means more time to build the next feature or fix a bug.
But even if the upfront cost is higher for higher-powered hardware, what’s the actual cost when you consider the impact on developer productivity?
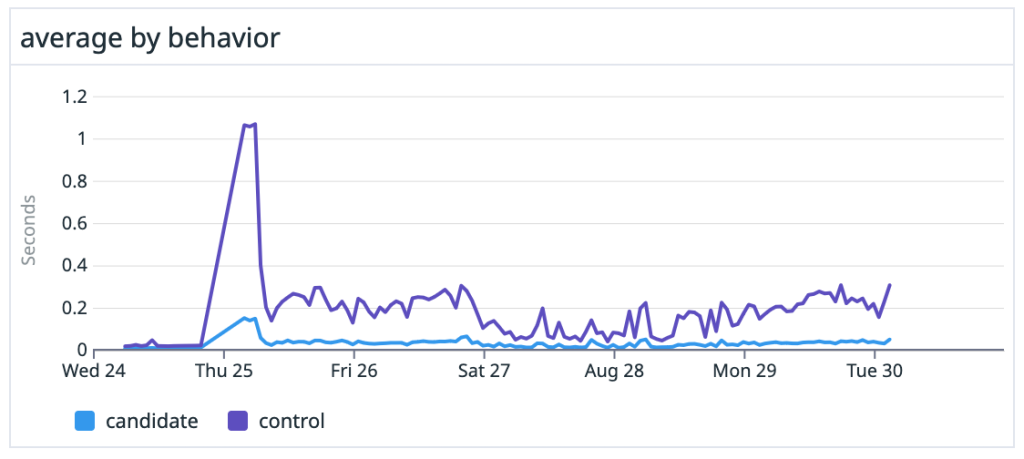
To find out, I set up an experiment using GitHub’s new, larger hosted runners, which offer powerful cloud-based compute resources, to execute a large build at each compute tier from 2 cores to 64 cores. I wanted to see what the cost of each build time would be, and then compare that with the average hourly cost of a United States-based developer to figure out the actual operational expense for a business.
The results might surprise you.
Testing build times vs. cost by core size on compute resources
For my experiment, I used my own personal project where I compile the Linux kernel (seriously!) for Fedora 35 and Fedora 36. For background, I need a non-standard patch to play video games on my personal desktop without having to deal with dual booting.
Beyond being a fun project, it’s also a perfect case study for this experiment. As a software build, it takes a long time to run—and it’s a great proxy for more intensive software builds developers often navigate at work.
Now comes the fun part: our experiment. Like I said above, I’m going to initiate builds of this project at each compute tier from 2 cores to 64 cores, and then determine how long each build takes and its cost on GitHub’s larger runners. Last but not least: I’ll compare how much time we save during the build cycle and square that with how much more time developers would have to be productive to find the true business cost.
The logic here is that developers could either be waiting the entire time a build runs or end up context-switching to work on something else while a build runs. Both of these impact overall productivity (more on this below).
To simplify my calculations, I took the average runtimes of two builds per compute tier.
| Pro tip: You can find my full spreadsheet for these calculations here if you want to copy it and play with the numbers yourself using other costs, times for builds, developer salaries, etc. |
How much slow build times cost companies
In scenario number one of our experiment, we’ll assume that developers may just wait for a build to run and do nothing else during that time frame. That’s not a great outcome, but it happens.
So, what does this cost a business? According to StackOverflow’s 2022 Developer Survey, the average annual cost of a developer in the United States is approximately $150,000 per year including fringe benefits, taxes, and so on. That breaks down to around $75 (USD) an hour. In short, if a developer is waiting on a build to run for one hour and doing nothing in that timeframe, the business is still spending $75 on average for that developer’s time—and potentially losing out on time that developer could be focusing on building more code.
Now for the fun part: calculating the runtimes and cost to execute a build using each tier of compute power, plus the cost of a developer’s time spent waiting on the build. (And remember, I ran each of these twice at each tier and then averaged the results together.)
You end up with something like this:
| Compute power | Fedora 35 build | Fedora 36 build | Average time
(minutes) |
Cost/minute for compute | Total cost of 1 build | Developer cost
(1 dev) |
Developer cost
(5 devs) |
| 2 core | 5:24:27 | 4:54:02 | 310 | $0.008 | $2.48 | $389.98 | $1,939.98 |
| 4 core | 2:46:33 | 2:57:47 | 173 | $0.016 | $2.77 | $219.02 | $1,084.02 |
| 8 core | 1:32:13 | 1:30:41 | 92 | $0.032 | $2.94 | $117.94 | $577.94 |
| 16 core | 0:54:31 | 0:54:14 | 55 | $0.064 | $3.52 | $72.27 | $347.27 |
| 32 core | 0:36:21 | 0:32:21 | 35 | $0.128 | $4.48 | $48.23 | $223.23 |
| 64 core | 0:29:25 | 0:24:24 | 27 | $0.256 | $6.91 | $40.66 | $175.66 |
You can immediately see how much faster each build completes on more powerful hardware—and that’s hardly surprising. But it’s striking how much money, on average, a business would be paying their developers in the time it takes for a build to run.
When you plot this out, you end up with a pretty compelling case for spending more money on stronger hardware.
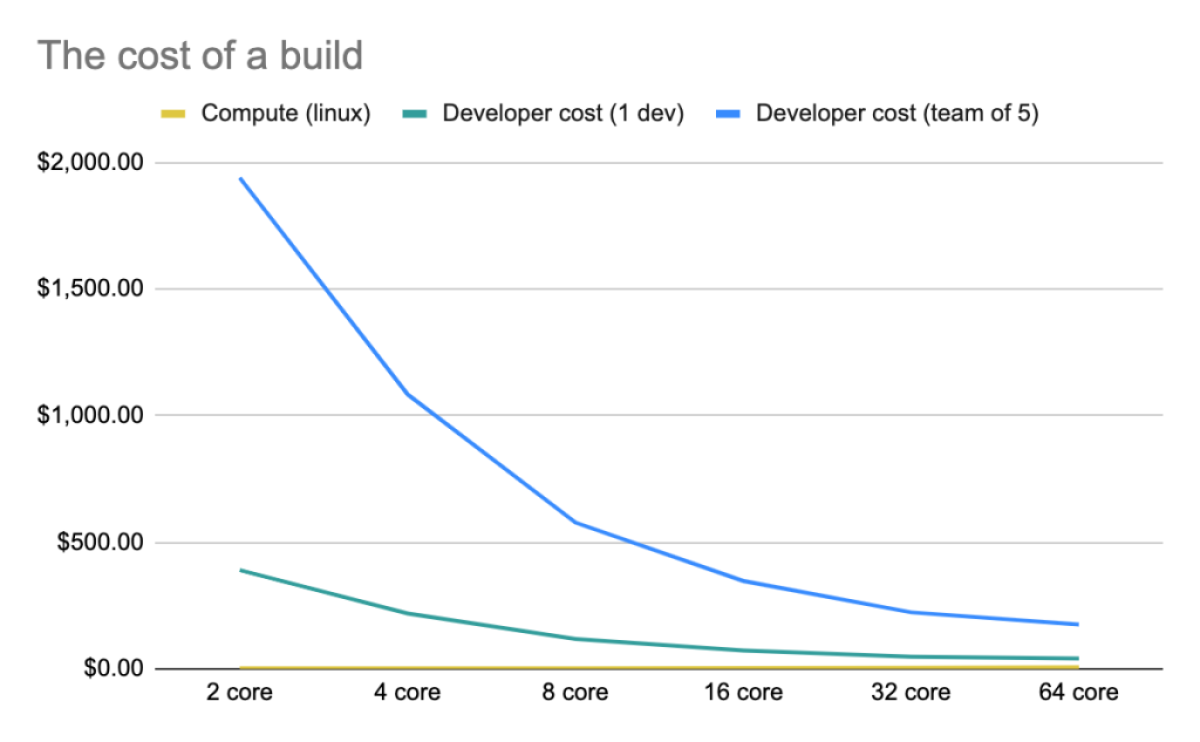
The bottom line: The cost of hardware is much, much less than the total cost for developers, and giving your engineering teams more CPU power means they have more time to develop software instead of waiting on builds to complete. And the bigger the team you have in a given organization, the more upside you have to invest in more capable compute resources.
How much context switching costs companies
Now let’s change the scenario in our experiment: Instead of assuming that developers are sitting idly while waiting for a build to finish, let’s consider they instead start working on another task while a build runs.
This is a classic example of context switching, and it comes with a cost, too. Research has found that context switching is both distracting and an impediment to focused and productive work. In fact, Gloria Mark, a professor of informatics at the University of California, Irvine, has found it takes about 23 minutes for someone to get back to their original task after context switching—and that isn’t even specific to development work, which often entails deeply involved work.
Based on my own experience, switching from one focused task to another takes at least an hour so that’s what I used to run the numbers against. Now, let’s break down the data again:
| Compute power | Minutes | Cost of 1 build | Partial developer cost
(1 dev) |
Partial developer cost
(5 devs) |
| 2 core | 310 | $2.48 | $77.48 | $377.48 |
| 4 core | 173 | $2.77 | $77.77 | $377.77 |
| 8 core | 92 | $2.94 | $77.94 | $377.94 |
| 16 core | 55 | $3.52 | $78.52 | $378.52 |
| 32 core | 35 | $4.48 | $79.48 | $379.48 |
| 64 core | 27 | $6.91 | $81.91 | $381.91 |
Here, the numbers tell a different story—that is, if you’re going to switch tasks anyways, the speed of build runs doesn’t significantly matter. Labor is much, much more expensive than compute resources. And that means spending a few more dollars to speed up the build is inconsequential in the long run.
Of course, this assumes it will take an hour for developers to get back on track after context switching. But according to the research we cited above, some people can get back on track in 23 minutes (and, additional research from Cornell found that it sometimes takes as little as 10 minutes).
To account for this, let’s try shortening the time frames to 30 minutes and 15 minutes:
| Compute power | Minutes | Cost of 1 build | Partial dev cost
(1 dev, 30 mins) |
Partial dev cost
(5 devs, 30 mins) |
Partial dev cost
(1 dev, 15 mins) |
Partial dev cost
(5 devs, 15 mins) |
| 2 core | 310 | $2.48 | $39.98 | $189.98 | $21.23 | $96.23 |
| 4 core | 173 | $2.77 | $40.27 | $190.27 | $21.52 | $96.52 |
| 8 core | 92 | $2.94 | $40.44 | $190.44 | $21.69 | $96.69 |
| 16 core | 55 | $3.52 | $41.02 | $191.02 | $22.27 | $97.27 |
| 32 core | 35 | $4.48 | $41.98 | $191.98 | $23.23 | $98.23 |
| 64 core | 27 | $6.91 | $44.41 | $194.41 | $25.66 | $100.66 |
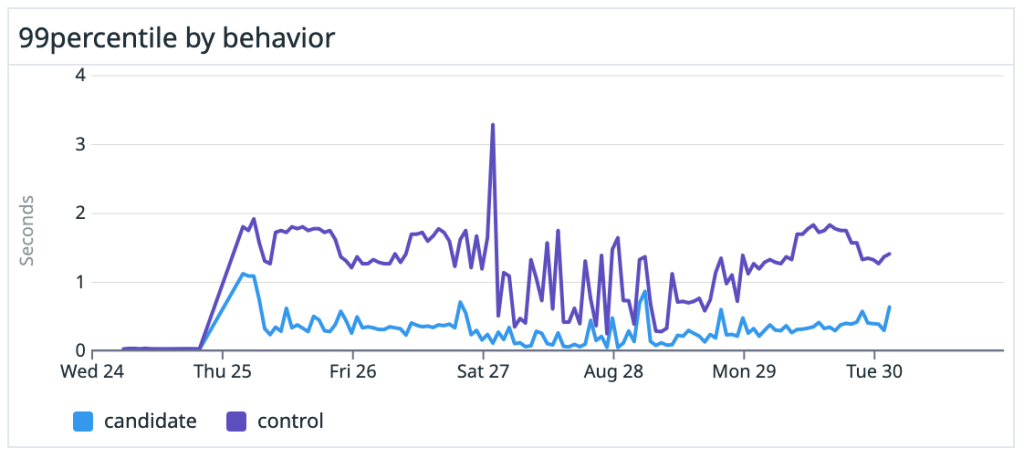
And when you visualize this data on a graph, the cost for a single developer waiting on a build or switching tasks looks like this:
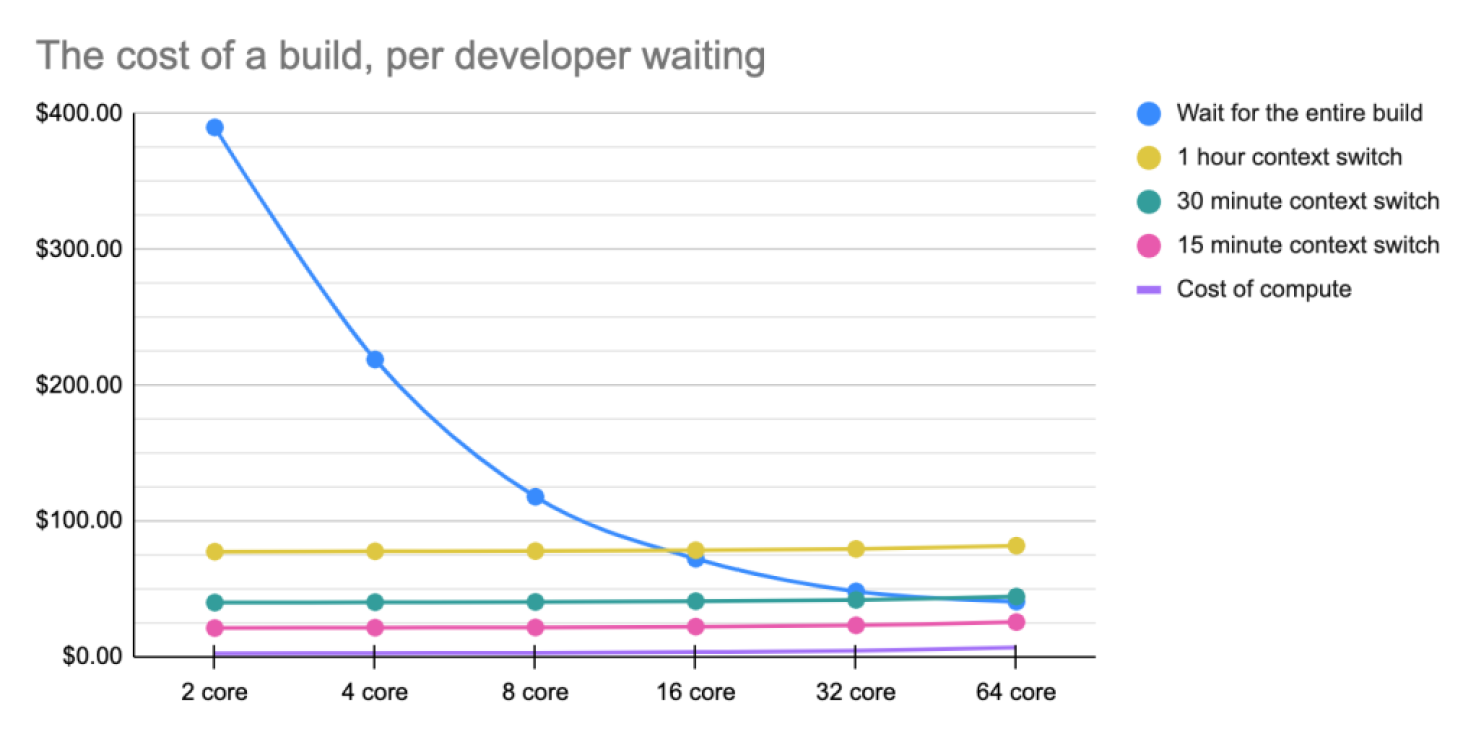
When you assume the average hourly rate of a developer is $75 (USD), the graph above shows that it almost always makes sense to pay more for more compute power so your developers aren’t left waiting or context switching. Even the most expensive compute option—$15 an hour for 64 cores and 256GB of RAM—only accounts for a fifth of the hourly cost of a single developer’s time. As developer salaries increase, the cost of hardware decreases, or the time the job takes to run decreases—and this inverse ratio bolsters the case for buying better equipment.
That’s something to consider.
The bottom line
It’s cheaper—and less frustrating for your developers—to pay more for better hardware to keep your team on track.
In this case, spending an extra $4-5 on build compute saves about $40 per build for an individual developer, or a little over $200 per build for a team of five, and the frustration of switching tasks with a productivity cost of about an hour. That’s not nothing. Of course, spending that extra $4-5 at scale can quickly compound—but so can the cost of sunk productivity.
Even though we used GitHub’s larger runners as an example here, these findings are applicable to any type of hardware—whether self-hosted or in the cloud. So remember: The upfront cost for more CPU power pays off over time. And your developers will thank you (trust us).
Want to try our new high-performance GitHub-hosted runners? Sign up for the beta today.
The post Experiment: The hidden costs of waiting on slow build times appeared first on The GitHub Blog.
]]>The post How GitHub converts previously encrypted and unencrypted columns to ActiveRecord encrypted columns appeared first on The GitHub Blog.
]]>In the first post in this series, we detailed how we designed our easy‐to‐use column encryption paved path. We found during the rollout that the bulk of time and effort was spent in robustly supporting the reading and upgrading of previous encryption formats/plaintext and key rotation. In this post, we’ll explain the design decisions we made in our migration plan and describe a simplified migration pattern you can use to encrypt (or re-encrypt) existing records in your Rails application.
We have two cases for encrypted columns data migration–upgrading plaintext or previously encrypted data to our new standard and key rotation.
Upon consulting the Rails documentation to see if there was any prior art we could use, we found the previous encryptor strategy but exactly how to migrate existing data is, as they say, an “exercise left for the reader.”
Dear reader, lace up your sneakers because we are about to exercise. 
To convert plaintext columns or columns encrypted with our deprecated internal encryption library, we used ActiveRecord::Encryption’s previous encryptor strategy, our existing feature flag mechanism and our own type of database migration called a transition. Transitions are used by GitHub to modify existing data, as opposed to migrations that are mainly used to add or change columns. To simplify things and save time, in the example migration strategy, we’ll rely on the Ruby gem, MaintenanceTasks.
Previous encryptor strategy
ActiveRecord::Encryption provides as a config option config.active_record.encryption.support_unencrypted_data that allows plaintext values in an encrypted_attribute to be read without error. This is enabled globally and could be a good strategy to use if you are migrating only plaintext columns and you are going to migrate them all at once. We chose not to use this option because we want to migrate columns to ActiveRecord::Encryption without exposing the ciphertext of other columns if decryption fails. By using a previous encryptor, we can isolate this “plaintext mode” to a single model.
In addition to this, GitHub’s previous encryptor uses a schema validator and regex to make sure that the “plaintext” being returned does not have the same shape as Rails encrypted columns data.
Feature flag strategy
We wanted to have fine-grained control to safely roll out our new encryption strategy, as well as the ability to completely disable it in case something went wrong, so we created our own custom type using the ActiveModel::Type API, which would only perform encryption when the feature flag for our new column encryption strategy was disabled.
A common feature flag strategy would be to start a feature flag at 0% and gradually ramp it up to 100% while you observe and verify the effects on your application. Once a flag is verified at 100%, you would remove the feature flag logic and delete the flag. To gradually increase a flag on column encryption, we would need to have an encryption strategy that could handle plaintext and encrypted records both back and forth because there would be no way to know if a column was encrypted without attempting to read it first. This seemed like unnecessary additional and confusing work, so we knew we’d want to use flagging as an on/off switch.
While a feature flag should generally not be long running, we needed the feature flag logic to be long running because we want it to be available for GitHub developers who will want to upgrade existing columns to use ActiveRecord::Encryption.
This is why we chose to inverse the usual feature flag default to give us the flexibility to upgrade columns incrementally without introducing unnecessary long‐running feature flags. This means we set the flag at 100% to prevent records from being encrypted with the new standard and set it to 0% to cause them to be encrypted with our new standard. If for some reason we are unable to prioritize upgrading a column, other columns do not need to be flagged at 100% to continue to be encrypted on our new standard.
We added this logic to our monkeypatch of ActiveRecord::Base::encrypts method to ensure our feature flag serializer is used:
Code sample 1
self.attribute(attribute) do |cast_type|
    GitHub::Encryption::FeatureFlagEncryptedType.new(cast_type: cast_type, attribute_name: attribute, model_name: self.name)
end
Which instantiates our new ActiveRecord Type that checks for the flag in its serialize method:
Code sample 2
# frozen_string_literal: true

module GitHub
  module Encryption
    class FeatureFlagEncryptedType < ::ActiveRecord::Type::Text
      attr_accessor :cast_type, :attribute_name, :model_name


      # delegate: a method to make a call to `this_object.foo.bar` into `this_object.bar` for convenience
      # deserialize: Take a value from the database, and make it suitable for Rails
      # changed_in_place?: determine if the value has changed and needs to be rewritten to the database
      delegate :deserialize, :changed_in_place?
, to: :cast_type

      def initialize(cast_type:, attribute_name:, model_name:)
        raise RuntimeError, "Not an EncryptedAttributeType" unless cast_type.is_a?(ActiveRecord::Encryption::EncryptedAttributeType)

        @cast_type = cast_type
        @attribute_name = attribute_name
        @model_name = model_name
      end


      # Take a value from Rails and make it suitable for the database
      def serialize(value)
        if feature_flag_enabled?("encrypt_as_plaintext_#{model_name.downcase}_#{attribute_name.downcase}")
          # Fall back to plaintext (ignore the encryption serializer)
          cast_type.cast_type.serialize(value)
        else
          # Perform encryption via active record encryption serializer
          cast_type.serialize(value)
        end
      end
    end
  end
end
A caveat to this implementation is that we extended from ActiveRecord::Type::Text which extends from ActiveModel::Type:String, which implements changed_in_place? by checking if the new_value is a string, and, if it is, does a string comparison to determine if the value was changed.
We ran into this caveat during our roll out of our new encrypted columns. When migrating a column previously encrypted with our internal encryption library, we found that changed_in_place? would compare the decrypted plaintext value to the encrypted value stored in the database, always marking the record as changed in place as these were never equal. When we migrated one of our fields related to 2FA recovery codes, this had the unexpected side effect of causing them to all appear changed in our audit log logic and created false-alerts in customer facing security logs. Fortunately, though, there was no impact to data and our authentication team annotated the false alerts to indicate this to affected customers.
To address the cause, we delegated the changed_in_place? to the cast_type, which in this case will always be ActiveRecord::Encryption::EncryptedAttributeType that attempts to deserialize the previous value before comparing it to the new value.
Key rotation
ActiveRecord::Encryption accommodates for a list of keys to be used so that the most recent one is used to encrypt records, but all entries in the list will be tried until there is a successful decryption or an ActiveRecord::DecryptionError is raised. On its own, this will ensure that when you add a new key, records that are updated after will automatically be re-encrypted with the new key.
This functionality allows us to reuse our migration strategy (see code sample 5) to re-encrypt all records on a model with the new encryption key. We do this simply by adding a new key and running the migration to re-encrypt.
Example migration strategy
This section will describe a simplified version of our migration process you can replicate in your application. We use a previous encryptor to implement safe plaintext support and the maintanence_tasks gem to backfill the existing records.
Set up ActiveRecord::Encryption and create a previous encryptor
Because this is a simplified example of our own migration strategy, we recommend using a previous encryptor to restrict the “plaintext mode” of ActiveRecord::Encryption to the specific model(s) being migrated.
Set up ActiveRecord::Encryption by generating random key set:
bin/rails db:encryption:init
And adding it to the encrypted Rails.application.credentials using:
bin/rails credentials:edit
If you do not have a master.key, this command will generate one for you. Remember never to commit your master key!
Create a previous encryptor. Remember, when you provide a previous strategy, ActiveRecord::Encryption will use the previous to decrypt and the current (in this case ActiveRecord’s default encryptor) to encrypt the records.
Code sample 3
app/lib/encryption/previous_encryptor.rb

# frozen_string_literal: true

module Encryption
  class PreviousEncryptor
    def encrypt(clear_text, key_provider: nil, cipher_options: {})
        raise NotImplementedError.new("This method should not be called")
    end

    def decrypt(previous_data, key_provider: nil, cipher_options: {})
      # JSON schema validation
        previous_data
    end
  end
end
Add the previous encryptor to the encrypted column
Code sample 4
app/models/secret.rb
class Secret < ApplicationRecord
  encrypts :code, previous: { encryptor: Encryption::PreviousEncryptor.new }
end
The PreviousEncryptor will allow plaintext records to be read as plaintext but will encrypt all new records up until and while the task is running.
Install the Maintenance Tasks gem and create a task
Install the Maintenance Tasks gem per the instructions and you will be ready to create the maintenance task.
Create the task.
bin/rails generate maintenance_tasks:task encrypt_plaintext_secrets
In day‐to‐day use, you shouldn’t ever need to call secret.encrypt because ActiveRecord handles the encryption before inserting into the database, but we can use this API in our task:
Code sample 5
app/tasks/maintenance/encrypt_plaintext_secrets_task.rb

# frozen_string_literal: true

module Maintenance
  class EncryptPlaintextSecretsTask < MaintenanceTasks::Task
    def collection
      Secret.all
    end

    def process(element)
      element.encrypt
    end
      …
  end
end
Run the Maintenance Task
Maintenance Tasks provides several options to run the task, but we use the web UI in this example:
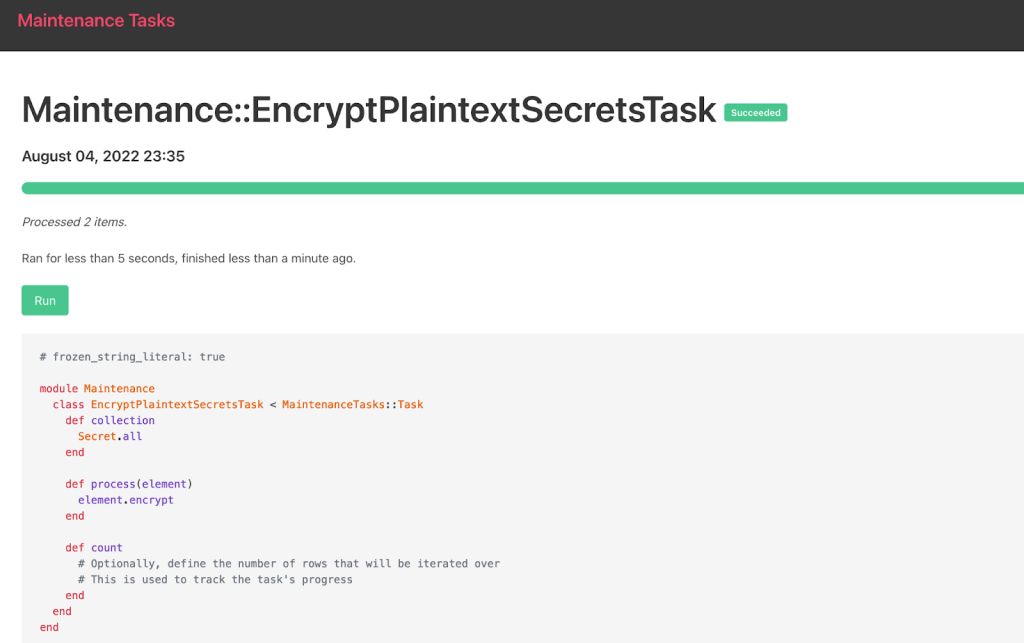
Verify your encryption and cleanup
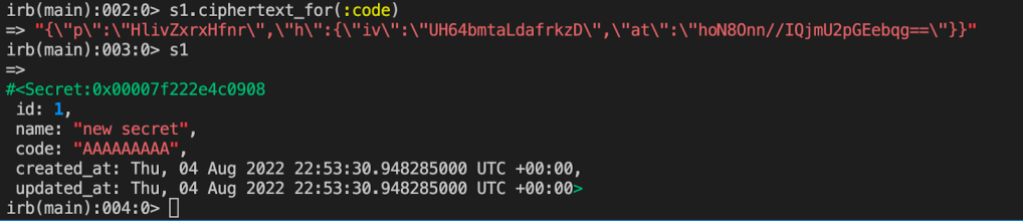
You can verify encryption in Rails console, if you like:
And now you should be able to safely remove your previous encryptor leaving the model of your newly encrypted column looking like this:
Code sample 6
app/models/secret.rb

class Secret < ApplicationRecord
  encrypts :code
end
And so can you!
Encrypting database columns is a valuable extra layer of security that can protect sensitive data during exploits, but it’s not always easy to migrate data in an existing application. We wrote this series in the hope that more organizations will be able to plot a clear path forward to using ActiveRecord::Encryption to start encrypting existing sensitive values.
The post How GitHub converts previously encrypted and unencrypted columns to ActiveRecord encrypted columns appeared first on The GitHub Blog.
]]>The post Why and how GitHub encrypts sensitive database columns using ActiveRecord::Encryption appeared first on The GitHub Blog.
]]>You may know that GitHub encrypts your source code at rest, but you may not have known that we also encrypt sensitive database columns in our Ruby on Rails monolith. We do this to provide an additional layer of defense in depth to mitigate concerns, such as:
- Reading or tampering with sensitive fields if a database is inappropriately accessed
- Accidentally exposing sensitive data in logs
Motivation
Until recently, we used an internal library called Encrypted Attributes. GitHub developers would declare a column should be encrypted using an API that might look familiar if you have used ActiveRecord::Encryption:
class TotpAppRegistration
  encrypted_attribute :encrypted_otp_secret, :plaintext_otp_secret
end
Given that we had an existing implementation, you may be wondering why we chose to take on the work of converting our columns to ActiveRecord::Encryption. Our main motivation was to ensure that developers did not have to learn a GitHub-specific pattern to encrypt their sensitive data.
We believe strongly that using familiar, intuitive patterns results in better adoption of security tools and, by extension, better security for our users.
In addition to exposing some of the implementation details of the underlying encryption, this API did not provide an easy way for developers to encrypt existing columns. Our internal library required a separate encryption key to be generated and stored in our secure environment variable configuration—for each new database column. This created a bottleneck, as most developers don’t work with encryption every day and needed support from the security team to make changes.
When assessing ActiveRecord::Encryption, we were particularly interested in its ease of use for developers. We wanted a developer to be able to write one line of code, and no matter if their column was previously plaintext or used our previous solution, their column would magically start using ActiveRecord::Encryption. The final API looks something like this:
class TotpAppRegistration
  encrypts :encrypted_otp_secret
end
This API is the exact same as what is used by traditional ActiveRecord::Encryption while hiding all the complexity of making it work at GitHub scale.
How we implemented this
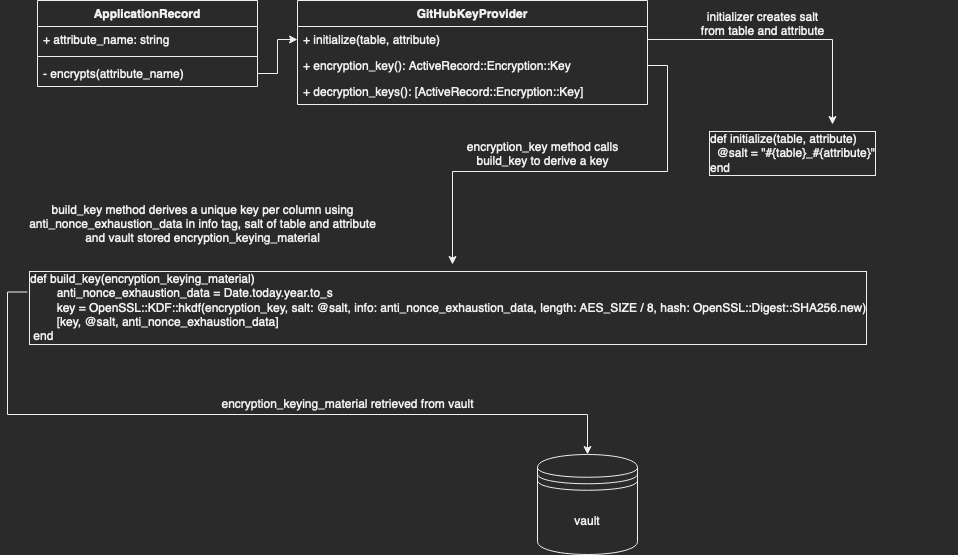
As part of implementing ActiveRecord::Encryptioninto our monolith, we worked with our architecture and infrastructure teams to make sure the solution met GitHub’s scalability and security requirements. Below is a brief list of some of the customizations we made to fit the implementation to our infrastructure.
As always, there are specific nuances that must be considered when modifying existing encryption implementations, and it is always a good practice to review any new cryptography code with a security team.
Secure primary key storage
By default, Rails uses its built-in credentials.yml.enc file to securely store the primary key and static salt used for deriving the column encryption key in ActiveRecord::Encryption.
GitHub’s key management strategy for ActiveRecord::Encryption differs from the Rails default in two key ways: deriving a separate key per column and storing the key in our centralized secret management system.
Deriving per-column keys from a single primary key
As explained above, one of the goals of this transition was to no longer bottleneck teams by managing keys manually. We did, however, want to maintain the security properties of separate keys. Thankfully, cryptography experts have created a primitive known as a Key Derivation Function (KDF) for this purpose. These functions take (roughly) three important parameters: the primary key, a unique salt, and a string termed “info” by the spec.
Our salt is simply the table name, an underscore, and the attribute name. So for TotpAppRegistrations#encrypted_otp_secret the salt would be totp_app_registrations_encrypted_otp_secret. This ensures the key is different per column.
Due to the specifics of the ActiveRecord::Encryption algorithm (AES256-GCM), we need to be careful not to encrypt too many values using the same key (to avoid nonce reuse). We use the “info” string parameter to ensure the key for each column changes automatically at least once per year. Therefore, we can populate the info input with the current year as a nonce during key derivation.
The applications that make up GitHub store secrets in Hashicorp Vault. To conform with this pre-existing pattern, we wanted to pull our primary key from Vault instead of the credentials.yml.enc file. To accommodate for this, we wrote a custom key provider that behaves similarly to the default DerivedSecretKeyProvider, retrieving the key from Vault and deriving the key with our KDF (see Diagram 1).
Making new behavior the default
One of our team’s key principles is that solutions we develop should be intuitive and not require implementation knowledge on the part of the product developer. ActiveRecord::Encryption includes functionality to customize the Encryptor used to encrypt data for a given column. This functionality would allow developers to optionally use the strategies described above, but to make it the default for our monolith we needed to override the encrypts model helper to automatically select an appropriate GitHub-specific key provider for the user.
{
def self.encrypts(*attributes, key_provider: nil, previous: nil, **options)
      # snip: ensure only one attribute is passed
# ...

    # pull out the sole attribute
    attribute = attributes.sole

      # snip: ensure if a key provider is passed, that it is a GitHubKeyProvider
      # ...

    # If no key provider is set, instantiate one
    kp = key_provider || GitHub::Encryption::GitHubKeyProvider.new(table: table_name.to_sym, attribute: attribute)

      # snip: logic to ensure previous encryption formats and plaintext are supported for smooth transition (see part 2)
      # github_previous = ...

    # call to rails encryption
    super(attribute, key_provider: kp, previous: github_previous, **options)
end
}
Currently, we only provide this API to developers working on our internal github.com codebase. As we work with the library, we are experimenting with upstreaming this strategy to ActiveRecord::Encryption by replacing the per-class encryption scheme with a per-column encryption scheme.
Turn off compression by default
Compressing values prior to encryption can reveal some information about the content of the value. For example, a value with more repeated bytes, such as “abcabcabc,” will compress better than a string of the same length, such as “abcdefghi”. In addition to the common encryption property that ciphertext generally exposes the length, this exposes additional information about the entropy (randomness) of the underlying plaintext.
ActiveRecord::Encryption compresses data by default for storage efficiency purposes, but since the values we are encrypting are relatively small, we did not feel this tradeoff was worth it for our use case. This is why we replaced the default to compress values before encryption with a flag that makes compression optional.
Migrating to a new encryption standard: the hard parts
This post illustrates some of the design decisions and tradeoffs we encountered when choosing ActiveRecord::Encryption, but it’s not quite enough information to guide developers of existing applications to start encrypting columns. In the next post in this series we’ll show you how we handled the hard parts—how to upgrade existing columns in your application from plaintext or possibly another encryption standard.
The post Why and how GitHub encrypts sensitive database columns using ActiveRecord::Encryption appeared first on The GitHub Blog.
]]>The post Improve Git monorepo performance with a file system monitor appeared first on The GitHub Blog.
]]>git status and git add. These commands are slow because they need to search the entire worktree looking for changes. When the worktree is very large, Git needs to do a lot of work.
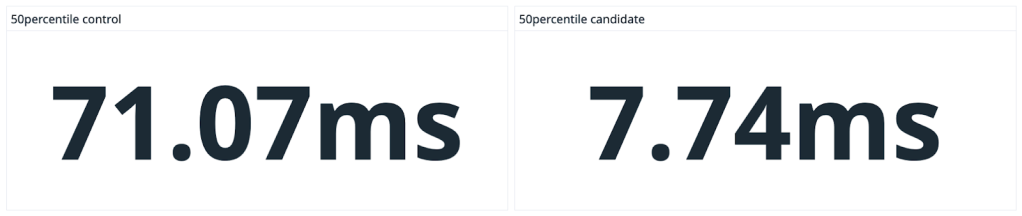
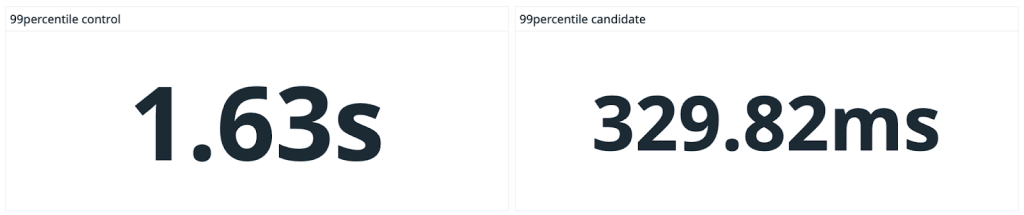
The Git file system monitor (FSMonitor) feature can speed up these commands by reducing the size of the search, and this can greatly reduce the pain of working in large worktrees. For example, this chart shows status times dropping to under a second on three different large worktrees when FSMonitor is enabled!
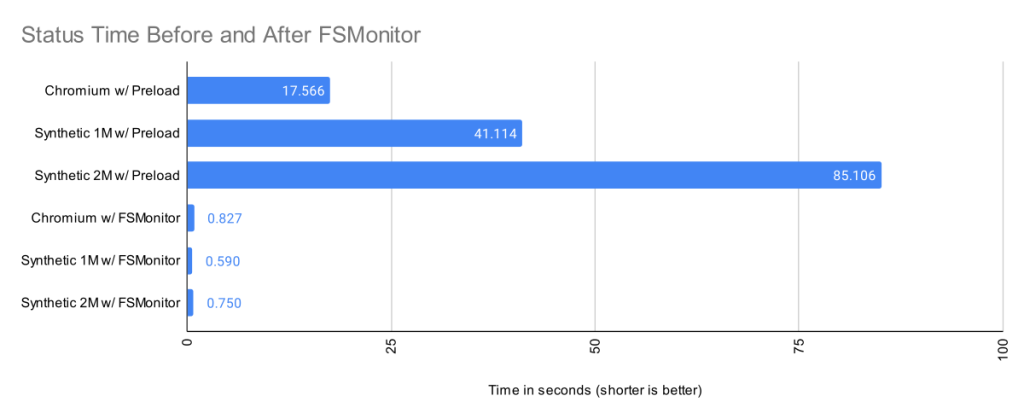
In this article, I want to talk about the new builtin FSMonitor git fsmonitor--daemon added in Git version 2.37.0. This is easy to set up and use since it is “in the box” and does not require any third-party tooling nor additional software. It only requires a config change to enable it. It is currently available on macOS and Windows.
To enable the new builtin FSMonitor, just set core.fsmonitor to true. A daemon will be started automatically in the background by the next Git command.
FSMonitor works well with core.untrackedcache, so we’ll also turn it on for the FSMonitor test runs. We’ll talk more about the untracked-cache later.
$ time git status
On branch main
Your branch is up to date with 'origin/main'.

It took 5.25 seconds to enumerate untracked files. 'status -uno'
may speed it up, but you have to be careful not to forget to add
new files yourself (see 'git help status').
nothing to commit, working tree clean

real    0m17.941s
user    0m0.031s
sys     0m0.046s

$ git config core.fsmonitor true
$ git config core.untrackedcache true

$ time git status
On branch main
Your branch is up to date with 'origin/main'.

It took 6.37 seconds to enumerate untracked files. 'status -uno'
may speed it up, but you have to be careful not to forget to add
new files yourself (see 'git help status').
nothing to commit, working tree clean

real    0m19.767s
user    0m0.000s
sys     0m0.078s

$ time git status
On branch main
Your branch is up to date with 'origin/main'.

nothing to commit, working tree clean

real    0m1.063s
user    0m0.000s
sys     0m0.093s

$ git fsmonitor--daemon status
fsmonitor-daemon is watching 'C:/work/chromium'
_Note that when the daemon first starts up, it needs to synchronize with the state of the index, so the next git status command may be just as slow (or slightly slower) than before, but subsequent commands should be much faster.
In this article, I’ll introduce the new builtin FSMonitor feature and explain how it improves performance on very large worktrees.
How FSMonitor improves performance
Git has a “What changed while I wasn’t looking?” problem. That is, when you run a command that operates on the worktree, such as git status, it has to discover what has changed relative to the index. It does this by searching the entire worktree. Whether you immediately run it again or run it again tomorrow, it has to rediscover all of that same information by searching again. Whether you edit zero, one, or a million files in the mean time, the next git status command has to do the same amount of work to rediscover what (if anything) has changed.
The cost of this search is relatively fixed and is based upon the number of files (and directories) present in the worktree. In a monorepo, there might be millions of files in the worktree, so this search can be very expensive.
What we really need is a way to focus on the changed files without searching the entire worktree.
How FSMonitor works
FSMonitor is a long-running daemon or service process.
- It registers with the operating system to receive change notification events on files and directories.
- It adds the pathnames of those files and directories to an in-memory, time-sorted queue.
- It listens for IPC connections from client processes, such as
git status. - It responds to client requests for a list of files and directories that have been modified recently.
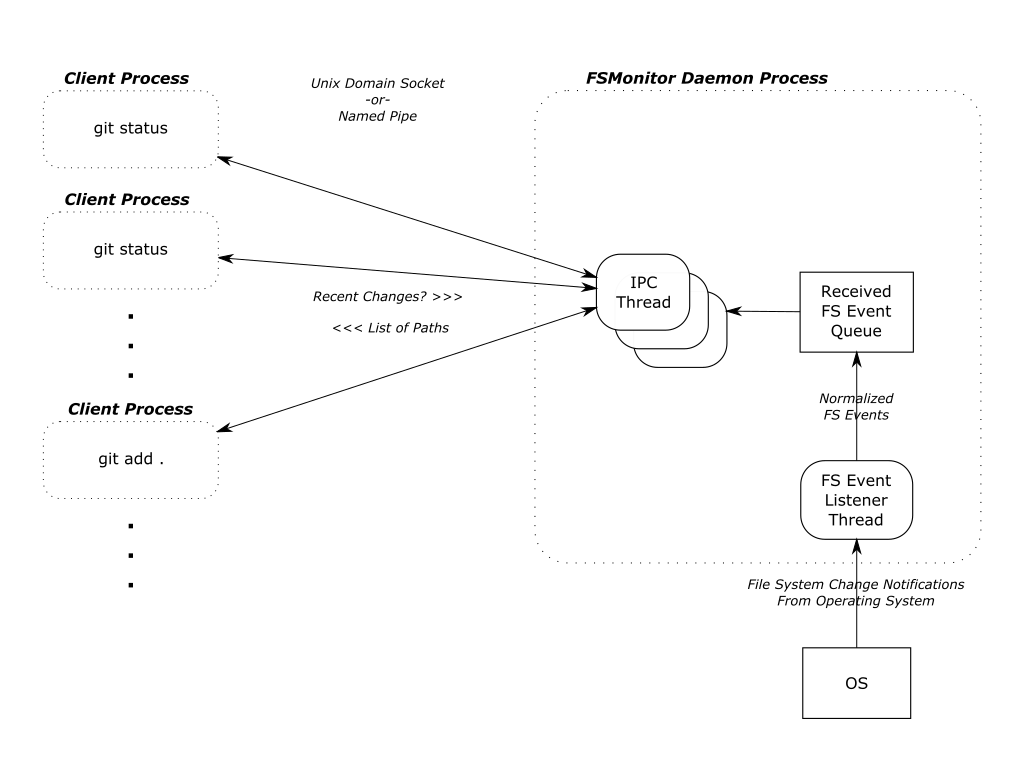
FSMonitor must continuously watch the worktree to have a complete view of all file system changes, especially ones that happen between Git commands. So it must be a long-running daemon or service process and not associated with an individual Git command instance. And thus, it cannot be a traditional Git hook (child) process. This design does allow it to service multiple (possibly concurrent) Git commands.
FSMonitor Synchronization
FSMonitor has the concept of a “token”:
- A token is an opaque string defined by FSMonitor and can be thought of as a globally unique sequence number or timestamp.
- FSMonitor creates a new token whenever file system events happen.
- FSMonitor groups file system changes into sets by these ordered tokens.
- A Git client command sends a (previously generated) token to FSMonitor to request the list of pathnames that have changed, since FSMonitor created that token.
- FSMonitor includes the current token in every response. The response contains the list of pathnames that changed between the sent and received tokens.
git status writes the received token into the index with other FSMonitor data before it exits. The next git status command reads the previous token (along with the other FSMonitor data) and asks FSMonitor what changed since the previous token.
Earlier, I said a token is like a timestamp, but it also includes other fields to prevent incomplete responses:
- The FSMonitor process id (PID): This identifies the daemon instance that created the token. If the PID in a client’s request token does not match the currently running daemon, we must assume that the client is asking for data on file system events generated before the current daemon instance was started.
- A file system synchronization id (SID): This identifies the most recent synchronization with the file system. The operating system may drop file system notification events during heavy load. The daemon itself may get overloaded, fall behind, and drop events. Either way, events were dropped, and there is a gap in our event data. When this happens, the daemon must “declare bankruptcy” and (conceptually) restart with a new SID. If the SID in a client’s request token does not match the daemon’s curent SID, we must assume that the client is asking for data spanning such a resync.
In both cases, a normal response from the daemon would be incomplete because of gaps in the data. Instead, the daemon responds with a trivial (“assume everything was changed”) response and a new token. This will cause the current Git client command to do a regular scan of the worktree (as if FSMonitor were not enabled), but let future client commands be fast again.
Types of files in your worktree
When git status examines the worktree, it looks for tracked, untracked, and ignored files.

Tracked files are files under version control. These are files that Git knows about. These are files that Git will create in your worktree when you do a git checkout. The file in the worktree may or may not match the version listed in the index. When different, we say that there is an unstaged change. (This is independent of whether the staged version matches the version referenced in the HEAD commit.)
Untracked files are just that: untracked. They are not under version control. Git does not know about them. They may be temporary files or new source files that you have not yet told Git to care about (using git add).
Ignored files are a special class of untracked files. These are usually temporary files or compiler-generated files. While Git will ignore them in commands like git add, Git will see them while searching the worktree and possibly slow it down.
Normally, git status does not print ignored files, but we’ll turn it on for this example so that we can see all four types of files.
$ git status --ignored
On branch master
Changes to be committed:
  (use "git restore --staged <file>..." to unstage)
    modified:   README

Changes not staged for commit:
  (use "git add <file>..." to update what will be committed)
  (use "git restore <file>..." to discard changes in working directory)
    modified:   README
    modified:   main.c

Untracked files:
  (use "git add <file>..." to include in what will be committed)
    new-file.c

Ignored files:
  (use "git add -f <file>..." to include in what will be committed)
    new-file.obj
The expensive worktree searches
During the worktree search, Git treats tracked and untracked files in two distinct phases. I’ll talk about each phase in detail in later sections.
- In “refresh_index,” Git looks for unstaged changes. That is, changes to tracked files that have not been staged (added) to the index. This potentially requires looking at each tracked file in the worktree and comparing its contents with the index version.
- In “untracked,” Git searches the worktree for untracked files and filters out tracked and ignored files. This potentially requires completely searching each subdirectory in the worktree.
There is a third phase where Git compares the index and the HEAD commit to look for staged changes, but this phase is very fast, because it is inspecting internal data structures that are designed for this comparision. It avoids the significant number of system calls that are required to inspect the worktree, so we won’t worry about it here.
A detailed example
The chart in the introduction showed status times before and after FSMonitor was enabled. Let’s revisit that chart and fill in some details.
I collected performance data for git status on worktrees from three large repositories. There were no modified files, and git status was clean.
- The Chromium repository contains about 400K files and 33K directories.
- A synthetic repository containing 1M files and 111K directories.
- A synthetic repository containing 2M files and 111K directories.
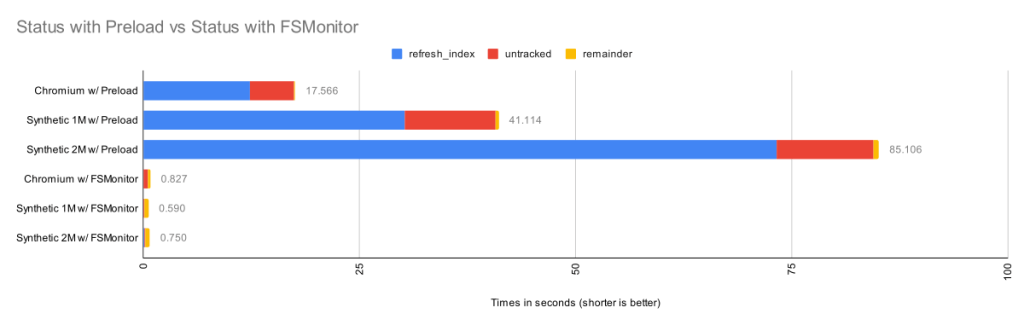
Here we can see that when FSMonitor is not present, the commands took from 17 to 85 seconds. However, when FSMonitor was enabled the commands took less than 1 second.
Each bar shows the total run time of the git status commands. Within each bar, the total time is divided into parts based on performance data gathered by Git’s trace2 library to highlight the important or expensive steps within the commands.
| Worktree | Files | refresh_index
with Preload |
Untracked
without Untracked-Cache |
Remainder | Total |
| Chromium | 393K | 12.3s | 5.1s | 0.16s | 17.6s |
| Synthetic 1M | 1M | 30.2s | 10.5s | 0.36s | 41.1s |
| Synthetic 2M | 2M | 73.2s | 11.2s | 0.64s | 85.1s |
The top three bars are without FSMonitor. We can see that most of the time was spent in the refresh_index and untracked columns. I’ll explain what these are in a minute. In the remainder column, I’ve subtracted those two from the total run time. This portion barely shows up on these bars, so the key to speeding up git status is to attack those two phases.
The bottom three bars on the above chart have FSMonitor and the untracked-cache enabled. They show a dramatic performance improvement. On this chart these bars are barely visible, so let’s zoom in on them.
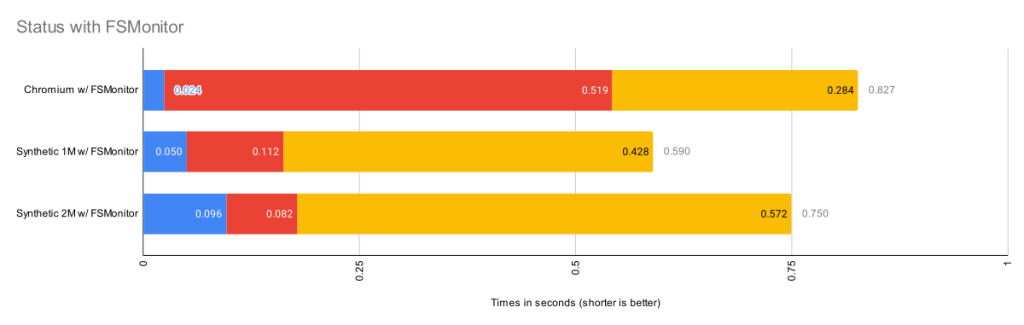
This chart rescales the FSMonitor bars by 100X. The refresh_index and untracked columns are still present but greatly reduced thanks to FSMonitor.
| Worktree | Files | refresh_index
with FSMonitor |
Untracked
with FSMonitor and Untracked-Cache |
Remainder | Total |
| Chromium | 393K | 0.024s | 0.519s | 0.284s | 0.827s |
| Synthetic 1M | 1M | 0.050s | 0.112s | 0.428s | 0.590s |
| Synthetic 2M | 2M | 0.096s | 0.082s | 0.572s | 0.750s |
This is bigger than just status
So far I’ve only talked about git status, since it is the command that we probably use the most and are always thinking about when talking about performance relative to the state and size of the worktree. But it is just one of many affected commands:
git diffdoes the same search, but uses the changed files it finds to print a difference in the worktree and your index.git add .does the same search, but it stages each changed file it finds.git restoreandgit checkoutdo the same search to decide the files to be replaced.
So, for simplicity, I’ll just talk about git status, but keep in mind that this approach benefits many other commands, since the cost of actually staging, overwriting, or reporting the change is relatively trivial by comparison — the real performance cost in these commands (as the above charts show) is the time it takes to simply find the changed files in the worktree.
Phase 1: refresh_index
The index contains an “index entry” with information for each tracked file. The git ls-files command can show us what that list looks like. I’ll truncate the output to only show a couple of files. In a monorepo, this list might contain millions of entries.
$ git ls-files --stage --debug
[...]
100644 7ce4f05bae8120d9fa258e854a8669f6ea9cb7b1 0   README.md
  ctime: 1646085519:36302551
  mtime: 1646085519:36302551
  dev: 16777220 ino: 180738404
  uid: 502  gid: 20
  size: 3639    flags: 0
[...]
100644 5f1623baadde79a0771e7601dcea3c8f2b989ed9 0   Makefile
  ctime: 1648154224:994917866
  mtime: 1648154224:994917866
  dev: 16777221 ino: 182328550
  uid: 502  gid: 20
  size: 110149  flags: 0
[...]
Scanning tracked files for unstaged changes
Let’s assume at the beginning of refresh_index that all index entries are “unmarked” — meaning that we don’t know yet whether or not the worktree file contains an unstaged change. And we “mark” an index entry when we know the answer (either way).

To determine if an individual tracked file has an unstaged change, it must be “scanned”. That is, Git must read, clean, hash the current contents of the file, and compare the computed hash value with the hash value stored in the index. If the hashes are the same, we mark the index entry as “valid”. If they are different, we mark it as an unstaged change.
In theory, refresh_index must repeat this for each tracked file in the index.
As you can see, each individual file that we have to scan will take time and if we have to do a “full scan”, it will be very slow, especially if we have to do it for millions of files. For example, on the Chromium worktree, when I forced a full scan it took almost an hour.
| Worktree | Files | Full Scan |
| Chromium | 393K | 3072s |
refresh_index shortcuts
Since doing a full scan of the worktree is so expensive, Git has developed various shortcuts to avoid scanning whenever possible to increase the performance of refresh_index.
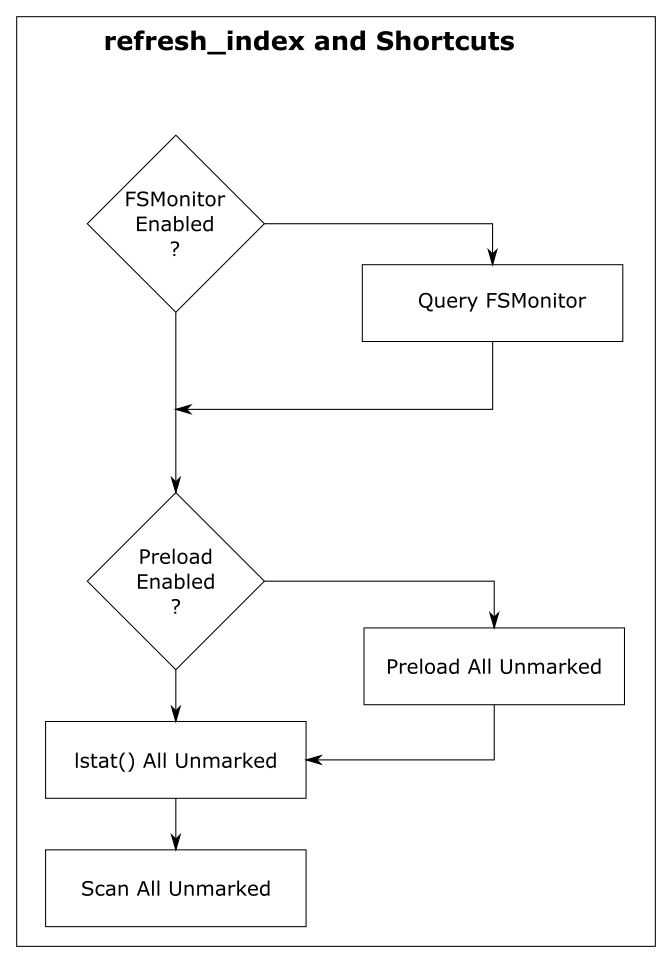
For discussion purposes, I’m going to describe them here as independent steps rather than somewhat intertwined steps. And I’m going to start from the bottom, because the goal of each shortcut is to look at unmarked index entries, mark them if they can, and make less work for the next (more expensive) step. So in a perfect world, the final “full scan” would have nothing to do, because all of the index entries have already been marked, and there are no unmarked entries remaining.
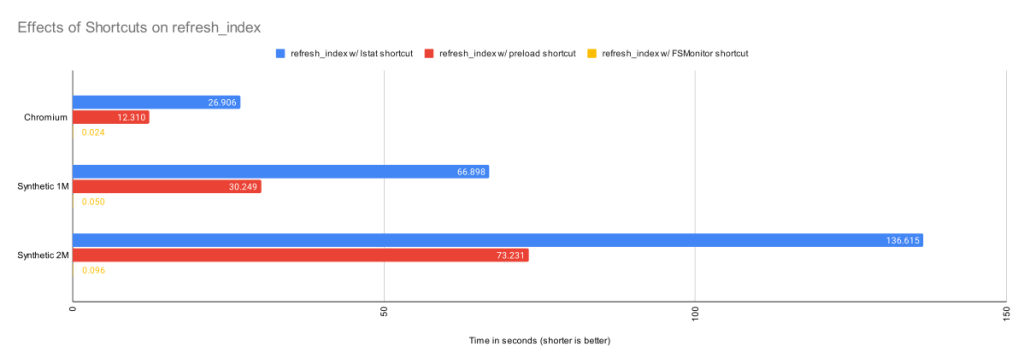
In the above chart, we can see the cummulative effects of these shortcuts.
Shortcut: refresh_index with lstat()
The “lstat() shortcut” was created very early in the Git project.
To avoid actually scanning every tracked file on every git status command, Git relies on a file’s last modification time (mtime) to tell when a file was last changed. File mtimes are updated when files are created or edited. We can read the mtime using the lstat() system call.
When Git does a git checkout or git add, it writes each worktree file’s current mtime into its index entry. These serve as the reference mtimes for future git status commands.
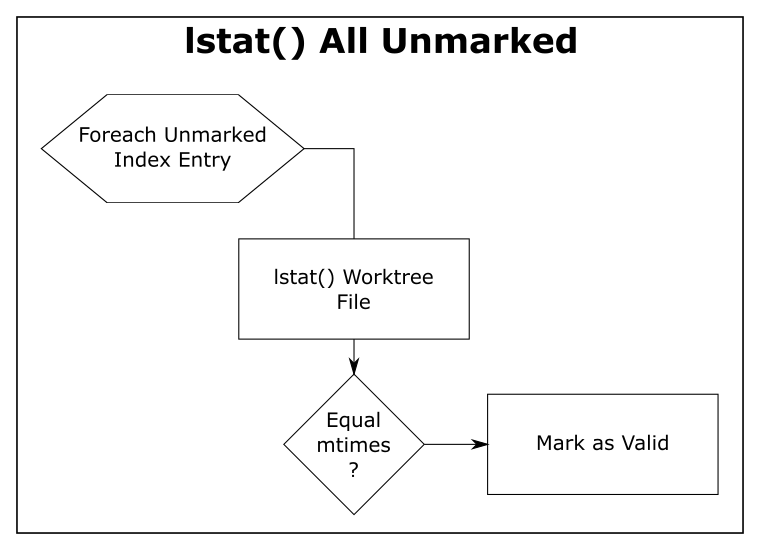
Then, during a later git status, Git checks the current mtime against the reference mtime (for each unmarked file). If they are identical, Git knows that the file content hasn’t changed and marks the index entry valid (so that the next step will avoid it). If the mtimes are different, this step leaves the index entry unmarked for the next step.
| Worktree | Files | refresh_index with lstat()
|
| Chromium | 393K | 26.9s |
| Synthetic 1M | 1M | 66.9s |
| Synthetic 2M | 2M | 136.6s |
The above table shows the time in seconds taken to call lstat() on every file in the worktree. For the Chromium worktree, we’ve cut the time of refresh_index from 50 minutes to 27 seconds.
Using mtimes is much faster than always scanning each file, but Git still has to lstat() every tracked file during the search, and that can still be very slow when there are millions of files.
In this experiment, there were no modifications in the worktree, and the index was up to date, so this step marked all of the index entries as valid and the “scan all unmarked” step had nothing to do. So the time reported here is essentially just the time to call lstat() in a loop.
This is better than before, but even though we are only doing an lstat(), git status is still spending more than 26 seconds in this step. We can do better.
Shortcut: refresh_index with preload
The core.preloadindex config option is an optional feature in Git. The option was introduced in version 1.6 and was enabled by default in 2.1.0 on platforms that support threading.
This step partitions the index into equal-sized chunks and distributes it to multiple threads. Each thread does the lstat() shortcut on their partition. And like before, index entries with different mtimes are left unmarked for the next step in the process.
The preload step does not change the amount of file scanning that we need to do in the final step, it just distributes the lstat() calls across all of your cores.
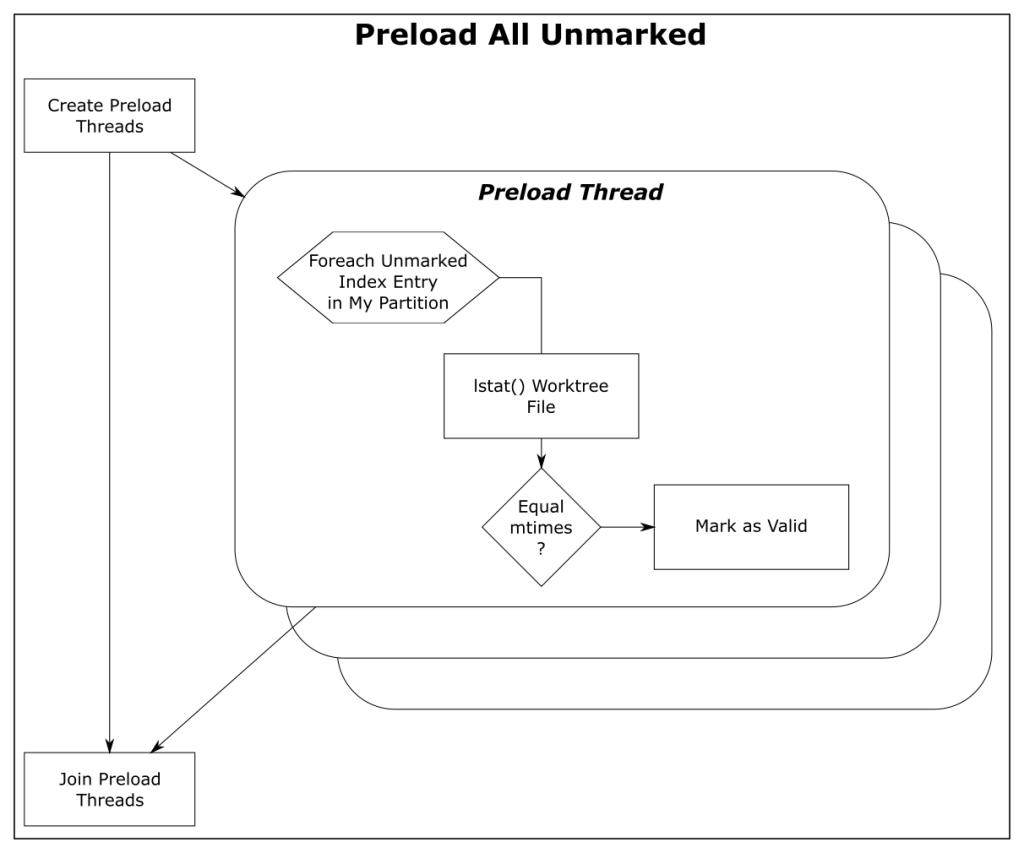
| Worktree | Files | refresh_index with Preload |
| Chromium | 393K | 12.3s |
| Synthetic 1M | 1M | 30.2s |
| Synthetic 2M | 2M | 73.2s |
With the preload shortcut git status is about twice as fast on my 4-core Windows laptop, but it is still expensive.
Shortcut: refresh_index with FSMonitor
When FSMonitor is enabled:
- The
git fsmonitor--daemonis started in the background and listens for file system change notification events from the operating system for files within the worktree. This includes file creations, deletions, and modifications. If the daemon gets an event for a file, that file probably has an updated mtime. Said another way, if a file mtime changes, the daemon will get an event for it. - The FSMonitor index extension is added to the index to keep track of FSMonitor and
git statusdata betweengit statuscommands. The extension contains an FSMonitor token and a bitmap listing the files that were marked valid by the previousgit statuscommand (and relative to that token). - The next
git statuscommand will use this bitmap to initialize the marked state of the index entries. That is, the previous Git command saved the marked state of the index entries in the bitmap and this command restores them — rather than initializing them all as unmarked. - It will then ask the daemon for a list of files that have had file system events since the token and unmark each of them. FSMonitor tells us the exact set of files that have been modified in some way since the last command, so those are the only files that we should need to visit.
At this point, all of the unchanged files should be marked valid. Only files that may have changed should be unmarked. This sets up the next shortcut step to have very little to do.
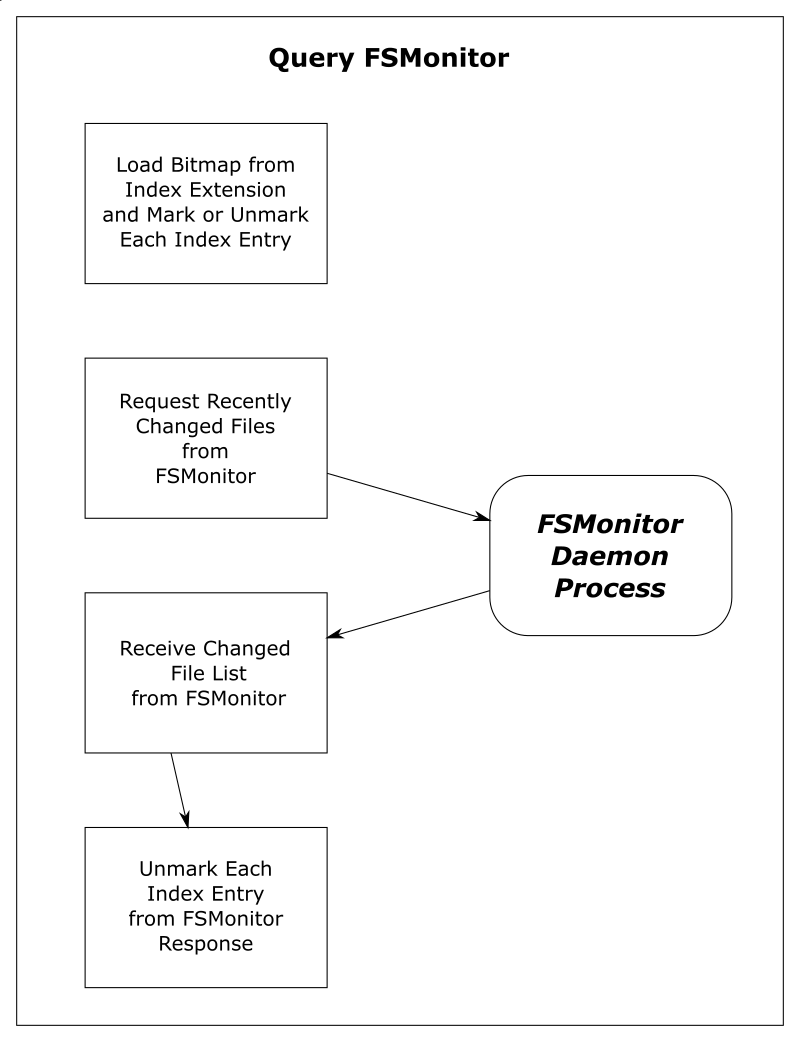
| Worktree | Files | Query FSMonitor | refresh_index with FSMonitor |
| Chromium | 393K | 0.017s | 0.024s |
| Synthetic 1M | 1M | 0.002s | 0.050s |
| Synthetic 2M | 2M | 0.002s | 0.096s |
This table shows that refresh_index is now very fast since we don’t need to any searching. And the time to request the list of files over IPC is well worth the complex setup.
Phase 2: untracked
The “untracked” phase is a search for anything in the worktree that Git does not know about. These are files and directories that are not under version control. This requires a full search of the worktree.
Conceptually, this looks like:
- A full recursive enumeration of every directory in the worktree.
- Build a complete list of the pathnames of every file and directory within the worktree.
- Take each found pathname and do a binary search in the index for a corresponding index entry. If one is found, the pathname can be omitted from the list, because it refers to a tracked file.
- On case insensitive systems, such as Windows and macOS, a case insensitive hash table must be constructed from the case sensitive index entries and used to lookup the pathnames instead of the binary search.
- Take each remaining pathname and apply
.gitignorepattern matching rules. If a match is found, then the pathname is an ignored file and is omitted from the list. This pattern matching can be very expensive if there are lots of rules. - The final resulting list is the set of untracked files.
This search can be very expensive on monorepos and frequently leads to the following advice message:
$ git status
On branch main
Your branch is up to date with 'origin/main'.

It took 5.12 seconds to enumerate untracked files. 'status -uno'
may speed it up, but you have to be careful not to forget to add
new files yourself (see 'git help status').
nothing to commit, working tree clean
Normally, the complete discovery of the set of untracked files must be repeated for each command unless the [core.untrackedcache](https://git-scm.com/docs/git-config#Documentation/git-config.txt-coreuntrackedCache) feature is enabled.
The untracked-cache
The untracked-cache feature adds an extension to the index that remembers the results of the untracked search. This includes a record for each subdirectory, its mtime, and a list of the untracked files within it.
With the untracked-cache enabled, Git still needs to lstat() every directory in the worktree to confirm that the cached record is still valid.
If the mtimes match:
- Git avoids calling
opendir()andreaddir()to enumerate the files within the directory, - and just uses the existing list of untracked files from the cache record.
If the mtimes don’t match:
- Git needs to invalidate the untracked-cache entry.
- Actually open and read the directory contents.
- Call
lstat()on each file or subdirectory within the directory to determine if it is a file or directory and possibly invalidate untracked-cache entries for any subdirectories. - Use the file pathname to do tracked file filtering.
- Use the file pathname to do ignored file filtering
- Update the list of untracked files in the untracked-cache entry.
How FSMonitor helps the untracked-cache
When FSMonitor is also enabled, we can avoid the lstat() calls, because FSMonitor tells us the set of directories that may have an updated mtime, so we don’t need to search for them.
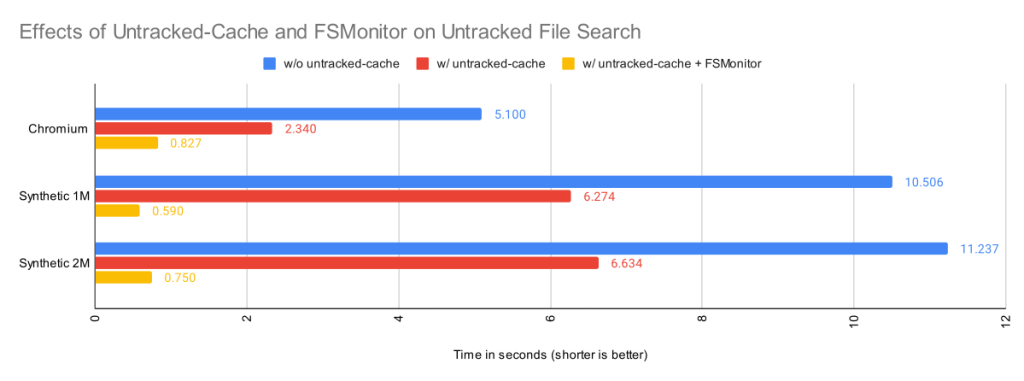
| Worktree | Files | Untracked
without Untracked-Cache |
Untracked
with Untracked-Cache |
Untracked
with Untracked-Cache and FSMonitor |
| Chromium | 393K | 5.1s | 2.3s | 0.83s |
| Synthetic 1M | 1M | 10.5s | 6.3s | 0.59s |
| Synthetic 2M | 2M | 11.2s | 6.6s | 0.75s |
By itself, the untracked-cache feature gives roughly a 2X speed up in the search for untracked files. Use both the untracked-cache and FSMonitor, and we see a 10X speedup.
A note about ignored files
You can improve Git performance by not storing temporary files, such as compiler intermediate files, inside your worktree.
During the untracked search, Git first eliminates the tracked files from the candidate untracked list using the index. Git then uses the .gitignore pattern matching rules to eliminate the ignored files. Git’s performance will suffer if there are many rules and/or many temporary files.
For example, if there is a *.o for every source file and they are stored next to their source files, then every build will delete and recreate one or more object files and cause the mtime on their parent directories to change. Those mtime changes will cause git status to invalidate the corresponding untracked-cache entries and have to re-read and re-filter those directories — even if no source files actually changed. A large number of such temporary and uninteresting files can greatly affect the performance of these Git commands.
Keeping build artifacts out of your worktree is part of the philosophy of the Scalar Project. Scalar introduced Git tooling to help you keep your worktree in <repo-name>/src/ to make it easier for you to put these other files in <repo-name>/bin/ or <repo-name>/packages/, for example.
A note about sparse checkout
So far, we’ve talked about optimizations to make Git work smarter and faster on worktree-related operations by caching data in the index and in various index extensions. Future commands are faster, because they don’t have to rediscover everything and therefore can avoid repeating unnecessary or redundant work. But we can only push that so far.
The Git sparse checkout feature approaches worktree performance from another angle. With it, you can ask Git to only populate the files that you need. The parts that you don’t need are simply not present. For example, if you only need 10% of the worktree to do your work, why populate the other 90% and force Git to search through them on every command?
Sparse checkout speeds the search for unstaged changes in refresh_index because:
- Since the unneeded files are not actually present on disk, they cannot have unstaged changes. So
refresh_indexcan completely ignore them. - The index entries for unneeded files are pre-marked during
git checkoutwith theskip-worktreebit, so they are never in an “unmarked” state. So those index entries are excluded from all of therefresh_indexloops.
Sparse checkout speeds the search for untracked files because:
- Since Git doesn’t know whether a directory contains untracked files until it searches it, the search for untracked files must visit every directory present in the worktree. Sparse checkout lets us avoid creating entire sub-trees or “cones” from the worktree. So there are fewer directories to visit.
- The untracked-cache does not need to create, save, and restore untracked-cache entries for the unpopulated directories. So reading and writing the untracked-cache extension in the index is faster.
External file system monitors
So far we have only talked about Git’s builtin FSMonitor feature. Clients use the simple IPC interface to communicate directly with git fsmonitor--daemon over a Unix domain socket or named pipe.
However, Git added support for an external file system monitor in version 2.16.0 using the core.fsmonitor hook. Here, clients communicate with a proxy child helper process through the hook interface, and it communicates with an external file system monitor process.
Conceptually, both types of file system monitors are identical. They include a long-running process that listens to the file system for changes and are able to respond to client requests for a list of recently changed files and directories. The response from both are used identically to update and modify the refresh_index and untracked searches. The only difference is in how the client talks to the service or daemon.
The original hook interface was useful, because it allowed Git to work with existing off-the-shelf tools and allowed the basic concepts within Git to be proven relatively quickly, confirm correct operation, and get a quick speed up.
Hook protocol versions
The original 2.16.0 version of the hook API used protocol version 1. It was a timestamp-based query. The client would send a timestamp value, expressed as nanoseconds since January 1, 1970, and expect a list of the files that had changed since that timestamp.
Protocol version 1 has several race conditions and should not be used anymore. Protocol version 2 was added in 2.26.0 to address these problems.
Protocol version 2 is based upon opaque tokens provided by the external file system monitor process. Clients make token-based queries that are relative to a previously issued token. Instead of making absolute requests, clients ask what has changed since their last request. The format and content of the token is defined by the external file system monitor, such as Watchman, and is treated as an opaque string by Git client commands.
The hook protocol is not used by the builtin FSMonitor.
Using Watchman and the sample hook script
Watchman is a popular external file system monitor tool and a Watchman-compatible hook script is included with Git and copied into new worktrees during git init.
To enable it:
- Install Watchman on your system.
- Tell Watchman to watch your worktree:
$ watchman watch .
{
    "version": "2022.01.31.00",
    "watch": "/Users/jeffhost/work/chromium",
    "watcher": "fsevents"
}
- Install the sample hook script to teach Git how to talk to Watchman:
$ cp .git/hooks/fsmonitor-watchman.sample .git/hooks/query-watchman
- Tell Git to use the hook:
$ git config core.fsmonitor .git/hooks/query-watchman
Using Watchman with a custom hook
The hook interface is not limited to running shell or Perl scripts. The included sample hook script is just an example implementation. Engineers at Dropbox described how they were able to speed up Git with a custom hook executable.
Final Remarks
In this article, we have seen how a file system monitor can speed up commands like git status by solving the “discovery” problem and eliminating the need to search the worktree for changes in every command. This greatly reduces the pain of working with monorepos.
This feature was created in two efforts:
- First, Git was taught to work with existing off-the-shelf tools, like Watchman. This allowed the basic concepts to be proven relatively quickly. And for users who already use Watchman for other purposes, it allows Git to efficiently interoperate with them.
- Second, we brought the feature “in the box” to reduce the setup complexity and third-party dependencies, which some users may find useful. It also lets us consider adding Git-specific features that a generic monitoring tool might not want, such as understanding ignored files and omitting them from the service’s response.
Having both options available lets users choose the best solution for their needs.
Regardless of which type of file system monitor you use, it will help make your monorepos more usable.
The post Improve Git monorepo performance with a file system monitor appeared first on The GitHub Blog.
]]>The post How we think about browsers appeared first on The GitHub Blog.
]]>JavaScript doesn’t get executed on very old browsers when native syntax for new language features is encountered. However, thanks to GitHub being built following the principle of progressive enhancement, users of older browsers still get to interact with basic features of GitHub, while users with more capable browsers get a faster experience.
GitHub will soon be serving JavaScript using syntax features found in the ECMAScript 2020 standard, which includes the optional chaining and nullish coalescing operators. This change will lead to a 10kb reduction in JavaScript across the site.
We want to take this opportunity to go into detail about how we think about browser support. We will share data about our customers’ browser usage patterns and introduce you to some of the tools we use to make sure our customers are getting the best experience, including our recently open-sourced browser support library.
What browsers do our customers use?
To monitor the performance of pages, we collect some usage information. We parse User-Agent headers as part of our analytics, which lets us make informed decisions based on the browsers our users are running. Some of these decisions include, what browsers we execute automated tests on, the configuration of our static analysis tools, and even what features we ship. Around 95% of requests to our web services come from browsers with an identifying user agent string. Another 1% of requests have no User-Agent header, and the remaining 4% make up scripts, like Python (2%) or programs like cURL (0.5%).
We encourage users to use the latest versions of Chrome, Edge, Firefox, or Safari, and our data shows that a majority of users do so. Here’s what the browser market share looked like for visits to github.com between May 9-13, 2022:

| Beta | Latest | -1 | -2 | -3 | -4 | -5 | -6 | -7 | -8 | Total | |
|---|---|---|---|---|---|---|---|---|---|---|---|
| Chrome | 0.2950% | 53.0551% | 12.7103% | 1.8120% | 0.8076% | 0.4737% | 0.5504% | 0.1728% | 0.1677% | 0.1029% | 70.1478% |
| Edge | 0.0000% | 6.3404% | 0.5328% | 0.0978% | 0.0432% | 0.0202% | 0.0143% | 0.0063% | 0.0058% | 0.0046% | 7.0657% |
| Firefox | 0.6525% | 7.7374% | 2.9717% | 0.2243% | 0.1041% | 0.1018% | 0.0541% | 0.0396% | 0.0219% | 0.0172% | 11.9249% |
| Safari | 0.0000% | 2.8802% | 0.7049% | 0.2110% | 0.0000% | 0.3288% | 0.0000% | 0.0696% | 0.0000% | 0.0094% | 4.2038% |
| Opera | 0.0030% | 0.2650% | 1.1173% | 0.0112% | 0.0044% | 0.0043% | 0.0016% | 0.0017% | 0.0015% | 0.0011% | 1.4112% |
| Internet Explorer | 0.0000% | 0.0658% | 0.0001% | 0.0001% | 0.0000% | 0.0000% | 0.0001% | 0.0000% | 0.0000% | 0.0000% | 0.0662% |
| Samsung Internet | 0.0000% | 0.0276% | 0.0007% | 0.0012% | 0.0008% | 0.0000% | 0.0000% | 0.0000% | 0.0000% | 0.0000% | 0.0302% |
| Total | 0.9507% | 70.3716% | 18.0379% | 2.3576% | 0.9602% | 0.9289% | 0.6207% | 0.2901% | 0.1968% | 0.1352% | 94.8498% |
The above graph shows two dimensions: market share across browser vendors, and market share across versions. Looking at traffic with a branded user-agent string shows that roughly 95% of requests are coming from one of seven browsers. It also shows us that—perhaps unsurprisingly—the majority of requests come from Google Chrome (more than 70%), 12% from Firefox, 7% from Edge, 4.2% from Safari, and 1.4% from Opera (all other browser vendors represent significantly less than 1% of traffic).
The fall-off for outdated versions of browsers is very steep. While over 70% of requests come from the latest release of a browser, 18% come from the previous release. Requests coming from three versions behind the latest fall to less than 1%. These numbers tell us that we can make the most impact by concentrating on Chrome, Firefox, Edge, and Safari, in that order. That’s not the whole story, though. Another vector to look at is over time:

| 15.4 | 15.3 | 15.2 | 15.1 | 15.0 | 14.1 | 14.0 | 13.1 | 13.0 | 12.1 | 12.0 | <12 | |
|---|---|---|---|---|---|---|---|---|---|---|---|---|
| 2022-01-01 | 0.2130% | 1.9933% | 31.9792% | 25.3472% | 6.1477% | 11.5005% | 3.9045% | 2.3446% | 0.5210% | 0.9379% | 0.0336% | 15.0773% |
| 2022-01-02 | 0.2548% | 2.0334% | 32.8731% | 25.9360% | 6.4715% | 12.0837% | 3.7401% | 2.4652% | 0.5292% | 0.8598% | 0.0297% | 12.7235% |
| 2022-01-03 | 0.3078% | 1.6285% | 34.9256% | 27.0666% | 7.3738% | 13.7125% | 3.7582% | 2.1204% | 0.4217% | 0.6152% | 0.0238% | 8.0459% |
| 2022-01-04 | 0.3637% | 1.4860% | 35.6528% | 26.9236% | 7.6980% | 14.2046% | 3.6510% | 2.0938% | 0.3804% | 0.5613% | 0.0305% | 6.9543% |
| 2022-01-05 | 0.3519% | 1.4723% | 35.8533% | 26.3673% | 7.6227% | 14.5006% | 3.7131% | 2.1403% | 0.3793% | 0.5682% | 0.0254% | 7.0055% |
| 2022-01-06 | 0.3575% | 1.5431% | 36.6670% | 25.8058% | 7.5075% | 14.2149% | 3.7570% | 2.1580% | 0.3888% | 0.6040% | 0.0242% | 6.9722% |
| 2022-01-07 | 0.4123% | 1.6277% | 37.4426% | 25.2663% | 7.3924% | 13.8618% | 3.6753% | 2.0874% | 0.4024% | 0.5904% | 0.0270% | 7.2144% |
| 2022-01-08 | 0.3237% | 1.9625% | 35.9640% | 24.3500% | 6.2977% | 12.0691% | 3.7139% | 2.3841% | 0.5170% | 0.8028% | 0.0266% | 11.5885% |
| 2022-01-09 | 0.2964% | 1.9599% | 36.0700% | 24.2496% | 6.3270% | 12.0979% | 3.7857% | 2.3146% | 0.4816% | 0.8567% | 0.0242% | 11.5363% |
| 2022-01-10 | 0.3488% | 1.5101% | 39.0599% | 24.5018% | 7.2861% | 14.0757% | 3.6064% | 2.0192% | 0.3818% | 0.5383% | 0.0285% | 6.6433% |
| 2022-01-11 | 0.4108% | 1.5541% | 39.4265% | 24.3465% | 7.3778% | 14.1840% | 3.5905% | 1.9870% | 0.3366% | 0.5555% | 0.0253% | 6.2052% |
| 2022-01-12 | 0.3743% | 1.5182% | 40.0054% | 23.9508% | 7.3054% | 14.1456% | 3.5695% | 2.0163% | 0.3643% | 0.5105% | 0.0308% | 6.2090% |
| 2022-01-13 | 0.3380% | 1.5659% | 40.3951% | 23.5803% | 7.2104% | 14.1495% | 3.6099% | 1.9705% | 0.3716% | 0.5117% | 0.0229% | 6.2743% |
| 2022-01-14 | 0.3709% | 1.6172% | 40.8321% | 23.4113% | 6.9690% | 13.5323% | 3.5354% | 1.9806% | 0.3559% | 0.5424% | 0.0251% | 6.8279% |
| 2022-01-15 | 0.2870% | 2.0547% | 39.7351% | 22.0067% | 5.9847% | 11.7234% | 3.6011% | 2.2909% | 0.4668% | 0.7720% | 0.0287% | 11.0489% |
| 2022-01-16 | 0.2964% | 2.0923% | 40.8441% | 20.6853% | 5.9118% | 11.8049% | 3.6625% | 2.3851% | 0.4599% | 0.8312% | 0.0294% | 10.9970% |
| 2022-01-17 | 0.3043% | 1.6554% | 43.8724% | 20.6116% | 6.6334% | 13.7081% | 3.5519% | 2.0195% | 0.3721% | 0.5356% | 0.0287% | 6.7071% |
| 2022-01-18 | 0.3448% | 1.5978% | 45.3308% | 19.6763% | 6.7137% | 13.6977% | 3.5498% | 1.9990% | 0.3478% | 0.5166% | 0.0289% | 6.1968% |
| 2022-01-19 | 0.3490% | 1.6179% | 46.3810% | 19.0037% | 6.5909% | 13.7031% | 3.4676% | 1.9497% | 0.3358% | 0.4847% | 0.0264% | 6.0901% |
| 2022-01-20 | 0.3410% | 1.6362% | 47.2639% | 18.3797% | 6.4656% | 13.3978% | 3.3907% | 1.9803% | 0.3393% | 0.5244% | 0.0245% | 6.2566% |
| 2022-01-21 | 0.3553% | 1.7170% | 48.0184% | 17.4454% | 6.3012% | 13.1411% | 3.3914% | 2.0109% | 0.3696% | 0.4934% | 0.0230% | 6.7332% |
| 2022-01-22 | 0.2929% | 2.3538% | 46.1479% | 16.4726% | 5.4806% | 11.2732% | 3.4515% | 2.1378% | 0.4547% | 0.7435% | 0.0291% | 11.1624% |
| 2022-01-23 | 0.2595% | 2.3385% | 47.0822% | 15.5800% | 5.4940% | 11.0466% | 3.5465% | 2.2365% | 0.4565% | 0.7749% | 0.0233% | 11.1614% |
| 2022-01-24 | 0.3607% | 1.7504% | 50.7307% | 15.3784% | 6.1093% | 12.9047% | 3.4166% | 2.0184% | 0.3442% | 0.4872% | 0.0225% | 6.4769% |
| 2022-01-25 | 0.3654% | 1.7706% | 51.9246% | 14.6195% | 6.0739% | 12.9834% | 3.3441% | 1.9226% | 0.3283% | 0.4742% | 0.0197% | 6.1736% |
| 2022-01-26 | 0.3465% | 2.1688% | 52.4595% | 14.0287% | 5.9250% | 12.4463% | 3.3065% | 1.9205% | 0.3530% | 0.5013% | 0.0244% | 6.5195% |
| 2022-01-27 | 0.3628% | 7.7522% | 47.3489% | 13.5902% | 5.8790% | 12.5425% | 3.2687% | 1.9584% | 0.3513% | 0.4820% | 0.0285% | 6.4356% |
| 2022-01-28 | 0.8512% | 12.2593% | 43.2173% | 12.7719% | 5.7684% | 12.2779% | 3.2807% | 1.8948% | 0.3661% | 0.4896% | 0.0249% | 6.7981% |
| 2022-01-29 | 1.5324% | 15.5746% | 37.9759% | 11.4900% | 5.0904% | 10.8157% | 3.2414% | 2.2146% | 0.4751% | 0.7246% | 0.0226% | 10.8425% |
| 2022-01-30 | 1.8095% | 17.1024% | 36.5444% | 11.5112% | 5.0038% | 10.5058% | 3.3404% | 2.2842% | 0.4604% | 0.7569% | 0.0187% | 10.6623% |
| 2022-01-31 | 1.5814% | 17.6461% | 38.7703% | 12.5933% | 5.6880% | 12.0274% | 3.1897% | 1.8416% | 0.3408% | 0.4923% | 0.0240% | 5.8050% |
| 2022-02-01 | 1.7441% | 19.2814% | 37.2947% | 12.3450% | 5.5508% | 11.9390% | 3.1856% | 1.8109% | 0.3369% | 0.4689% | 0.0228% | 6.0199% |
| 2022-02-02 | 1.8425% | 20.6234% | 36.1439% | 12.2229% | 5.5517% | 11.8100% | 3.0868% | 1.7966% | 0.3369% | 0.4872% | 0.0285% | 6.0697% |
| 2022-02-03 | 1.8914% | 21.5787% | 34.9534% | 12.0932% | 5.4199% | 11.7927% | 3.1686% | 1.8609% | 0.3504% | 0.4656% | 0.0240% | 6.4013% |
| 2022-02-04 | 1.9648% | 22.7768% | 34.0393% | 11.7468% | 5.2886% | 11.4763% | 3.0458% | 1.8618% | 0.3508% | 0.5207% | 0.0221% | 6.9061% |
| 2022-02-05 | 2.3963% | 23.4144% | 30.8252% | 10.7756% | 4.6826% | 10.0675% | 3.2277% | 2.1561% | 0.4480% | 0.7145% | 0.0214% | 11.2706% |
| 2022-02-06 | 2.3912% | 24.0953% | 30.5678% | 10.4257% | 4.7046% | 10.0236% | 3.3234% | 2.1215% | 0.4327% | 0.7056% | 0.0193% | 11.1893% |
| 2022-02-07 | 2.0336% | 24.6938% | 32.2185% | 11.5380% | 5.1985% | 11.8112% | 3.1986% | 1.9324% | 0.3535% | 0.4776% | 0.0249% | 6.5194% |
| 2022-02-08 | 2.0578% | 25.5825% | 31.5513% | 11.4319% | 5.1997% | 11.8368% | 3.1809% | 1.8839% | 0.3255% | 0.4600% | 0.0220% | 6.4678% |
| 2022-02-09 | 2.1357% | 26.4126% | 31.2722% | 11.3999% | 5.2737% | 11.9741% | 3.1823% | 1.9032% | 0.2298% | 0.2883% | 0.0204% | 5.9077% |
| 2022-02-10 | 2.1586% | 27.2403% | 30.8552% | 11.3862% | 5.2045% | 11.8815% | 3.1880% | 1.5341% | 0.2342% | 0.2931% | 0.0234% | 6.0009% |
| 2022-02-11 | 2.3263% | 28.7838% | 30.1344% | 11.3683% | 5.1761% | 11.6652% | 3.1655% | 0.8880% | 0.1781% | 0.2133% | 0.0214% | 6.0796% |
| 2022-02-12 | 2.7622% | 28.4764% | 26.9469% | 9.7973% | 4.4372% | 9.9020% | 3.1473% | 2.1256% | 0.4193% | 0.7154% | 0.0241% | 11.2464% |
| 2022-02-13 | 2.6300% | 28.9074% | 26.5648% | 9.9005% | 4.4070% | 9.9237% | 3.1472% | 2.2069% | 0.4375% | 0.7176% | 0.0234% | 11.1339% |
| 2022-02-14 | 2.2108% | 30.1253% | 28.0680% | 10.8367% | 5.0225% | 11.6307% | 3.1060% | 1.7727% | 0.3190% | 0.4699% | 0.0230% | 6.4155% |
| 2022-02-15 | 2.2626% | 31.0756% | 27.6637% | 10.8023% | 4.9224% | 11.5579% | 3.0697% | 1.7311% | 0.3060% | 0.4568% | 0.0263% | 6.1257% |
| 2022-02-16 | 2.3030% | 31.5893% | 27.2155% | 10.7267% | 4.8788% | 11.4932% | 2.9605% | 1.7814% | 0.3026% | 0.4668% | 0.0264% | 6.2558% |
| 2022-02-17 | 2.3139% | 32.1564% | 26.7888% | 10.6523% | 4.7749% | 11.4135% | 3.0497% | 1.8037% | 0.3309% | 0.4543% | 0.0254% | 6.2362% |
| 2022-02-18 | 2.3419% | 33.8505% | 25.1471% | 10.3232% | 4.6872% | 11.2973% | 2.9507% | 1.8080% | 0.3524% | 0.4658% | 0.0234% | 6.7524% |
| 2022-02-19 | 2.8255% | 35.4968% | 21.2425% | 9.0705% | 4.3585% | 9.6129% | 3.0839% | 2.1391% | 0.4321% | 0.7214% | 0.0240% | 10.9927% |
| 2022-02-20 | 2.7597% | 37.2786% | 19.6970% | 9.0995% | 4.3411% | 9.6230% | 3.0634% | 2.1577% | 0.4466% | 0.6930% | 0.0223% | 10.8180% |
| 2022-02-21 | 2.2972% | 39.5270% | 20.2617% | 9.8308% | 4.5785% | 11.0922% | 3.0427% | 1.8432% | 0.3359% | 0.4971% | 0.0203% | 6.6735% |
| 2022-02-22 | 2.3285% | 41.6072% | 18.8362% | 9.5382% | 4.5626% | 11.1426% | 3.0037% | 1.8037% | 0.3116% | 0.4570% | 0.0206% | 6.3882% |
| 2022-02-23 | 2.3564% | 42.9442% | 17.7843% | 9.3653% | 4.5609% | 11.0347% | 2.8992% | 1.7738% | 0.3189% | 0.4421% | 0.0198% | 6.5005% |
| 2022-02-24 | 2.3331% | 43.8819% | 16.9144% | 9.1178% | 4.5580% | 11.1665% | 2.9641% | 1.7680% | 0.3063% | 0.4369% | 0.0224% | 6.5306% |
| 2022-02-25 | 2.3644% | 45.0140% | 15.8175% | 8.8273% | 4.4317% | 10.9711% | 2.9355% | 1.7624% | 0.3324% | 0.4556% | 0.0238% | 7.0641% |
| 2022-02-26 | 2.9596% | 44.4252% | 13.1945% | 7.6195% | 3.9776% | 9.4234% | 3.1355% | 2.0300% | 0.5206% | 0.7039% | 0.0223% | 11.9878% |
| 2022-02-27 | 2.8501% | 45.0292% | 12.5025% | 7.7242% | 4.0507% | 9.4992% | 3.0954% | 2.1008% | 0.4980% | 0.6989% | 0.0251% | 11.9258% |
| 2022-02-28 | 2.3807% | 47.0753% | 14.2634% | 8.4807% | 4.2220% | 10.9576% | 3.0524% | 1.8148% | 0.3434% | 0.4632% | 0.0242% | 6.9222% |
| 2022-03-01 | 2.3748% | 48.2034% | 13.7801% | 8.3157% | 4.2605% | 10.7307% | 2.9418% | 1.8095% | 0.3259% | 0.4437% | 0.0224% | 6.7913% |
| 2022-03-02 | 2.3629% | 48.7995% | 13.5339% | 8.1894% | 4.2284% | 10.7893% | 2.9092% | 1.7475% | 0.3293% | 0.4560% | 0.0220% | 6.6327% |
| 2022-03-03 | 2.4486% | 49.7154% | 12.6928% | 8.1700% | 4.1801% | 10.6387% | 2.8873% | 1.7340% | 0.3109% | 0.4497% | 0.0246% | 6.7479% |
| 2022-03-04 | 2.5373% | 50.2026% | 12.4981% | 7.7686% | 4.1271% | 10.5053% | 2.8372% | 1.7236% | 0.3080% | 0.4493% | 0.0255% | 7.0174% |
| 2022-03-05 | 3.0231% | 49.3317% | 10.5426% | 6.5147% | 3.7707% | 9.0290% | 3.0784% | 2.0464% | 0.4182% | 0.6288% | 0.0208% | 11.5956% |
| 2022-03-06 | 3.0723% | 49.6284% | 10.0200% | 6.7391% | 3.7704% | 9.0282% | 3.0924% | 2.1063% | 0.4288% | 0.6881% | 0.0213% | 11.4046% |
| 2022-03-07 | 2.4667% | 51.7157% | 11.7176% | 7.6974% | 4.1000% | 10.2989% | 2.8448% | 1.7253% | 0.3185% | 0.4412% | 0.0236% | 6.6503% |
| 2022-03-08 | 2.4190% | 52.4292% | 11.3917% | 7.3946% | 4.1027% | 10.3559% | 2.8335% | 1.7378% | 0.3259% | 0.4500% | 0.0230% | 6.5368% |
| 2022-03-09 | 2.4744% | 52.9758% | 11.0708% | 7.4840% | 4.0474% | 10.3307% | 2.8409% | 1.6682% | 0.3015% | 0.4183% | 0.0210% | 6.3667% |
| 2022-03-10 | 2.5404% | 53.2418% | 10.8388% | 7.3800% | 3.9569% | 10.2019% | 2.8462% | 1.7425% | 0.3027% | 0.4212% | 0.0254% | 6.5022% |
| 2022-03-11 | 2.6346% | 53.8851% | 10.3123% | 7.1008% | 3.8969% | 9.8746% | 2.7686% | 1.6714% | 0.2988% | 0.4224% | 0.0252% | 7.1092% |
| 2022-03-12 | 3.2418% | 52.4146% | 8.4171% | 6.0948% | 3.5575% | 8.6494% | 3.0048% | 2.0180% | 0.3927% | 0.7005% | 0.0251% | 11.4838% |
| 2022-03-13 | 3.2069% | 52.3926% | 8.5002% | 6.1721% | 3.5239% | 8.4507% | 2.9757% | 2.1148% | 0.3755% | 0.7167% | 0.0254% | 11.5456% |
| 2022-03-14 | 3.2185% | 54.3662% | 9.8584% | 7.0464% | 3.8492% | 9.8257% | 2.7413% | 1.6965% | 0.2680% | 0.4273% | 0.0270% | 6.6756% |
| 2022-03-15 | 11.1192% | 47.4059% | 9.5438% | 6.8719% | 3.7611% | 9.7005% | 2.7719% | 1.6308% | 0.2637% | 0.4211% | 0.0250% | 6.4849% |
| 2022-03-16 | 17.9069% | 41.3967% | 9.1987% | 6.6590% | 3.7184% | 9.5772% | 2.6822% | 1.6273% | 0.2877% | 0.4349% | 0.0197% | 6.4914% |
| 2022-03-17 | 21.7348% | 38.1323% | 8.8607% | 6.5819% | 3.6503% | 9.4056% | 2.6279% | 1.6295% | 0.2814% | 0.4449% | 0.0250% | 6.6258% |
| 2022-03-18 | 24.4165% | 35.7041% | 8.5482% | 6.3399% | 3.5433% | 9.0851% | 2.5852% | 1.6362% | 0.2685% | 0.4610% | 0.0258% | 7.3863% |
| 2022-03-19 | 26.2368% | 31.9489% | 6.8779% | 5.5836% | 3.3195% | 7.9382% | 2.7793% | 1.9717% | 0.3594% | 0.6485% | 0.0219% | 12.3144% |
| 2022-03-20 | 27.3687% | 30.7753% | 7.0252% | 5.5489% | 3.3195% | 7.9491% | 2.8717% | 1.9881% | 0.3587% | 0.6629% | 0.0231% | 12.1088% |
| 2022-03-21 | 28.2620% | 32.3271% | 8.3673% | 6.3448% | 3.4783% | 9.2887% | 2.6006% | 1.6620% | 0.2865% | 0.4242% | 0.0238% | 6.9347% |
| 2022-03-22 | 29.5670% | 31.4166% | 8.2768% | 6.3061% | 3.4969% | 9.2905% | 2.5700% | 1.5872% | 0.2591% | 0.4296% | 0.0227% | 6.7774% |
| 2022-03-23 | 30.6539% | 30.6544% | 8.0608% | 6.2326% | 3.4798% | 9.1248% | 2.5844% | 1.6372% | 0.2534% | 0.4191% | 0.0235% | 6.8761% |
| 2022-03-24 | 32.0481% | 29.9540% | 8.0759% | 6.0714% | 3.4595% | 9.0259% | 2.5544% | 1.5634% | 0.2705% | 0.4064% | 0.0225% | 6.5478% |
| 2022-03-25 | 32.7566% | 28.9962% | 7.7413% | 5.9692% | 3.3709% | 8.7142% | 2.5446% | 1.5842% | 0.2667% | 0.4180% | 0.0235% | 7.6147% |
| 2022-03-26 | 32.5970% | 26.7095% | 6.2462% | 5.0950% | 3.2226% | 7.6540% | 2.7770% | 1.8228% | 0.3847% | 0.6553% | 0.0210% | 12.8149% |
| 2022-03-27 | 33.0257% | 26.3003% | 6.3665% | 5.3195% | 3.2245% | 7.8100% | 2.8208% | 1.8248% | 0.3827% | 0.6404% | 0.0235% | 12.2614% |
| 2022-03-28 | 34.6919% | 27.5399% | 7.6902% | 5.9742% | 3.3578% | 8.8958% | 2.5193% | 1.6230% | 0.2658% | 0.3997% | 0.0232% | 7.0192% |
| 2022-03-29 | 35.6580% | 27.0895% | 7.6128% | 5.9695% | 3.3326% | 8.7237% | 2.4484% | 1.5631% | 0.2741% | 0.3802% | 0.0223% | 6.9258% |
| 2022-03-30 | 36.0933% | 26.8011% | 7.4668% | 5.9183% | 3.3682% | 8.6179% | 2.4670% | 1.5698% | 0.2556% | 0.4017% | 0.0195% | 7.0208% |
| 2022-03-31 | 36.7627% | 26.3586% | 7.4152% | 5.8338% | 3.2992% | 8.6070% | 2.5025% | 1.5928% | 0.2742% | 0.4120% | 0.0184% | 6.9235% |
| 2022-04-01 | 37.7935% | 25.6391% | 7.0944% | 5.6951% | 3.3207% | 8.4395% | 2.3936% | 1.5895% | 0.2895% | 0.4032% | 0.0177% | 7.3242% |
| 2022-04-02 | 36.7583% | 23.8424% | 6.0495% | 4.9378% | 3.1161% | 7.6109% | 2.7326% | 1.8943% | 0.3616% | 0.6358% | 0.0209% | 12.0398% |
| 2022-04-03 | 38.0555% | 23.4329% | 5.9867% | 5.0717% | 3.1091% | 7.4917% | 2.6295% | 1.8512% | 0.3456% | 0.6151% | 0.0185% | 11.3926% |
| 2022-04-04 | 39.5734% | 24.4753% | 7.2343% | 5.6909% | 3.1580% | 8.4157% | 2.4270% | 1.5334% | 0.2433% | 0.4101% | 0.0237% | 6.8149% |
| 2022-04-05 | 40.1999% | 24.3237% | 7.1533% | 5.5920% | 3.2204% | 8.3465% | 2.3998% | 1.4640% | 0.2627% | 0.3814% | 0.0251% | 6.6309% |
| 2022-04-06 | 40.3972% | 23.9005% | 7.0750% | 5.5978% | 3.4175% | 8.4546% | 2.3345% | 1.5084% | 0.2411% | 0.4040% | 0.0226% | 6.6467% |
| 2022-04-07 | 40.6483% | 23.5724% | 6.9376% | 5.5906% | 3.5983% | 8.4082% | 2.3696% | 1.5432% | 0.2714% | 0.3932% | 0.0221% | 6.6452% |
| 2022-04-08 | 41.0291% | 23.0447% | 6.7669% | 5.3345% | 3.7167% | 8.1355% | 2.3707% | 1.5204% | 0.2979% | 0.4360% | 0.0227% | 7.3250% |
| 2022-04-09 | 39.0096% | 21.5707% | 5.5139% | 4.6910% | 3.8459% | 7.1101% | 2.6170% | 1.8408% | 0.3681% | 0.6555% | 0.0163% | 12.7611% |
| 2022-04-10 | 38.9654% | 21.5612% | 5.7157% | 4.7531% | 3.9948% | 7.0060% | 2.6146% | 1.9593% | 0.3643% | 0.6320% | 0.0189% | 12.4146% |
| 2022-04-11 | 41.7134% | 22.3259% | 6.8796% | 5.4925% | 3.8380% | 8.2313% | 2.3455% | 1.5951% | 0.2604% | 0.3967% | 0.0202% | 6.9013% |
| 2022-04-12 | 42.9776% | 21.4756% | 6.6304% | 5.3460% | 3.9136% | 8.1430% | 2.3224% | 1.4970% | 0.2704% | 0.4073% | 0.0232% | 6.9935% |
| 2022-04-13 | 44.8529% | 19.5508% | 6.5201% | 5.2781% | 3.9081% | 8.1321% | 2.3117% | 1.4651% | 0.2597% | 0.3798% | 0.0203% | 7.3213% |
| 2022-04-14 | 47.2604% | 18.5562% | 6.3329% | 5.0969% | 3.9568% | 7.8447% | 2.2326% | 1.4409% | 0.2660% | 0.3694% | 0.0195% | 6.6238% |
| 2022-04-15 | 46.1738% | 17.2112% | 5.7005% | 4.8802% | 4.1301% | 7.6028% | 2.4450% | 1.5947% | 0.3140% | 0.4888% | 0.0221% | 9.4369% |
| 2022-04-16 | 45.0816% | 15.9900% | 4.9427% | 4.2670% | 4.3097% | 6.9089% | 2.5115% | 1.7646% | 0.3776% | 0.6567% | 0.0196% | 13.1700% |
| 2022-04-17 | 45.9303% | 15.1178% | 4.8665% | 4.3033% | 4.3275% | 6.9231% | 2.6406% | 1.7807% | 0.3541% | 0.6456% | 0.0216% | 13.0890% |
| 2022-04-18 | 48.5945% | 15.2044% | 5.8556% | 4.8611% | 4.2658% | 7.9850% | 2.4404% | 1.6419% | 0.2887% | 0.4655% | 0.0209% | 8.3763% |
| 2022-04-19 | 50.8857% | 14.9250% | 5.8652% | 5.0294% | 3.9808% | 7.8429% | 2.2999% | 1.4581% | 0.2670% | 0.3945% | 0.0178% | 7.0337% |
| 2022-04-20 | 51.9700% | 14.2590% | 5.8156% | 4.8890% | 4.0109% | 7.6977% | 2.2176% | 1.4981% | 0.2546% | 0.4005% | 0.0209% | 6.9662% |
| 2022-04-21 | 52.5838% | 13.5549% | 5.7156% | 4.8685% | 3.9548% | 7.6767% | 2.3164% | 1.4839% | 0.2606% | 0.4122% | 0.0211% | 7.1515% |
| 2022-04-22 | 53.0145% | 12.8874% | 5.4692% | 4.7749% | 4.0399% | 7.5126% | 2.2910% | 1.4816% | 0.2738% | 0.3989% | 0.0203% | 7.8361% |
| 2022-04-23 | 51.2057% | 11.0804% | 4.4180% | 4.1472% | 4.4620% | 6.6022% | 2.4416% | 1.8031% | 0.3768% | 0.5984% | 0.0245% | 12.8400% |
| 2022-04-24 | 51.2867% | 10.9186% | 4.6488% | 4.1452% | 4.2797% | 6.9482% | 2.6263% | 1.8961% | 0.3964% | 0.6026% | 0.0243% | 12.2271% |
| 2022-04-25 | 54.1650% | 12.3169% | 5.5367% | 4.7520% | 4.0855% | 7.5898% | 2.2639% | 1.4719% | 0.2677% | 0.4090% | 0.0216% | 7.1201% |
| 2022-04-26 | 55.1848% | 11.9726% | 5.3847% | 4.6786% | 4.0406% | 7.4071% | 2.2462% | 1.4609% | 0.2643% | 0.3727% | 0.0237% | 6.9636% |
| 2022-04-27 | 55.9856% | 11.5124% | 5.3171% | 4.5683% | 3.9992% | 7.3195% | 2.2536% | 1.4565% | 0.2617% | 0.3671% | 0.0254% | 6.9336% |
| 2022-04-28 | 56.1709% | 11.2112% | 5.3278% | 4.5597% | 4.0453% | 7.2469% | 2.1800% | 1.4478% | 0.2588% | 0.3927% | 0.0223% | 7.1366% |
| 2022-04-29 | 56.4630% | 10.8456% | 5.0356% | 4.3545% | 4.1464% | 7.2195% | 2.1173% | 1.4117% | 0.2479% | 0.4089% | 0.0203% | 7.7295% |
| 2022-04-30 | 53.9976% | 8.9824% | 4.1147% | 3.7867% | 4.3880% | 6.3945% | 2.5134% | 1.7417% | 0.3505% | 0.6254% | 0.0265% | 13.0786% |
Safari releases a major version each year alongside macOS and iOS. The above shows the release cadence from January-April for Safari traffic on GitHub.com. While we see older versions used quite heavily, we also see regular upgrade cadence from Safari users, especially 15.x releases, with peak-to-peak usage approximately every eight weeks.

| 101 | 100 | 99 | 98 | 97 | 96 | <90 | 95 | 94 | 93 | 92 | 91 | 90 | |
|---|---|---|---|---|---|---|---|---|---|---|---|---|---|
| 2022-01-01 | 0.0000% | 0.3491% | 0.1468% | 0.2108% | 0.3386% | 86.6783% | 5.1358% | 2.2244% | 1.7838% | 0.5934% | 1.5257% | 0.5474% | 0.4658% |
| 2022-01-02 | 0.0000% | 0.3455% | 0.1363% | 0.1842% | 0.3181% | 88.7497% | 3.2558% | 2.2186% | 1.8004% | 0.5739% | 1.4336% | 0.5302% | 0.4538% |
| 2022-01-03 | 0.0000% | 0.2731% | 0.0937% | 0.1450% | 0.2434% | 90.4934% | 2.1269% | 2.5113% | 1.5836% | 0.5793% | 1.0352% | 0.5289% | 0.3861% |
| 2022-01-04 | 0.0000% | 0.2561% | 0.0908% | 0.1459% | 0.2757% | 90.3926% | 2.2204% | 2.5350% | 1.5445% | 0.5799% | 1.0151% | 0.5280% | 0.4160% |
| 2022-01-05 | 0.0000% | 0.2556% | 0.0899% | 0.1520% | 4.1497% | 86.6672% | 2.2260% | 2.4636% | 1.5101% | 0.5757% | 0.9840% | 0.5220% | 0.4042% |
| 2022-01-06 | 0.0000% | 0.2508% | 0.0815% | 0.1412% | 10.7723% | 80.2589% | 2.1902% | 2.3842% | 1.4689% | 0.5581% | 0.9913% | 0.5089% | 0.3937% |
| 2022-01-07 | 0.0000% | 0.1932% | 0.0962% | 0.1629% | 21.5610% | 69.5394% | 2.2636% | 2.2909% | 1.4494% | 0.5384% | 1.0015% | 0.5018% | 0.4017% |
| 2022-01-08 | 0.0000% | 0.1744% | 0.1480% | 0.2586% | 33.5510% | 56.3914% | 2.9587% | 2.0026% | 1.7096% | 0.5449% | 1.3334% | 0.5045% | 0.4230% |
| 2022-01-09 | 0.0000% | 0.1518% | 0.1521% | 0.2564% | 37.8032% | 52.5723% | 2.8295% | 1.8732% | 1.6458% | 0.5064% | 1.3001% | 0.4884% | 0.4208% |
| 2022-01-10 | 0.0000% | 0.1330% | 0.1059% | 0.1782% | 36.7369% | 54.4084% | 2.4167% | 2.1394% | 1.4727% | 0.5493% | 0.9584% | 0.5085% | 0.3927% |
| 2022-01-11 | 0.0000% | 0.1219% | 0.1051% | 0.2332% | 45.4664% | 46.0626% | 2.2293% | 2.0457% | 1.4169% | 0.5245% | 0.9212% | 0.4878% | 0.3853% |
| 2022-01-12 | 0.0000% | 0.1134% | 0.1468% | 0.2459% | 57.1392% | 34.5425% | 2.1934% | 1.9506% | 1.3772% | 0.5162% | 0.9154% | 0.4807% | 0.3786% |
| 2022-01-13 | 0.0000% | 0.1046% | 0.1624% | 0.2693% | 65.4838% | 26.4436% | 2.0266% | 1.8866% | 1.3646% | 0.4987% | 0.9004% | 0.4861% | 0.3733% |
| 2022-01-14 | 0.0000% | 0.1031% | 0.1829% | 0.3063% | 70.0467% | 21.6414% | 2.2699% | 1.8110% | 1.3665% | 0.4882% | 0.9326% | 0.4758% | 0.3755% |
| 2022-01-15 | 0.0000% | 0.1537% | 0.2627% | 0.4051% | 74.7938% | 15.8317% | 2.8385% | 1.6009% | 1.5320% | 0.4885% | 1.2465% | 0.4664% | 0.3802% |
| 2022-01-16 | 0.0000% | 0.1602% | 0.2558% | 0.3909% | 76.5597% | 14.3898% | 2.7115% | 1.5114% | 1.5108% | 0.4653% | 1.2131% | 0.4474% | 0.3840% |
| 2022-01-17 | 0.0000% | 0.1317% | 0.1893% | 0.2867% | 76.2164% | 15.8049% | 2.0853% | 1.6876% | 1.3236% | 0.4815% | 0.9184% | 0.4969% | 0.3777% |
| 2022-01-18 | 0.0000% | 0.1289% | 0.1898% | 0.2709% | 77.6409% | 14.7878% | 1.9411% | 1.6397% | 1.2295% | 0.4692% | 0.8660% | 0.4755% | 0.3606% |
| 2022-01-19 | 0.0000% | 0.1319% | 0.1909% | 0.2707% | 79.0723% | 13.6180% | 1.9163% | 1.5781% | 1.0862% | 0.4649% | 0.8503% | 0.4634% | 0.3568% |
| 2022-01-20 | 0.0000% | 0.1221% | 0.1687% | 0.2831% | 80.3988% | 12.5592% | 1.8927% | 1.4921% | 1.0036% | 0.4499% | 0.8351% | 0.4446% | 0.3500% |
| 2022-01-21 | 0.0000% | 0.1234% | 0.1599% | 0.2858% | 81.4219% | 11.6477% | 1.9316% | 1.3819% | 0.9494% | 0.4453% | 0.8615% | 0.4436% | 0.3480% |
| 2022-01-22 | 0.0000% | 0.1797% | 0.2379% | 0.3808% | 82.0847% | 9.9598% | 2.6312% | 1.2211% | 0.9332% | 0.4429% | 1.1404% | 0.4392% | 0.3493% |
| 2022-01-23 | 0.0000% | 0.1942% | 0.2317% | 0.3695% | 82.6698% | 9.5777% | 2.5169% | 1.1724% | 0.9056% | 0.4432% | 1.1244% | 0.4327% | 0.3617% |
| 2022-01-24 | 0.0000% | 0.1529% | 0.1677% | 0.2628% | 83.1674% | 10.2728% | 1.8032% | 1.2686% | 0.8822% | 0.4320% | 0.8178% | 0.4349% | 0.3377% |
| 2022-01-25 | 0.0000% | 0.1588% | 0.1748% | 0.2607% | 83.9039% | 9.7041% | 1.7497% | 1.2257% | 0.8594% | 0.4230% | 0.7947% | 0.4221% | 0.3230% |
| 2022-01-26 | 0.0000% | 0.1649% | 0.1919% | 0.2684% | 84.5595% | 9.1948% | 1.7411% | 1.1326% | 0.8188% | 0.4088% | 0.7871% | 0.4108% | 0.3213% |
| 2022-01-27 | 0.0000% | 0.1706% | 0.1723% | 0.2653% | 85.0102% | 8.7534% | 1.7195% | 1.1492% | 0.8218% | 0.4177% | 0.7826% | 0.4201% | 0.3175% |
| 2022-01-28 | 0.0000% | 0.1863% | 0.1721% | 0.2998% | 85.4656% | 8.3345% | 1.7354% | 1.1011% | 0.7879% | 0.4023% | 0.7755% | 0.4212% | 0.3184% |
| 2022-01-29 | 0.0000% | 0.2432% | 0.2524% | 0.4486% | 85.0456% | 7.6439% | 2.4780% | 0.9756% | 0.7196% | 0.4008% | 1.0169% | 0.4348% | 0.3406% |
| 2022-01-30 | 0.0000% | 0.2498% | 0.2378% | 0.4736% | 85.6022% | 7.4084% | 2.3117% | 0.9470% | 0.6814% | 0.3705% | 0.9848% | 0.4109% | 0.3219% |
| 2022-01-31 | 0.0000% | 0.1921% | 0.1645% | 0.3336% | 86.8529% | 7.5929% | 1.4485% | 0.9938% | 0.7046% | 0.3647% | 0.6753% | 0.4006% | 0.2765% |
| 2022-02-01 | 0.0000% | 0.1961% | 0.1595% | 0.4035% | 87.0774% | 7.3390% | 1.4790% | 0.9652% | 0.6843% | 0.3597% | 0.6694% | 0.3948% | 0.2720% |
| 2022-02-02 | 0.0000% | 0.1956% | 0.1629% | 4.0875% | 83.8040% | 7.0391% | 1.4431% | 0.9144% | 0.6703% | 0.3552% | 0.6702% | 0.3885% | 0.2692% |
| 2022-02-03 | 0.0000% | 0.1961% | 0.1534% | 10.7877% | 77.4577% | 6.7343% | 1.4876% | 0.8727% | 0.6411% | 0.3440% | 0.6779% | 0.3804% | 0.2672% |
| 2022-02-04 | 0.0000% | 0.2091% | 0.2088% | 19.5037% | 68.9628% | 6.4236% | 1.5359% | 0.8393% | 0.6403% | 0.3368% | 0.6862% | 0.3818% | 0.2718% |
| 2022-02-05 | 0.0000% | 0.3378% | 0.2795% | 27.7997% | 59.7330% | 6.1880% | 2.2839% | 0.7829% | 0.5944% | 0.3307% | 0.9933% | 0.3800% | 0.2968% |
| 2022-02-06 | 0.0000% | 0.3490% | 0.2758% | 30.7760% | 56.9533% | 6.0346% | 2.2841% | 0.7652% | 0.5892% | 0.3248% | 0.9688% | 0.3856% | 0.2937% |
| 2022-02-07 | 0.0000% | 0.2698% | 0.2073% | 31.2145% | 57.4092% | 6.0665% | 1.6698% | 0.8326% | 0.6459% | 0.3355% | 0.6748% | 0.3836% | 0.2905% |
| 2022-02-08 | 0.0000% | 0.2835% | 0.2034% | 39.6256% | 49.2262% | 5.8524% | 1.7011% | 0.8005% | 0.6267% | 0.3329% | 0.6700% | 0.3867% | 0.2913% |
| 2022-02-09 | 0.0000% | 0.2854% | 0.2040% | 51.7434% | 37.4438% | 5.5967% | 1.6149% | 0.7902% | 0.6179% | 0.3346% | 0.6811% | 0.3886% | 0.2994% |
| 2022-02-10 | 0.0000% | 0.3035% | 0.2056% | 64.1751% | 25.4399% | 5.1914% | 1.6026% | 0.7773% | 0.6148% | 0.3323% | 0.6678% | 0.3856% | 0.3042% |
| 2022-02-11 | 0.0000% | 0.3200% | 0.2123% | 70.9156% | 18.9909% | 4.9838% | 1.4181% | 0.7774% | 0.6214% | 0.3416% | 0.7113% | 0.3908% | 0.3168% |
| 2022-02-12 | 0.0001% | 0.4216% | 0.2739% | 75.8758% | 12.7559% | 4.8394% | 2.5110% | 0.7159% | 0.6017% | 0.3329% | 0.9718% | 0.3929% | 0.3072% |
| 2022-02-13 | 0.0000% | 0.4237% | 0.2763% | 77.6752% | 11.3726% | 4.6607% | 2.3649% | 0.6861% | 0.5655% | 0.3140% | 0.9684% | 0.3837% | 0.3091% |
| 2022-02-14 | 0.0000% | 0.3152% | 0.2083% | 76.9611% | 13.1654% | 4.6464% | 1.7167% | 0.7342% | 0.5899% | 0.3201% | 0.6560% | 0.3933% | 0.2934% |
| 2022-02-15 | 0.0000% | 0.3124% | 0.2021% | 79.1282% | 11.3529% | 4.4636% | 1.6466% | 0.7071% | 0.5653% | 0.3201% | 0.6274% | 0.3832% | 0.2912% |
| 2022-02-16 | 0.0000% | 0.3243% | 0.2038% | 80.6639% | 9.9946% | 4.2701% | 1.6595% | 0.7158% | 0.5658% | 0.3122% | 0.6302% | 0.3760% | 0.2838% |
| 2022-02-17 | 0.0000% | 0.3285% | 0.2009% | 81.8338% | 8.9708% | 4.1527% | 1.6762% | 0.6951% | 0.5514% | 0.3076% | 0.6269% | 0.3747% | 0.2814% |
| 2022-02-18 | 0.0008% | 0.3497% | 0.2078% | 82.6826% | 8.0582% | 4.0522% | 1.7689% | 0.6878% | 0.5474% | 0.3209% | 0.6655% | 0.3684% | 0.2897% |
| 2022-02-19 | 0.0334% | 0.3962% | 0.3184% | 83.4303% | 6.2674% | 4.0039% | 2.4328% | 0.6835% | 0.5080% | 0.3128% | 0.9336% | 0.3811% | 0.2987% |
| 2022-02-20 | 0.0797% | 0.3311% | 0.3194% | 84.0234% | 5.9904% | 3.8715% | 2.3334% | 0.6594% | 0.5073% | 0.3056% | 0.9356% | 0.3620% | 0.2810% |
| 2022-02-21 | 0.0587% | 0.2598% | 0.2468% | 84.1764% | 6.8024% | 3.8159% | 1.8127% | 0.6649% | 0.5265% | 0.3067% | 0.6597% | 0.3832% | 0.2862% |
| 2022-02-22 | 0.0632% | 0.2399% | 0.2450% | 84.9382% | 6.4595% | 3.6142% | 1.7137% | 0.6378% | 0.5159% | 0.3049% | 0.6299% | 0.3638% | 0.2741% |
| 2022-02-23 | 0.0752% | 0.2359% | 0.2761% | 85.3787% | 6.0287% | 3.5009% | 1.7839% | 0.6317% | 0.5087% | 0.3049% | 0.6374% | 0.3672% | 0.2707% |
| 2022-02-24 | 0.0705% | 0.2362% | 0.2634% | 85.9954% | 5.6871% | 3.4246% | 1.7009% | 0.5988% | 0.4996% | 0.2919% | 0.6033% | 0.3600% | 0.2683% |
| 2022-02-25 | 0.0768% | 0.2443% | 0.2955% | 86.3641% | 5.2829% | 3.3680% | 1.7568% | 0.5657% | 0.4905% | 0.2913% | 0.6322% | 0.3625% | 0.2695% |
| 2022-02-26 | 0.0986% | 0.3235% | 0.4231% | 85.9440% | 4.4333% | 3.3909% | 2.5171% | 0.5412% | 0.4798% | 0.2909% | 0.9168% | 0.3703% | 0.2705% |
| 2022-02-27 | 0.1076% | 0.2852% | 0.4442% | 86.3178% | 4.2554% | 3.3355% | 2.4455% | 0.5217% | 0.4657% | 0.2732% | 0.8975% | 0.3688% | 0.2820% |
| 2022-02-28 | 0.0805% | 0.2264% | 0.3290% | 87.0944% | 4.7665% | 3.2002% | 1.7667% | 0.5552% | 0.4824% | 0.2741% | 0.6065% | 0.3504% | 0.2676% |
| 2022-03-01 | 0.0823% | 0.2243% | 0.4175% | 87.4211% | 4.5314% | 3.0594% | 1.7720% | 0.5578% | 0.4607% | 0.2697% | 0.5930% | 0.3512% | 0.2596% |
| 2022-03-02 | 0.0813% | 0.2251% | 3.9680% | 84.2254% | 4.3094% | 3.0111% | 1.6974% | 0.5485% | 0.4639% | 0.2678% | 0.6025% | 0.3420% | 0.2575% |
| 2022-03-03 | 0.0860% | 0.2245% | 11.9552% | 76.5380% | 4.1113% | 2.9298% | 1.6869% | 0.5471% | 0.4651% | 0.2670% | 0.5852% | 0.3437% | 0.2603% |
| 2022-03-04 | 0.1481% | 0.2362% | 22.5161% | 66.1485% | 3.8667% | 2.8832% | 1.7433% | 0.5229% | 0.4527% | 0.2609% | 0.6226% | 0.3430% | 0.2558% |
| 2022-03-05 | 0.2483% | 0.3164% | 33.6288% | 54.2056% | 3.4509% | 3.0747% | 2.3631% | 0.4963% | 0.4430% | 0.2635% | 0.8942% | 0.3452% | 0.2699% |
| 2022-03-06 | 0.2651% | 0.3227% | 37.2905% | 50.9078% | 3.3400% | 2.9203% | 2.2912% | 0.4958% | 0.4426% | 0.2506% | 0.8726% | 0.3363% | 0.2644% |
| 2022-03-07 | 0.1837% | 0.2660% | 36.9753% | 52.3521% | 3.5951% | 2.6073% | 1.6510% | 0.4961% | 0.4436% | 0.2591% | 0.5845% | 0.3299% | 0.2562% |
| 2022-03-08 | 0.1921% | 0.2728% | 46.1578% | 43.5044% | 3.4375% | 2.5065% | 1.5931% | 0.4913% | 0.4273% | 0.2568% | 0.5841% | 0.3277% | 0.2486% |
| 2022-03-09 | 0.1910% | 0.2750% | 58.6384% | 31.1182% | 3.3291% | 2.5030% | 1.5923% | 0.4941% | 0.4443% | 0.2631% | 0.5759% | 0.3217% | 0.2541% |
| 2022-03-10 | 0.1983% | 0.2759% | 66.6023% | 23.3853% | 3.1888% | 2.4334% | 1.6060% | 0.4924% | 0.4216% | 0.2532% | 0.5752% | 0.3215% | 0.2462% |
| 2022-03-11 | 0.2169% | 0.2953% | 71.2820% | 18.7575% | 3.0712% | 2.4137% | 1.6315% | 0.4822% | 0.4248% | 0.2533% | 0.6013% | 0.3233% | 0.2471% |
| 2022-03-12 | 0.3178% | 0.3579% | 75.0959% | 13.7713% | 2.8331% | 2.6181% | 2.3502% | 0.5067% | 0.4230% | 0.2547% | 0.8853% | 0.3329% | 0.2531% |
| 2022-03-13 | 0.2925% | 0.3544% | 76.5015% | 12.4441% | 2.7972% | 2.6467% | 2.3365% | 0.5097% | 0.4227% | 0.2400% | 0.8676% | 0.3224% | 0.2645% |
| 2022-03-14 | 0.2183% | 0.2980% | 76.5209% | 13.9213% | 2.8796% | 2.3086% | 1.5790% | 0.4721% | 0.4184% | 0.2446% | 0.5742% | 0.3196% | 0.2454% |
| 2022-03-15 | 0.2178% | 0.2821% | 78.3268% | 12.3836% | 2.7799% | 2.2183% | 1.5574% | 0.4742% | 0.4004% | 0.2423% | 0.5740% | 0.3035% | 0.2396% |
| 2022-03-16 | 0.2279% | 0.2746% | 79.9200% | 11.0179% | 2.6655% | 2.1855% | 1.5131% | 0.4623% | 0.3887% | 0.2386% | 0.5568% | 0.3099% | 0.2394% |
| 2022-03-17 | 0.2330% | 0.2813% | 81.1027% | 9.9678% | 2.5655% | 2.1601% | 1.5065% | 0.4504% | 0.3991% | 0.2343% | 0.5593% | 0.3033% | 0.2366% |
| 2022-03-18 | 0.2561% | 0.2912% | 82.1716% | 9.0172% | 2.4236% | 2.0762% | 1.5907% | 0.4408% | 0.3820% | 0.2322% | 0.5850% | 0.3003% | 0.2331% |
| 2022-03-19 | 0.3151% | 0.3508% | 82.1984% | 7.4544% | 2.3516% | 2.4225% | 2.3421% | 0.4546% | 0.4032% | 0.2363% | 0.8967% | 0.3170% | 0.2574% |
| 2022-03-20 | 0.2713% | 0.3462% | 82.7299% | 7.2246% | 2.2897% | 2.3687% | 2.3127% | 0.4359% | 0.4056% | 0.2296% | 0.8447% | 0.2944% | 0.2466% |
| 2022-03-21 | 0.1971% | 0.2725% | 83.3152% | 8.0553% | 2.3554% | 2.0378% | 1.6154% | 0.4333% | 0.3793% | 0.2315% | 0.5662% | 0.3034% | 0.2376% |
| 2022-03-22 | 0.1822% | 0.2902% | 84.1726% | 7.4951% | 2.2640% | 1.9560% | 1.5519% | 0.4160% | 0.3707% | 0.2215% | 0.5526% | 0.3038% | 0.2235% |
| 2022-03-23 | 0.1787% | 0.2905% | 84.8110% | 7.0357% | 2.1387% | 1.9110% | 1.5677% | 0.3992% | 0.3727% | 0.2213% | 0.5465% | 0.2992% | 0.2279% |
| 2022-03-24 | 0.1816% | 0.2881% | 85.3078% | 6.6819% | 2.0346% | 1.8871% | 1.5665% | 0.4017% | 0.3653% | 0.2162% | 0.5431% | 0.2961% | 0.2300% |
| 2022-03-25 | 0.1850% | 0.3259% | 85.5512% | 6.3257% | 1.9862% | 1.8161% | 1.6912% | 0.3979% | 0.3712% | 0.2314% | 0.5782% | 0.3023% | 0.2376% |
| 2022-03-26 | 0.2513% | 0.4347% | 84.9980% | 5.7174% | 1.8887% | 1.8396% | 2.4636% | 0.3976% | 0.3775% | 0.2233% | 0.8562% | 0.3074% | 0.2447% |
| 2022-03-27 | 0.2380% | 0.4364% | 85.5432% | 5.6370% | 1.7971% | 1.7317% | 2.3124% | 0.3832% | 0.3692% | 0.2104% | 0.8099% | 0.2877% | 0.2441% |
| 2022-03-28 | 0.1666% | 0.3208% | 86.8461% | 5.7222% | 1.8063% | 1.5579% | 1.5932% | 0.3879% | 0.3505% | 0.2161% | 0.5225% | 0.2842% | 0.2257% |
| 2022-03-29 | 0.1513% | 0.5652% | 87.1876% | 5.3979% | 1.7323% | 1.4451% | 1.5669% | 0.3681% | 0.3506% | 0.2009% | 0.5336% | 0.2811% | 0.2194% |
| 2022-03-30 | 0.1576% | 5.5490% | 82.6303% | 5.1355% | 1.6597% | 1.3612% | 1.5718% | 0.3627% | 0.3415% | 0.2026% | 0.5277% | 0.2815% | 0.2187% |
| 2022-03-31 | 0.1559% | 14.2487% | 74.3161% | 4.9095% | 1.5865% | 1.3213% | 1.5609% | 0.3582% | 0.3308% | 0.1997% | 0.5151% | 0.2800% | 0.2173% |
| 2022-04-01 | 0.1813% | 25.5917% | 63.0197% | 4.6924% | 1.5348% | 1.3091% | 1.7270% | 0.3518% | 0.3366% | 0.2027% | 0.5498% | 0.2824% | 0.2208% |
| 2022-04-02 | 0.2617% | 36.0589% | 50.8073% | 4.7315% | 1.5903% | 1.4032% | 2.7742% | 0.3796% | 0.3699% | 0.2150% | 0.8255% | 0.3100% | 0.2731% |
| 2022-04-03 | 0.2696% | 40.1393% | 47.6733% | 4.5903% | 1.4216% | 1.2821% | 2.3981% | 0.3682% | 0.3410% | 0.1911% | 0.8276% | 0.2667% | 0.2313% |
| 2022-04-04 | 0.2050% | 40.4830% | 49.2044% | 4.2831% | 1.3593% | 1.1840% | 1.5060% | 0.3320% | 0.3082% | 0.1899% | 0.5062% | 0.2527% | 0.1862% |
| 2022-04-05 | 0.2067% | 43.9099% | 46.1357% | 4.0916% | 1.3287% | 1.1513% | 1.4396% | 0.3215% | 0.3041% | 0.1849% | 0.4934% | 0.2481% | 0.1847% |
| 2022-04-06 | 0.2187% | 45.9304% | 43.8938% | 3.9022% | 1.3749% | 1.1920% | 1.6659% | 0.3339% | 0.3118% | 0.1924% | 0.5080% | 0.2672% | 0.2089% |
| 2022-04-07 | 0.2248% | 55.3760% | 34.7892% | 3.6035% | 1.3432% | 1.1667% | 1.6971% | 0.3292% | 0.3116% | 0.1860% | 0.5093% | 0.2567% | 0.2067% |
| 2022-04-08 | 0.2437% | 65.3241% | 24.9055% | 3.4441% | 1.3174% | 1.1591% | 1.7565% | 0.3383% | 0.3080% | 0.1865% | 0.5392% | 0.2649% | 0.2129% |
| 2022-04-09 | 0.3552% | 72.6629% | 16.1023% | 3.4380% | 1.3360% | 1.2065% | 2.6180% | 0.3881% | 0.3343% | 0.2036% | 0.8520% | 0.2712% | 0.2320% |
| 2022-04-10 | 0.3588% | 75.0152% | 14.1712% | 3.3374% | 1.2959% | 1.1573% | 2.4802% | 0.3769% | 0.3273% | 0.1896% | 0.8174% | 0.2547% | 0.2182% |
| 2022-04-11 | 0.2514% | 75.1833% | 15.7071% | 3.0419% | 1.2542% | 1.1076% | 1.6913% | 0.3187% | 0.3001% | 0.1846% | 0.5052% | 0.2561% | 0.1983% |
| 2022-04-12 | 0.2525% | 77.6105% | 13.5018% | 2.8775% | 1.2313% | 1.0921% | 1.6838% | 0.3182% | 0.2940% | 0.1846% | 0.4997% | 0.2535% | 0.2004% |
| 2022-04-13 | 0.2515% | 79.3135% | 11.8381% | 2.7657% | 1.1999% | 1.1073% | 1.7596% | 0.3188% | 0.2942% | 0.1894% | 0.4959% | 0.2597% | 0.2064% |
| 2022-04-14 | 0.2638% | 81.6428% | 10.2230% | 2.6689% | 1.0457% | 1.0041% | 1.5028% | 0.2964% | 0.2720% | 0.1751% | 0.4884% | 0.2337% | 0.1832% |
| 2022-04-15 | 0.3107% | 82.1871% | 8.7132% | 2.6720% | 1.0914% | 1.0746% | 2.0693% | 0.3225% | 0.2960% | 0.1897% | 0.6075% | 0.2495% | 0.2165% |
| 2022-04-16 | 0.4049% | 82.9440% | 6.8725% | 2.7691% | 1.0718% | 1.0948% | 2.6616% | 0.3438% | 0.3227% | 0.1963% | 0.8405% | 0.2559% | 0.2221% |
| 2022-04-17 | 0.4047% | 83.4272% | 6.5785% | 2.7740% | 1.0408% | 1.0796% | 2.5529% | 0.3526% | 0.3187% | 0.1759% | 0.8376% | 0.2427% | 0.2149% |
| 2022-04-18 | 0.2857% | 83.8299% | 7.5944% | 2.5342% | 1.0325% | 1.0743% | 1.8479% | 0.3261% | 0.2894% | 0.1820% | 0.5436% | 0.2572% | 0.2028% |
| 2022-04-19 | 0.2766% | 84.8091% | 7.2881% | 2.3503% | 0.9702% | 0.9922% | 1.6394% | 0.3148% | 0.2756% | 0.1719% | 0.4804% | 0.2454% | 0.1860% |
| 2022-04-20 | 0.2799% | 85.4701% | 6.7614% | 2.2479% | 0.9362% | 0.9852% | 1.6643% | 0.3012% | 0.2773% | 0.1684% | 0.4834% | 0.2422% | 0.1825% |
| 2022-04-21 | 0.2973% | 86.0018% | 6.2328% | 2.2261% | 0.9132% | 0.9700% | 1.7047% | 0.2971% | 0.2696% | 0.1666% | 0.4986% | 0.2399% | 0.1823% |
| 2022-04-22 | 0.3213% | 86.3868% | 5.7889% | 2.1593% | 0.9105% | 0.9627% | 1.7757% | 0.2977% | 0.2819% | 0.1722% | 0.5237% | 0.2371% | 0.1822% |
| 2022-04-23 | 0.4968% | 85.8966% | 4.7296% | 2.4019% | 0.8974% | 0.9904% | 2.5055% | 0.3403% | 0.3033% | 0.1721% | 0.8126% | 0.2451% | 0.2084% |
| 2022-04-24 | 0.4777% | 85.4802% | 4.7939% | 2.3608% | 0.9737% | 1.0529% | 2.7088% | 0.3398% | 0.3156% | 0.1795% | 0.7897% | 0.2788% | 0.2486% |
| 2022-04-25 | 0.3257% | 87.3284% | 5.1208% | 2.0780% | 0.8546% | 0.9471% | 1.6892% | 0.2974% | 0.2703% | 0.1654% | 0.5006% | 0.2404% | 0.1822% |
| 2022-04-26 | 0.4103% | 87.7223% | 4.8262% | 2.0045% | 0.8395% | 0.9266% | 1.6524% | 0.2915% | 0.2682% | 0.1640% | 0.4741% | 0.2361% | 0.1842% |
| 2022-04-27 | 4.8221% | 83.6717% | 4.5406% | 1.9638% | 0.8197% | 0.9201% | 1.6594% | 0.2805% | 0.2673% | 0.1625% | 0.4782% | 0.2347% | 0.1792% |
| 2022-04-28 | 10.2662% | 78.5895% | 4.2556% | 1.9180% | 0.8044% | 0.9025% | 1.6505% | 0.2883% | 0.2675% | 0.1639% | 0.4822% | 0.2347% | 0.1769% |
| 2022-04-29 | 14.2843% | 74.6277% | 3.9706% | 1.9208% | 0.8075% | 0.9010% | 1.8151% | 0.2902% | 0.2755% | 0.1664% | 0.5181% | 0.2346% | 0.1882% |
| 2022-04-30 | 18.8788% | 69.1757% | 3.2994% | 2.1357% | 0.8096% | 0.9441% | 2.6950% | 0.3253% | 0.2932% | 0.1724% | 0.8318% | 0.2364% | 0.2026% |
Chrome, Edge, and Firefox all have similar release cycles with releases every four weeks. Graphing Chrome traffic by version from January through April shows us how quickly older versions of these evergreen browsers fall off. We see peak-to-peak traffic around every four weeks, with a two week period where a single version represents more than 80% of all traffic for that browser.
This shows us that the promise of evergreen browsers is here today. The days of targeting one specific version of one browser are long gone. In fact, trying to do so today would be untenable. The Web Systems Team at GitHub removed the last traces of conditionals based on the user agent header in January 2020, and recorded an internal ADR explicitly disallowing this pattern due to how hard it is to maintain code that relies on user agent header parsing.
With that said, we still need to ensure some compatibility for user agents, which do not fall into the neat box of evergreen browsers. Universal access is important, and 1% of 73 million users is still 730,000 users.
Older browsers
When looking at the remaining 4% of browser traffic, we not only see very old versions of the most popular browsers, but also a diverse array of other branded user agents. Alongside older versions of Chrome (80-89 make up 1%, and 70-79 make up 0.2%), there are also Chromium forks, like QQ Browser (0.085%), Naver Whale (0.065%), and Silk (0.003%). Alongside older versions of Firefox (80-89 make up 0.12%, and 70-79 at 0.09%) there are Firefox forks, like IceWeasel (0.0002%) and SeaMonkey (0.0004%). The data also contains lots of esoteric user agents too, such as those from TVs, e-readers, and even refrigerators. In total, we’ve seen close to 20 million unique user agent strings visiting GitHub in 2022 alone.
Another vector we look at is logged-in vs. logged-out usage. As a whole, around 20% of the visits to GitHub come from browsers with logged-out sessions, but when looking at older browsers, the proportion of logged-out visits is much higher. For example, requests coming from Amazon Silk make up around 0.003% of all visits, but 80% of those visits are with logged-out sessions. Meaning, the number of logged-in visits on Silk is closer to 0.0006%. Users making requests with forked browsers also tend to make requests from evergreen browsers. For example, users making requests with SeaMonkey do so for 37% of their usage, while the other 63% come from Chrome or Firefox user agents.
We consider logged-in vs. logged-out, and main vs. a secondary browser to be important distinctions, because the usage patterns are quite different. Actions that a logged-out user takes (reading issues and pull requests, cloning repositories, and browsing files) are quite different to the actions a logged-in user takes (replying to issues and reviewing pull requests, starring repositories, editing files, and looking at their dashboard). Logged-out activities tend to be more “read only” actions, which means they hit very few paths that require JavaScript to run. Whereas logged-in users tend to perform the kind of rich interactions that require JavaScript.
With JavaScript disabled, you’re still able to log in, comment on issues and pull requests (although our rich markdown toolbar won’t work), browse source code (with syntax highlighting), search for repositories, and even star, watch, or fork them. Popover menus even work, thanks to the clever use of the HTML <details> element.

How we engineer for older browsers
With such a multitude of browsers, with various levels of standards compliance, we cannot expect our engineers to know the intricacies of each. We also don’t have the resources to test on the hundreds of browsers across thousands of operating system and version combinations we see, while 0.0002% of you are using your Tesla to merge pull requests, a Model 3 won’t fit into our testing budget! ![]()
Instead, we use a few industry standard practices, like linting and polyfills, to make sure we’re delivering a good baseline experience:
Static code analysis (linting) to catch browser compatibility issues:
We love ESLint. It’s great at catching classes of bugs, as well as enforcing style, for which we have extensive configurations, but it can also be useful for catching cross-browser bugs. We use amilajack/eslint-plugin-compat for guarding against use of features that aren’t well supported, and we’re not prepared to polyfill (for example, ResizeObserver). We also use keithamus/eslint-plugin-escompat for catching use of syntax that browsers do not support, and we don’t polyfill or transpile. These plugins are incredibly useful for catching quirks, for example, older versions of Edge supported destructuring, but in some instances these caused a SyntaxError. By linting for this corner case, we were able to ship native destructuring syntax to all browsers with a lint check to prevent engineers from hitting SyntaxErrors. Shipping native destructuring syntax allowed us to remove multiple kilobytes of transpiled code and helper functions, while linting kept code stable for older versions of Edge.
Polyfills to patch browsers with modern features
Past iterations of our codebase made liberal use of polyfills, such as mdn-polyfills, es6-promise, template-polyfill, and custom-event-polyfill, to name a few. Managing polyfills was burdensome and in some cases hurt performance. We were restricted in certain ways. For example, we postponed adoption of ShadowDOM due to the poor performance of polyfills available at the time.
More recently, our strategy has been to maintain a small list of polyfills for code features that are easy enough to polyfill with low impact. These polyfills are open sourced in our browser-support repository. In this repository, we also maintain a function that checks if a browser has a base set of functionality necessary to run GitHub’s JavaScript. This check expects variables, like Blob, globalThis, and MutationObserver to exist. If a browser doesn’t pass this check, JavaScript still executes, but any uncaught exceptions will not be reported to our error reporting library that we call failbot. By preventing browsers that don’t meet our minimum requirements, we reduce the amount of noise in our error reporting systems, which increases the value of error reporting software dramatically. Here’s some relevant code from failbot.ts:
import {isSupported} from '@github/browser-support'

const extensions = /(chrome|moz|safari)-extension:\/\//
// Does this stack trace contain frames from browser extensions?
function isExtensionError(stack: PlatformStackframe[]): boolean {
  return stack.some(frame => extensions.test(frame.filename) || extensions.test(frame.function))
}

let errorsReported = 0
function reportable() {
  return errorsReported < 10 && isSupported()
}

export async function report(context: PlatformReportBrowserErrorInput) {
  if (!reportable()) return
  if (isExtensionError()) return
  errorsReported++
  // ...
}
In order to help us quickly determine which browsers meet our minimum requirements, and which browsers require which polyfills, our browser-support repository even has its own publicly-visible compatibility table!

Shipping changes and validating data
When it comes to making a change, like shipping native optional chaining syntax, one tool we reach for is an internal CLI that lets us quickly generate Markdown tables that can be added to pull requests introducing new native syntax or features that require polyfilling. This internal CLI tool uses mdn/browser-compat-data and combines it with the data we have to generate a Can I Use-style feature table, but tailored to our usage data and the requested feature. For example:
browser-support-cli $ ./browsers.js optional chaining

#### [javascript operators optional_chaining](https://developer.mozilla.org/docs/Web/JavaScript/Reference/Operators/Optional_chaining)
| Browser                 | Supported Since | Latest Version | % Supported | % Unsupported |
| :---------------------- | --------------: | -------------: | ----------: | ------------: |
| chrome                  |              80 |            101 |      73.482 |         0.090 |
| edge                    |              80 |            100 |       6.691 |         0.001 |
| firefox                 |              74 |            100 |      12.655 |         0.014 |
| firefox_android         |              79 |            100 |       0.127 |         0.001 |
| ie                      |   Not Supported |             11 |       0.000 |         0.078 |
| opera                   |              67 |             86 |       1.267 |         0.000 |
| safari                  |            13.1 |           15.4 |       4.630 |         0.013 |
| safari_ios              |            13.4 |           15.4 |       0.505 |         0.006 |
| samsunginternet_android |            13.0 |           16.0 |       0.020 |         0.000 |
| webview_android         |              80 |            101 |       0.001 |         0.008 |
| **Total:**              |                 |                |  **99.378** |     **0.211** |
We can then take this table and paste it into a pull request description to help provide data at the fingertips of whoever is reviewing the pull request, to ensure that we’re making decisions that are inline with our principles.
This CLI tool has a few more features. It actually generated all the tables in this post, which we could then easily generate graphs with. For quick glances at feature tables, it also allows for exporting of our analytics table into a JSON format that we can import into Can I Use.
browser-support-cli $ ./browsers.js
    Usage:
      node browsers.js <query>
    Examples:
      node browsers.js --stats [--csv]    # Show usage stats by browser+version
      node browsers.js --last-ten [--csv] # Show usage stats of the last 10 major versions, by vendor
      node browsers.js --cadence [--csv]  # Show release cadence stats
      node browsers.js --caniuse          # Output a `simple.json` for import into caniuse.com
      node browsers.js --html <query>     # Output html for github.github.io/browser-support
Wrap-up
This is how GitHub thinks about our users and the browsers they use. We back up our principles with tooling and data to make sure we’re delivering a fast and reliable service to as many users as possible.
Concepts like progressive enhancement allow us to deliver the best experience possible to the majority of customers, while delivering a useful experience to those using older browsers.
The post How we think about browsers appeared first on The GitHub Blog.
]]>