ABSTRACT
Stellar rotation periods (Prot) measured in open clusters have proved to be extremely useful for studying stars' angular momentum content and rotationally driven magnetic activity, which are both age- and mass-dependent processes. While Prot measurements have been obtained for hundreds of solar-mass members of the Pleiades, measurements exist for only a few low-mass (<0.5 M⊙) members of this key laboratory for stellar evolution theory. To fill this gap, we report Prot for 132 low-mass Pleiades members (including nearly 100 with M ≤ 0.45 M⊙), measured from photometric monitoring of the cluster conducted by the Palomar Transient Factory in late 2011 and early 2012. These periods extend the portrait of stellar rotation at 125 Myr to the lowest-mass stars and re-establish the Pleiades as a key benchmark for models of the transport and evolution of stellar angular momentum. Combining our new Prot with precise BVIJHK photometry reported by Stauffer et al. and Kamai et al., we investigate known anomalies in the photometric properties of K and M Pleiades members. We confirm the correlation detected by Kamai et al. between a star's Prot and position relative to the main sequence in the cluster's color–magnitude diagram. We find that rapid rotators have redder (V − K) colors than slower rotators at the same V, indicating that rapid and slow rotators have different binary frequencies and/or photospheric properties. We find no difference in the photometric amplitudes of rapid and slow rotators, indicating that asymmetries in the longitudinal distribution of starspots do not scale grossly with rotation rate.
Export citation and abstract BibTeX RIS
1. INTRODUCTION
Studies of stellar rotation in the Pleiades go back decades; indeed, Pleiads are included in the seminal analysis by Skumanich (1972) of the evolution of rotation and activity in Sun-like stars. Spectroscopic vrot sin i measurements were quickly obtained for large numbers of cluster members (e.g., Stauffer & Hartmann 1987), but inclination-independent measurements of rotation periods (Prot) took longer to accumulate, reflecting the observationally intensive nature required of monitoring programs conducted with photometers or small field-of-view imagers (e.g., van Leeuwen et al. 1987; Prosser et al. 1993). This changed dramatically with the HATNet exoplanet-search program, which monitored ≈100 square degrees including much of the cluster and produced periods for 368 Pleiads (Hartman et al. 2010). However, while these authors achieved a 93% period-detection efficiency for 0.7–1.0 M⊙ members, this efficiency dropped sharply with mass, and the number of M-dwarf Pleiads with measured Prot remains very small (e.g., the few studied by Terndrup et al. 1999; Scholz & Eislöffel 2004).
Measurements of Prot for single-age open-cluster members spanning a range of masses are a valuable way to test models of stellar angular-momentum evolution. These models strive to reproduce the dependence of Prot on mass within a cluster and the evolution of Prot for stars in a narrow mass range (e.g., the age–rotation relation for 0.8–1.1 M⊙ stars). The recent review by Bouvier et al. (2014) provides a fuller overview of the increasingly sophisticated theoretical descriptions of processes responsible for angular-momentum loss and/or transfer. Broadly speaking, the components of such models are: (a) the initial distribution of angular-momentum states (e.g., Joos et al. 2012); (b) the mechanism and efficiency of angular-momentum loss during the protostellar/accretion phase (Matt & Pudritz 2005; Romanova et al. 2009); (c) the efficiency and timescale of angular-momentum transport in the stellar interior (e.g., Denissenkov et al. 2010); and (d) the efficiency of angular-momentum loss from the zero-age main sequence (ZAMS) onward (e.g., Gallet & Bouvier 2015; Matt et al. 2015).
The rotation rates of Pleiades members have often been particularly useful in this context, as these can be used to characterize the angular-momentum content of stars that have just arrived on the ZAMS (e.g., Bouvier et al. 1997; Sills et al. 2000). However, the lack of Prot measurements for the lowest-mass Pleiads has led authors seeking rotation periods for Pleiades-age stars to utilize a pseudo-Pleiades sample of Prot measured for high-mass members of M35 (Meibom et al. 2009) and periods measured for low-mass members of NGC 2516 (Irwin et al. 2007). While combining distinct populations is sufficient for first-order investigations of angular-momentum evolution, testing second-order effects due to metallicity, cluster environment, etc., requires that we obtain full mass sequences in many cluster environments, particularly one as well studied as the Pleiades.
The spot signatures from which Prot values are inferred also provide important clues as to the behavior of active photospheres and their influence on stellar properties. Early studies identified systematic differences between the photometric colors of members of the Pleiades and older open clusters such as the Hyades and Praesepe (Stauffer 1984), and between the colors of rapidly and slowly rotating Pleiads (e.g., Figure 5 in Stauffer et al. 1984). Subsequent studies have documented the anomalous morphology of the Pleiades cluster sequence (e.g., Bell et al. 2012) and provided further evidence of connection between this morphology and rotation rates (Stauffer et al. 2003; Kamai et al. 2014). Magnetically confined starspots provide a likely physical mechanism for linking a star's rotation rate and photospheric properties: rotationally driven magnetic dynamos produce large cool spots on the photospheres of rapidly rotating stars, which simple two-component spot models predict produce photometric anomalies similar to those which are observed (e.g., Stauffer et al. 1986; Jackson & Jeffries 2013).
Uncertainties in empirical estimates of stellar parameters derived from these anomalous photometric properties could produce systematic errors in the ages, masses, and radii of spotted stars, with important ramifications for the inferred age scale for young (1–200 Myr) stars and clusters. In addition to these observational effects, starspots can significantly affect the energy transport, temperature structure, and lithium-depletion efficiency in pre-main-sequence stellar interiors (e.g., Jackson & Jeffries 2014a, 2014b; Somers & Pinsonneault 2015a, 2015b), introducing additional systematic uncertainties into the parameters inferred by comparison to non-spotted stellar evolutionary models.
To improve empirical constraints on the rotational evolution and photospheric properties of low-mass stars, we carried out a sensitive, wide-field multi-epoch monitoring campaign targeting the lowest-mass members of the 125 Myr-old Pleiades cluster. We begin in Section 2 by using the literature to assemble a catalog of >2300 Pleiades members with reliable photometry spanning K = 5–19 mag. We then use the absolute K magnitudes of these stars to derive their masses, and identify candidate binaries in our sample based on their position in a V versus (V − K) color–magnitude diagram (CMD). In Section 3, we describe our Palomar Transient Factory (PTF; Law et al. 2009; Rau et al. 2009) observations of four fields in the Pleiades that provide PTF light curves for 809 candidate members of the cluster. We then present our period-finding pipeline, along with a number of tests we developed to establish the reliability of our 132 Prot measurements for Pleiads ranging from 0.18 to 0.65 M⊙. These measurements include the first Prot values reported for ≈100 low-mass (M ≤ 0.45 M⊙) cluster members. We discuss our results in Section 4 and conclude in Section 5. Finally, we include in the
2. CATALOG ASSEMBLY
2.1. Membership Catalog
We collate existing catalogs of confirmed and candidate Pleiads to characterize the subset for which PTF collected densely sampled light curves. As the basis of this catalog, we adopt the Stauffer et al. (2007) list of Pleiades members. This compilation includes 1416 candidate members identified by others over more than 80 years (e.g., by Trumpler 1921; Artyukhina 1969; van Leeuwen et al. 1986; Deacon & Hambly 2004).
To produce a uniform set of astrometric and photometric measurements for these stars, Stauffer et al. (2007) identified counterparts for brighter (J < 11 mag) objects in the 2MASS All-Sky Point Source Catalog (Cutri et al. 2003) and for fainter objects in the deeper "6x" catalog that 2MASS produced by observing a 3° × 2° field centered on the Pleiades with exposure times six times longer than those used in the primary survey.
We supplement the Stauffer et al. (2007) catalog with additional candidate Pleiades members identified and assembled by Lodieu et al. (2012), Bouy et al. (2015) and Hartman et al. (2010). Using photometry and astrometry from the UKIRT Infrared Deep Sky Survey (UKIDSS), Lodieu et al. (2012) identified 1076 stars within 5° of the Pleiades's center for which they calculate a membership probability (Pmem) > 50%. Using color, magnitude, and proper motion cuts, Lodieu et al. (2012) also selected an overlapping, but non-probabilistic set of 1147 candidate low-mass Pleiads. To test the fidelity and completeness of these UKIDSS-selected samples, Lodieu et al. (2012) compiled a list of candidate Pleiades members identified over the past two decades (e.g., by Hambly et al. 1993; Festin 1998; Pinfield et al. 2000; Moraux et al. 2003; Bihain et al. 2006).
Using a 3'' radius, we match these lists and identify 506 previously reported candidate Pleiades members that are not in the Stauffer et al. (2007) list, and 466 additional candidate members reported by Lodieu et al. (2012).9
We also incorporate candidate Pleiades members identified by Bouy et al. (2015) from their updated DANCe-Pleiades catalog, originally developed by Bouy et al. (2013) and Sarro et al. (2014). The DANCe-Pleiades catalog includes photometry from several wide-field optical and infrared surveys, as well as dedicated imaging programs carried out with imagers on telescopes in single-user mode. Combining these data along with new Y-band observations from the William Herschel Telescope, Bouy et al. (2015) produce two catalogs with calculated Pleiades membership probabilities, for sources with and without Tycho-2 photometry and astrometry. Tycho-2 sources are sufficiently bright that they saturate a standard PTF exposure, so we include only the 2010 candidates without Tycho-2 counterparts for which Bouy et al. (2015) calculate Pmem > 75%. Using a 3'' matching radius, we find 1606 DANCe-Pleiades candidates with counterparts in the merged Stauffer et al. (2007)/Lodieu et al. (2012) catalog, and incorporate the remaining 404 unmatched DANCe-Pleiades candidates into our catalog.
Finally, we include seven candidate Pleiads for which Hartman et al. (2010) measured Prot, but that lack counterparts within 3'' in our combined Stauffer et al. (2007)/Lodieu et al. (2012)/Bouy et al. (2015) catalog. The composition of this merged catalog of Pleiades members and candidates is summarized in Table 1. We have 2799 potential Pleiads ranging from K = 5–19 mag.
Table 1. Pleiades Members and Candidates
| Members or | Added | With | |||
|---|---|---|---|---|---|
| K | Candidates | Members or | With PTF | PTF | |
| Catalog | (mag) | Cataloged | Candidates | Light Curves | Prot |
| Stauffer et al. (2007) | 5–15 | 1416 | 1416 | 586 | 118 |
| Lodieu et al. (2012) | 11–19 | 2384 | 972 | 203 | 10 |
| Bouy et al. (2015) | 6.5–17.5 | 2010 | 404 | 29 | 4 |
| Hartman et al. (2010) | 9.5–12 | 383 | 7 | 0 | 0 |
| Control samplea | 7–15 | 2024 | ⋯ | 424 | 3 |
Note.
aSee description in Section 3.3.1.Download table as: ASCIITypeset image
2.2. Photometry
Inferring reliable, self-consistent parameters for Pleiades members over a broad range in color, and thus mass, requires a comprehensive and homogeneous catalog of optical and near-infrared (NIR) photometry. At optical wavelengths, RPTF magnitudes are available for lower-mass Pleiads, but not for the higher-mass stars with Prot reported by Hartman et al. (2010). Fortunately, the cluster's importance as a testbed for stellar evolution models has motivated the collection of BVRI photometry for many of its members.
We use the photometry compiled by Stauffer et al. (2007), supplemented with the deep BVI photometry of Kamai et al. (2014) for low-mass Pleiads. These two catalogs provide consistent V magnitudes for ≈80% (100/132) of the Pleiads for which we have Prot from PTF light curves, and ≈88% (436/496) of the full catalog of Pleiades members with measured Prot.
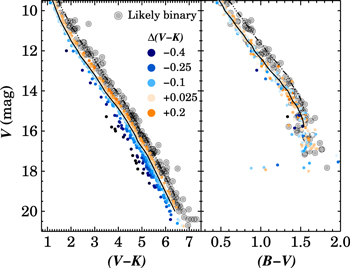
The resulting V versus (V − K) and V versus (B − V) CMDs for Pleiades members are shown in Figure 1. While the coverage of the full cluster population is not ideal, the larger photometric uncertainties in the transformed RPTF photometry would limit the analysis of color anomalies presented in Section 4.1 much more than the modest reduction in sample size that results from adopting the BVRI photometry.
Figure 1. V vs. (V − K) (left) and vs. (B − V) (right) CMDs for Pleiades members. Stars are color-coded according to their location relative to the semi-empirical V vs. (V − K) cluster sequence of Kamai et al. (2014), and which we extend to V = 20 and (V − K) = 6.4 (solid line in both panels). Dash-dotted lines show the same sequence offset brightward by 0.75 mag to indicate the expected position of equal-mass binary systems. Likely binaries, selected as members with V more than 0.375 mag brighter than the V vs. (V − K) sequence, are indicated with gray circles.
Download figure:
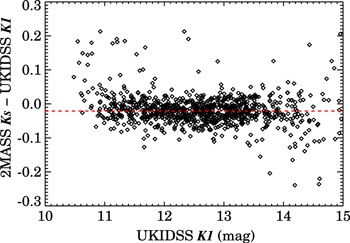
Standard image High-resolution imageAt NIR wavelengths, 2MASS and UKIDSS photometry are available for the full sample of Pleiades members. To remove potential systematic effects due to small differences between the photometric systems, we measured the offsets required to bring the UKIDSS JHK onto the 2MASS photometric system within the central 1.3–1.5 mag of the overlap range between the two surveys. Figure 2 shows the good agreement between the K magnitudes measured for Pleiades members by 2MASS and UKIDSS, where systematic offsets can only be seen for the very brightest and faintest sources detected by both surveys. We found median 2MASS–UKIDSS offsets of −0.05, 0.02, and −0.02 mag in the J, H, and K bands, respectively. These offsets are consistent with the modest color terms and zero-point offsets between the WFCAM and 2MASS systems measured by Hodgkin et al. (2009).
Figure 2. 2MASS Ks–UKIDSS K1 residuals for sources in both surveys. The median offset is 0.02 mag; Malmquist-like effects produce small systematic biases for the very brightest and faintest sources detected in both surveys, but no large-scale trends with source magnitude are visible over the majority of the magnitude range in common to the two surveys. Tests of the agreement between the 2MASS and UKIDSS J and H show similarly small offsets (0.05 and 0.02 mag in the mean, respectively) and no large-scale trends as a function of color or magnitude.
Download figure:
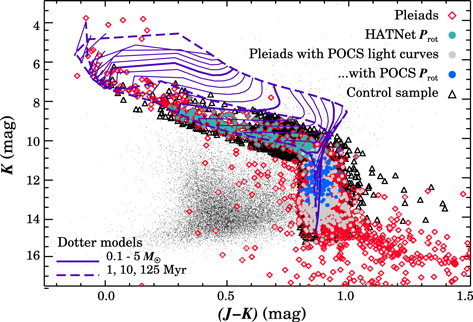
Standard image High-resolution imageWe adopt 2MASS magnitudes for all sources with Ks < 13 (≈1.3 mag brighter than the 2MASS faint limit) or lacking UKIDSS magnitudes. Only a few stars lacking 2MASS photometry are among our final sample of rotators (i.e., four of 132); for these sources, we adopt UKIDSS magnitudes after applying a simple zero-point correction to place them on the 2MASS system. The (J − K) versus K CMD resulting from this combined photometric catalog is shown in Figure 3, and traces out a well-defined cluster sequence over more than 10 mag in K.
Figure 3. (J − K) vs. K CMD for candidate Pleiades members and the control sample discussed in Section 3.3.1; also shown for context are other sources in the 2MASS photometric catalog (black points) and solar-metallicity isochrones (1, 10, and 125 Myr; dashed lines) and mass tracks (0.1–5 M⊙; solid lines) computed for the 2MASS filters by A. Dotter (2014, private communication). Despite combining photometry from the 2MASS and UKIDSS surveys, our catalog of candidate members produces a well-defined cluster sequence over more than 10 mag in K and a wide range of stellar masses (0.07 < M < 2.5 M⊙).
Download figure:
Standard image High-resolution image2.3. Stellar Parameters
Even with the available high-quality photometry, estimating reliable stellar parameters for Pleiades-age stars is more difficult than it may appear. As noted earlier, Stauffer et al. (2003), Bell et al. (2012) and Kamai et al. (2014) detected offsets between the empirical Pleiades CMD and that predicted by theory or empirically measured in older open clusters (i.e., Praesepe and the Hyades), an effect these authors attribute to the presence of cool starspots on the stellar photosphere. Stauffer et al. (2003) and Kamai et al. (2014) also reported correlations between each star's rotation rate (vrot sin i and Prot, respectively) and its color/magnitude displacement, providing additional evidence that this offset is a signature of the temperature differences introduced by large starspots on the photospheres of the Pleiades's fastest rotating, and thus most magnetically active, low-mass members. We utilize our expanded sample of Prot and homogeneous photometric data to examine this idea in Section 4.1; for now, we simply note that the presence of this offset complicates the assignment of stellar parameters based on a member's colors and magnitudes.
To make matters worse, the color–temperature relations predicted by various models and empirical calibrations (e.g., Dotter et al. 2008; Boyajian et al. 2012; Pecaut & Mamajek 2013) can disagree by as much as several hundred K, adding yet another systematic uncertainty when converting from observed colors to masses and temperatures. Luckily, these problems appear to be due to discrepancies at optical wavelengths: Bell et al. (2012) find that these offsets diminish to a negligible level at wavelengths longer than 2.2 μm, indicating that potential errors in photometric mass estimates can be minimized by inferring masses from a star's K magnitude.
We therefore convert each Pleiades member's K to an absolute MK, adopting the distance modulus of m − M = 5.67 measured by Melis et al. (2014) from VLBA parallaxes.10 We then infer the masses using the mass–MK relationship predicted by a 125 Myr, solar-metallicity ([Fe/H] = 0), non-α-enhanced ([α/Fe] = 0) Dartmouth isochrone (Dotter et al. 2008). We present these masses in Table 4, along with other relevant stellar parameters, for all stars for which we extract a robust Prot.
Finally, we label candidate binaries by analyzing the location of cluster members in the V versus (V − K) CMD. We follow Steele & Jameson (1995), who demonstrated that synthetic binary systems form a second sequence in the I versus (I − K) CMD that lies 0.75 mag brightward of the single-star sequence. These authors also showed that the binary sequence included systems with a wide range of mass ratios: even the lowest mass secondaries emit enough NIR flux to shift a binary system significantly redward of the single-star sequence in an optical/NIR CMD, and thus into the elevated binary sequence at that redder color. Only when the mass ratio becomes extremely uneven (Mprim/Msec = 0.2/0.03 ≈ 7) does the secondary fail to contribute enough red flux to push the system well into the elevated binary sequence.
We indicate the location of this binary sequence in Figure 1 by applying a 0.75 mag offset to the semi-empirical cluster sequence defined by Kamai et al. (2014), which we extend here to V = 20 and (V − K) = 6.4. We identify candidate binaries as those cluster members with V within 0.375 mag of the binary sequence in Figure 1; this assumes a 0.375 mag spread in both the binary and single-star populations. We flag the candidate binaries in Table 4, and investigate the effects of this binary selection threshold further in Figure 17 and Section 4.1.
3. PERIOD MEASUREMENTS
3.1. Photometric Monitoring and Light Curve Construction
We monitored the Pleiades using time allocated to two PTF Key Projects: the PTF/M-dwarfs survey (Law et al. 2011, 2012) and the PTF Open Cluster Survey (POCS; Agüeros et al. 2011; Douglas et al. 2014). PTF was a time-domain experiment using the robotic 48-inch Samuel Oschin (P48) telescope at Palomar Observatory, CA, and involved real-time data-reduction and transient-detection pipelines and a dedicated follow-up telescope.
The PTF infrastructure is described in Law et al. (2009); we focus here on the components associated with the P48, which we used to conduct our monitoring campaign. The P48 is equipped with the CFH12K mosaic camera, which was significantly modified to optimize its performance on this telescope. The camera has 11 working CCDs, which cover a 7.26 square degree field of view with 92 megapixels at 1'' sampling (Rahmer et al. 2008). Under typical observing conditions (11 seeing), it delivers 2'' full-width half-maximum images that reach a 5σ limiting R ≈ 21 mag in 60 s (Law et al. 2010).
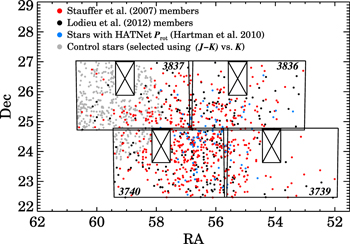
R-band observations of the four PTF fields that contain the most candidate Pleiades members were scheduled in the fall and winter of 2011–2012 (see Figure 4). Observations began on 2011 September 6 and ended on 2012 March 4; the number of visits each field received is given in Table 2. The ≳300 R-band visits to each field exceed by nearly an order of magnitude the number of visits that neighboring PTF fields received in the standard PTF survey. To provide sensitivity to long and short Prot, each Pleiades field received a mixture of low-density (≈1–2 visits per night) and high-density (≈20 visits per night) monitoring; high-density coverage was obtained for various fields in 2011 October and December and 2012 January.
Figure 4. Distribution of probable and possible Pleiades members with 2011–2012 PTF light curves. Pleiades members compiled by Stauffer et al. (2007) are shown in red, with additional candidates compiled by Lodieu et al. (2012) in black. Stars with Prot measured by Hartman et al. (2010) are highlighted in blue. A control sample of field stars that are offset from the cluster core and have PTF light curves and NIR colors and magnitudes consistent with cluster membership, is in gray. Individual PTF fields selected for POCS monitoring are overlaid in black; the location of the dead CCD in each PTF field is crossed out.
Download figure:
Standard image High-resolution imageTable 2. PTF Observations of Pleiades Fields
| Field | Field Center | Candidates | Visits |
|---|---|---|---|
| Number | (J2000) | with PTF LCs | |
| 3739 | 03:35:15 +23:37:30 | 99 | 327 |
| 3740 | 03:50:06 +23:37:30 | 389 | 287 |
| 3836 | 03:39:47 +38:19:00 | 174 | 310 |
| 3837 | 03:54:57 +37:19:00 | 156 | 303 |
Download table as: ASCIITypeset image
We follow Law et al. (2011) in assembling our photometric light curves. In brief: we perform aperture photometry using SExtractor (Bertin & Arnouts 1996) on each IPAC-processed PTF frame (Laher et al. 2014), whose photometric calibration is described by Ofek et al. (2012). This generates photometry for all objects at each epoch with approximate zero-points determined on a chip-by-chip basis using USNO-B1 (Monet et al. 2003) photometry of bright stars. After removing observations affected by, e.g., bad pixels, diffraction spikes, or cosmic rays, the positions of single-epoch detections were matched using a 2'' radius to produce multi-epoch light curves.
We then examine the light curves to identify epochs where a large fraction of the objects on each CCD had anomalous photometry due to atmospheric effects (most often due to clouds) or elevated background (e.g., moonlight). After removing the <2% of epochs that were typically flagged, as well as discounting objects exhibiting evidence for intrinsic astrophysical variability, the zero-point solution for each epoch was re-optimized to minimize the overall long-term rms variations for the ensemble of stars. The light curves were then detrended using five iterations of the SysRem algorithm (Tamuz et al. 2005) to remove smaller-scale variations that affected groups of stars on sub-chip-scales, such as airmass variations across the image and thin small-scale clouds.
3.2. Measuring Rotation Periods
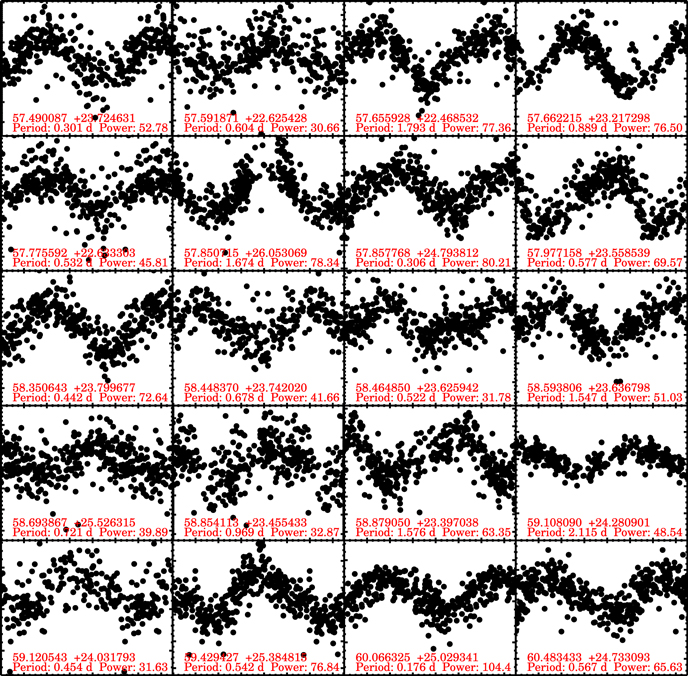
We search for signatures of periodic variability in the PTF data for 818 candidate Pleiads with median RPTF between 12.9 and 19 mag. After removing data points flagged as potentially spurious (e.g., because many sources at a given epoch significantly deviate from their means), we compute Lomb–Scargle periodograms (Scargle 1982) for each light curve using an updated version of the iterative process developed by Agüeros et al. (2011), extended by Xiao et al. (2012), and illustrated in Figures 8 and 9.
In each iteration, the Lomb–Scargle periodogram is sensitive to periods from 0.1 to 30 days and is used to identify the period with maximum power. The light curve is then phased to this period, pre-whitened by subtracting the median value of all points within 0.035 in phase, and all points that are 4σ outliers to the pre-whitened light curve are then excluded from the next iteration. We adopt the period with the maximum power in the periodogram computed after three iterations of this process as the most likely Prot.
3.3. Establishing Criteria for Reliable Period Measurements
3.3.1. Internal Check: Pleiads versus Control Stars
To evaluate the reliability and robustness of our Prot measurements, we construct a control sample of field stars with colors and magnitudes similar to those of bona fide Pleiades members. These light curves will have the same instrumental signatures as those of our Pleiades targets, but should exhibit significantly lower levels of intrinsic astrophysical variability due to their older ages and lower levels of magnetic activity (as expected based on the age-activity relation; e.g., Hawley et al. 1999; Soderblom et al. 2001; Douglas et al. 2014). By injecting artificial periodic signals into these quieter light curves, we test our ability to accurately recover Prot from light curves that reflect the exact cadence and noise properties of our Pleiades targets' light curves.
We select stars from the 4th U.S. Naval Observatory CCD Astrograph Catalog (Zacharias et al. 2012) database within 2° of R.A. = 4 HR, decl. = +255 (J2000), a region on the edge of the PTF Pleiades fields. From these 19,500 stars we then choose those with colors and magnitudes similar to those of the Pleiades cluster sequence; specifically, we pick stars with:

Two thousand twenty four stars satisfy these constraints. Of these, 427 lie within the PTF Pleiades footprint and have light curves with a median RPTF between 12.9 and 19 mag. We include these stars in the K versus (J − K) CMD shown in Figure 3, and summarize the properties of the sample in Table 1.
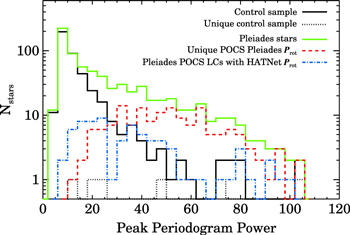
To develop a catalog of robust Prot, we utilize a set of objective criteria informed by previous analyses and new comparisons to empirical and synthetic period measurements. A key metric is the maximum power in the periodogram's primary peak, a quantity highlighted with an orange triangle in the middle panel of Figures 8 and 9. The distributions of the power in the periodogram's primary peak is shown in Figure 5 for stars in the Pleiades sample and in the control sample of field stars.
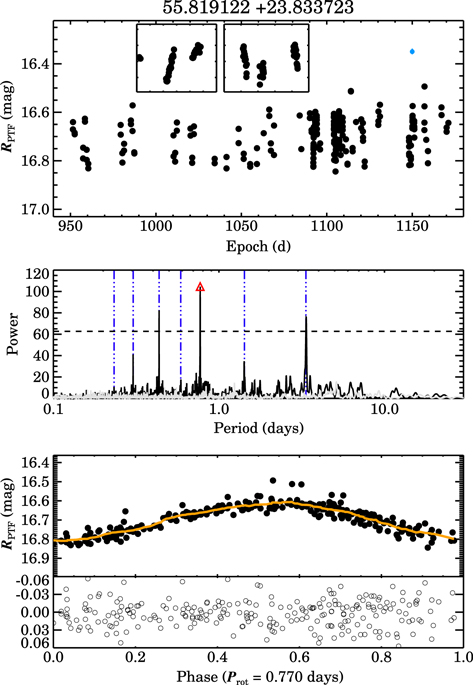
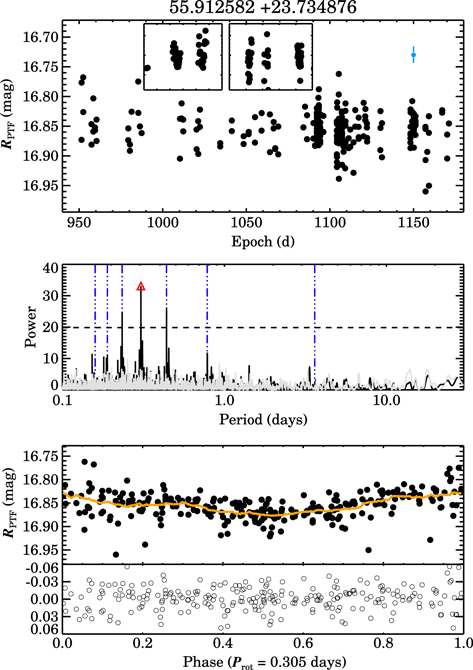
Figure 5. Illustration of our period-finding procedure. Top: the full PTF light curve for this candidate Pleiad. The inserts correspond to times when this field was monitored at a high cadence (days 1091-1094 and 1103-1108, respectively). The light blue point shows the median photometric uncertainty on these data; here it is about the size of the data point. Middle: the periodogram calculated from this light curve via our iterative process (black line), with the peak power, corresponding to a period of 0.770 days, highlighted with a red triangle. Beat periods between this period and a 1 day alias are flagged with vertical (dark blue) dashed lines; the power threshold used to flag sources with ambiguous period detections (i.e., additional periods with ≥60% of the primary peak's power) is shown as a horizontal dashed line.Bottom: the light curve phase-folded to the 0.770 day period. A median-filtered version of the phase-folded light curve, shown as an orange line, is subtracted to create a pre-whitened light curve, shown in the sub-panel at the bottom. The periodogram computed from this pre-whitened light curve is shown as a gray line in the middle panel. The primary peak and beat periods are not present in the periodogram of the pre-whitened light curve, indicating that the periodic signature removed during the pre-whitening accounts for all of the significant structure in the star's light curve.
Download figure:
Standard image High-resolution imageThe Pleiades and control samples contain similar numbers of stars whose periodograms exhibit primary peaks at low power levels (0 < power < 20). At powers >20, however, the Pleiades sample begins to exhibit a clear excess of higher-power peaks relative to what is seen in the control sample. The Pleiades sample has four times as many stars with power ≈30 as the control sample, and the disparity grows at higher power levels.
The higher powers seen in the Pleiades sample are consistent with a picture in which young, magnetically active stars have higher starspot covering fractions, producing higher levels of periodic photometric variability and thus more structured periodograms than exhibited by their field-star brethren.
In addition, we follow Xiao et al. (2012) in assessing the extent to which each Prot is unique and unambiguous. We define a period to be uniquely and unambiguously measured when the periodogram contains no secondary peaks exceeding 60% of the height of the primary peak, aside from beat periods between the primary peak and a potential 1 day alias. This threshold and the beat periods that are excluded when executing this test are identified in the middle panels of Figures 8 and 9 with cyan and red lines, respectively. For brevity, we hereafter refer to periodogram peaks that meet this criterion as unique, despite the presence of many structures in the periodogram at lower levels of significance.
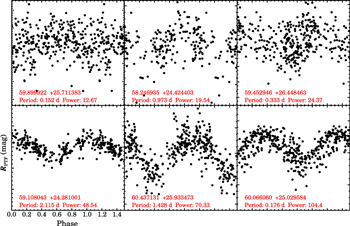
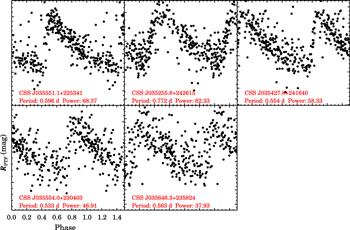
Of the 818 candidate Pleiades members with PTF light curves in our sample, 153 produce periodograms that satisfy this criterion for a unique and unambiguous Prot measurement. As Figure 5 shows, unique periodogram peaks are among the strongest on an absolute scale, and only six unique peaks are found for the control sample of older field stars in the same area of NIR color–magnitude space as that occupied by bona fide Pleiads. Phase-folded light curves for these six control stars are shown in Figure 6. Three have periodogram peaks with powers ≤25; the three with power >30 are clearly periodic.
Figure 6. As in Figure 8, but for a star whose light curve produces a periodogram peak lying near the power cutoff defined in Section 3 for making robust Prot measurements.
Download figure:
Standard image High-resolution image3.3.2. External Test: Comparison with HATNet Prot Measurements
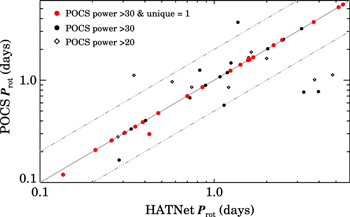
We examine the agreement between the Prot we measure using POCS data and the independent Prot measured for Pleiads by Hartman et al. (2010) using photometry from the HATNet planet-search program. Figure 7 compares the Prot for 54 stars for which the POCS periodogram includes a peak with power >20. Twenty of these stars have a POCS periodogram with an unambiguous peak (unique flag = 1). All of those peaks have power ≥30, and the resulting POCS period measurement is identical to the HATNet period (ΔProt < 1%) for all but two sources, representing a 90% recovery rate.
Figure 7. Distributions of the power in the primary peak in periodograms calculated from PTF light curves. Sources with strong periodogram peaks are dominated by candidate or confirmed Pleiads, which exhibit a clear excess of high-power peaks relative to the control sample of field stars. Interestingly, stars with Prot reported by Hartman et al. (2010) are typically found at somewhat lower power levels than the most strongly periodic stars in the POCS sample. Stars with prominent peaks in their POCS periodogram are predominantly lower-mass stars and lie below the sensitivity of the HATNet survey, which measured Prot mainly for brighter (and less photometrically variable) FGK stars.
Download figure:
Standard image High-resolution imageFigure 8. Phased light curves for the six stars in our control group that meet our criterion for a unique periodogram peak. The top row are the three stars with peak periodogram power >30; these three are clearly periodic.
Download figure:
Standard image High-resolution imageFigure 9. Comparison of the Prot measured by the HATNet and PTF surveys. The solid line corresponds to a 1:1 agreement, while the dashed lines correspond to factor of 2 differences between the measured Prot. Hartman et al. (2010) reported periods for 20 stars with POCS periodograms featuring unambiguous peaks (i.e., unique = 1), all of which also have a power >30. The POCS and HATNet Prot are identical for 90% (18/20) of these sources; the remaining two are rapid rotators (Prot < 0.5 days) where the HATNet and POCS periods differ by 0.012 and 0.12 days. The other POCS targets with HATNet periods have periodograms with strong secondary peaks (i.e., unique = 0); these stars show poorer agreement with the HATNet measurements, even when the primary peaks have absolute power levels well above the minimum power of the objects meeting the "unique" criterion.
Download figure:
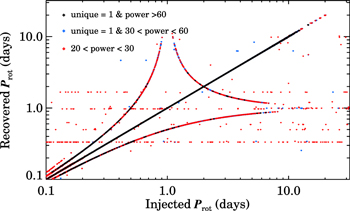
Standard image High-resolution imageThe stars with differing Prot are fast rotators with strong periodogram peaks. Assuming the HATNet periods measured for these stars are correct, the 10% relative disagreement measured for one star, which has a POCS power of 75, corresponds to a small absolute difference in Prot (0.119 versus 0.135 days). The second star appears to lie on the locus of beat periods between true periods and a 1 day sampling cadence shown in Figure 10, a difficult-to-eradicate failure state for ground-based monitoring programs, as demonstrated by the Monte Carlo simulations discussed below.
Figure 10. Comparison of Prot injected into, and recovered from, PTF light curves of a control sample of 394 field stars with colors and magnitudes similar to those of Pleiads and lacking initial periodogram peaks with power >30. Spurious measurements arise primarily from beat periods between the true Prot and a 1 day sampling frequency (i.e., the curved lines tending to the limit of Prot = 1 day in x and in y).
Download figure:
Standard image High-resolution imageExamining the POCS Prot for an additional 20 sources with power >30 but ambiguous period measurements (unique = 0), we find much poorer agreement with the HATNet results. The POCS and HATNet periods agree to better than 3% for only 60% (12/20) of these sources. Relaxing the criteria further, periods derived from ambiguous periodograms with peaks with power between 20 and 30 agree to within 3% with the HATNet measurement in only ≈15% (2/14) cases.
We also examine the overlap and agreement between our Prot values and those reported by Scholz & Eislöffel (2004) for nine low-mass Pleiads. POCS light curves were recorded for eight of these sources, but all but one produced periodograms featuring only weak peaks (power < 20). The exception is BPL 102, one of the most massive objects in the Scholz & Eislöffel (2004) sample. The POCS periodogram features a moderate peak (power ≈38) at 0.81 days, consistent with the period measured by Scholz & Eislöffel (2004), but additional peaks are detected with a significant fraction of this power (i.e., unique = 0), preventing the unambiguous identification of this period from the POCS data.
These tests demonstrate the importance of evaluating both the absolute and relative power of a given periodogram peak in establishing its reliability.
3.3.3. External Test: Monte Carlo Validation of Pipeline Results
We use a Monte Carlo approach to verify that our pipeline accurately recovers variability signals injected into the PTF light curves of our control sample of stars. As indicated by their modest powers in Figure 5, stars in our control sample typically exhibit low levels of photometric variability compared to our sample of candidate and confirmed Pleiads. To ensure that any intrinsic astrophysical variability in these light curves will be dominated by the artificial signals we inject, we remove 33 stars from the control sample whose periodograms feature a peak with power ≥30. The light curves of the remaining 394 stars still surely contain meaningful astrophysical variability. But any degradation of the artificial signals we introduce into these light curves caused by the stars' intrinsic variability will only cause us to underestimate the performance of our pipeline, resulting in overly conservative thresholds for extracting reliable Prot.
We first create densely sampled sinusoids with Prot selected randomly from a uniform distribution in log space of −1 < log Prot < 1.5, corresponding to minimum and maximum periods of 0.1 and 31.6 days. The amplitude of each sinusoid is scaled relative to the standard deviation of the target light curve, with unique sinusoids generated for each of five different amplitude ratios: amplitude/σlight curve = 0.3, 0.6, 0.9, 1.2, and 1.5.
We then add these sinusoids to the target light curve after interpolating the function onto the exact epochs for each measurement. We generate 500 sinusoids for each of the amplitude ratios and test our ability to recover 2500 unique instances of periodic variability from the light curves of each of the 394 stars in our power-restricted control sample.
Applying our algorithm to the set of 985,000 artificially variable light curves, we measure the dependence of the recovery rate and accuracy of our period detection on the properties of the input light curve (i.e., period and amplitude) and the output periodogram (i.e., absolute and relative height of the periodogram peak).
In Figure 10 we compare the simulated and recovered periods for individual light curves, and in Figure 11 we display the cumulative distribution function of the fraction of Prot successfully recovered when applying different quality cuts to the sample. We define a successful recovery as one in which the input and recovered Prot agree to within 3%, and find that our overall success rate is 66% for this simulation.
Figure 11. Fraction of successfully recovered synthetic periods as a function of the corresponding peak periodogram power. For powers ≲40, the recovery rate of the true period when the period is unambiguous (i.e., no secondary peaks with power >60% of the primary peak's; solid line) is 20%–25% higher than the rate for the full sample of periodiograms (dashed line).
Download figure:
Standard image High-resolution imageSpurious measurements arise primarily from beat periods between the true Prot and the typical 1 day sampling frequency of the PTF monitoring. These spurious measurements are most prevalent among, but not limited to, stars whose periodograms feature multiple strong peaks (i.e., unique = 0) or low power levels (<30). As Figure 11 shows, the recovery rate increases with the strength of the periodogram's primary peak, and restricting the sample to sources with a single strong peak (unique = 1) enables the recovery rate to exceed 50% even for periodograms with relatively weak power levels (≈20).
3.4. New, Reliable Periods for Low-mass Pleiads
As a result of the work described above, we adopt the following criteria to define reliable Prot measurements.
- 1.Unique Periodogram Peak. We eliminate stars with periodograms that include, aside from expected beat periods, secondary peaks with power >60% that of the primary peak. This requirement is motivated by the poor agreement between the POCS and HATNet periods for stars with otherwise strong periodogram peaks.
- 2.Peak Periodogram Power >30. We also eliminate stars whose periodograms feature primary peaks with power <30. This criterion is motivated by our pipeline's poor success rate (<80%; see Figure 11) at accurately recovering periods from simulated light curves producing unambiguous but weak (power <30) periodogram peaks.
Table 3 summarizes the number of stars that pass each stage of these quality cuts. Our pipeline produced a robust Prot for 132 Pleiads. This sample spans a range of masses from 0.18 to 0.65 M⊙, and includes 20 stars with M ≥ 0.45 M⊙ and periods previously measured by Hartman et al. (2010). Our work thus provides new Prot for 112 Pleiads (including 14 candidate binaries), the vast majority of which occupy a previously unexplored area of mass–period space for this benchmark open cluster.
Table 3. Building a Robust Sample of Rotators
| Pleiads | Number |
|---|---|
| with PTF light curves | 818 |
| ...and unique periodograms | 154 |
| ...and power >30 | 132 |
Download table as: ASCIITypeset image
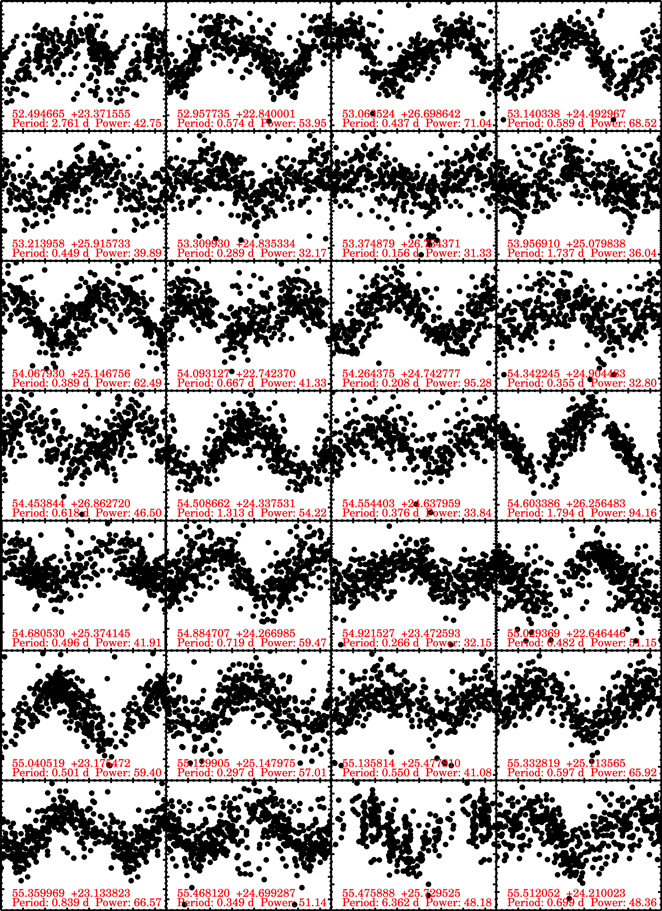
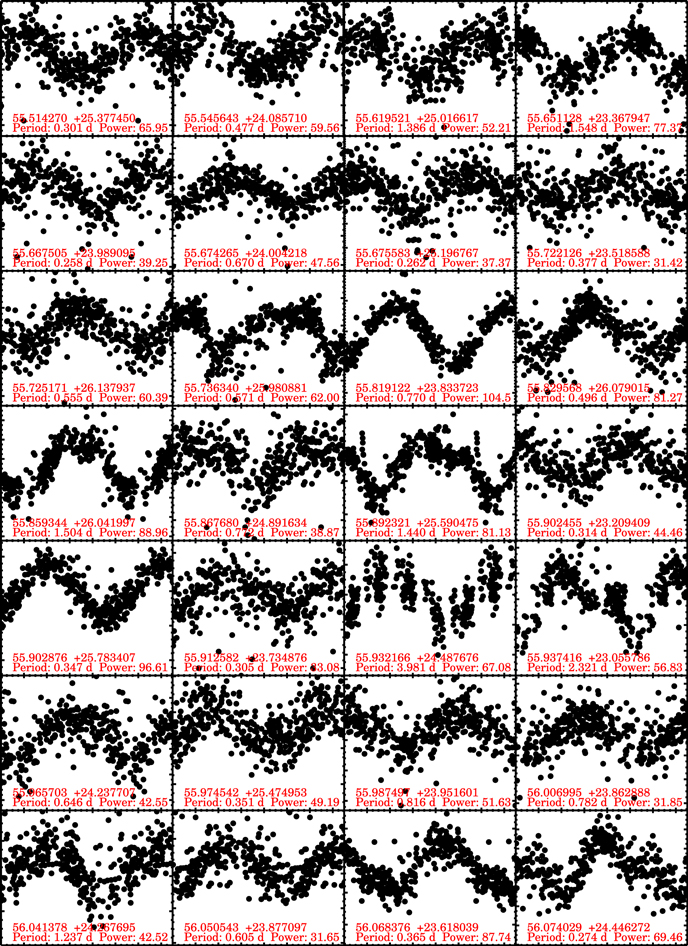
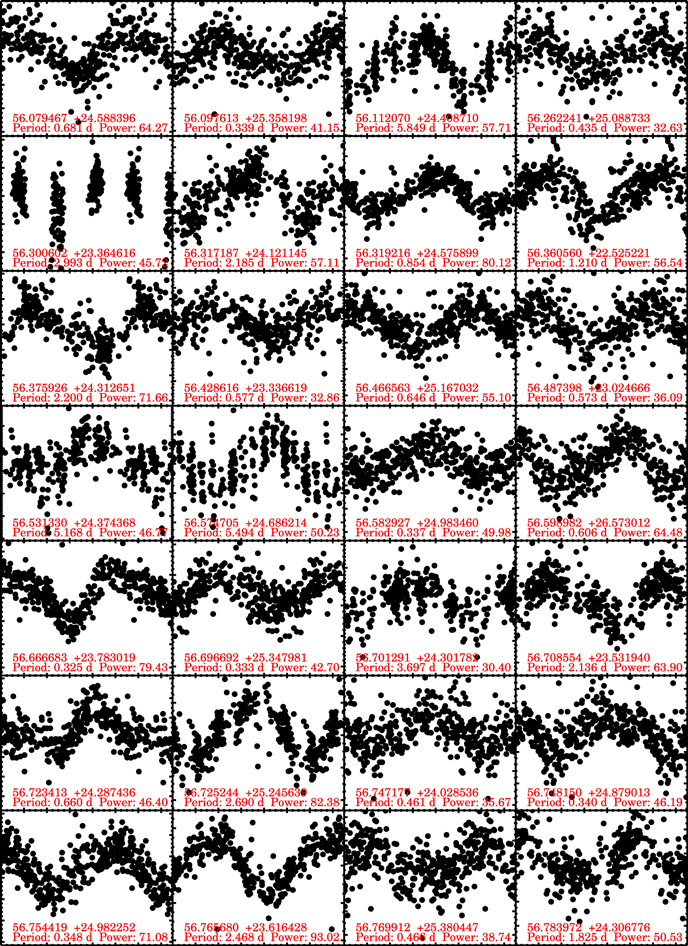
We present key photometric and light curve properties for all 132 rotators in Table 4, with individual phased light curves shown in Appendix
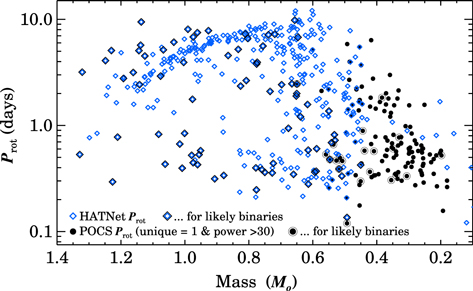
Figure 12. Prot for Pleiads vs. mass inferred from each star's MK. PTF's sensitivity enables Prot measurements for 0.18 < M < 0.45 M⊙ members, capturing the rapid rotation that characterizes the lowest-mass stars and complementing the extensive sample of rotation period measurements reported by Hartman et al. (2010) for higher-mass (>0.4 M⊙) Pleiads. The Prot measured by these two programs provide complete coverage of the mass–period plane for this benchmark 125 Myr-old cluster.
Download figure:
Standard image High-resolution imageTable 4. POCS Pleiades Periods
| R.A. | Decl. | V | V | K | K err. | K | Δ V-K | Mass | Phot. | POCS | POCS | POCS | POCS | HATnet | |
|---|---|---|---|---|---|---|---|---|---|---|---|---|---|---|---|
| 2MASS ID | (J2000) | (J2000) | (mag) | source | (mag) | (mag) | source | (mag) | (M 
|
Bin.? | P  (d) (d) |
Power | Amp. | epochs |
 (d) (d) |
| 03295874+2322186 | 52.49466511 | 23.37155514 | ⋯ | ⋯ | 11.95 | 0.02 | Stauffer | ⋯ | 0.41 | ⋯ | 2.76 | 42.75 | 0.06 | 335 | ⋯ |
| 03314984+2250248 | 52.95773498 | 22.84000116 | ⋯ | ⋯ | 12.75 | 0.02 | 2MASS | ⋯ | 0.27 | ⋯ | 0.57 | 53.95 | 0.08 | 336 | ⋯ |
| 03321528+2641547 | 53.06352439 | 26.69864157 | 16.75 | Kamai | 11.73 | 0.02 | Stauffer | 0.07 | 0.45 | 0 | 0.44 | 71.05 | 0.05 | 303 | ⋯ |
| 03323369+2429350 | 53.14033811 | 24.49296746 | ⋯ | ⋯ | 12.19 | 0.02 | Stauffer | ⋯ | 0.37 | ⋯ | 0.59 | 68.52 | 0.08 | 335 | ⋯ |
| 03325135+2554570 | 53.21395850 | 25.91573260 | ⋯ | ⋯ | 13.00 | ⋯ | UKIDSS | ⋯ | 0.23 | ⋯ | 0.45 | 39.90 | 0.09 | 303 | ⋯ |
| 03331437+2450084 | 53.30992987 | 24.83533410 | ⋯ | ⋯ | 12.86 | 0.03 | 2MASS | ⋯ | 0.25 | ⋯ | 0.29 | 32.18 | 0.08 | 303 | ⋯ |
| ⋯ | 53.37487945 | 26.73437085 | ⋯ | ⋯ | 13.26 | ⋯ | DANCe | ⋯ | 0.19 | ⋯ | 0.16 | 31.34 | 0.11 | 303 | ⋯ |
| 03354967+2504484 | 53.95691042 | 25.07983834 | 16.45 | Kamai | 11.69 | 0.02 | Stauffer | −0.04 | 0.45 | 0 | 1.74 | 36.05 | 0.02 | 303 | ⋯ |
| 03361630+2508491 | 54.06793048 | 25.14675643 | 16.35 | Kamai | 11.31 | 0.02 | Stauffer | 0.28 | 0.52 | 1 | 0.39 | 62.50 | 0.04 | 304 | 0.39 |
| 03362232+2244331 | 54.09312654 | 22.74236956 | ⋯ | ⋯ | 11.91 | 0.02 | Stauffer | ⋯ | 0.42 | ⋯ | 0.67 | 41.33 | 0.04 | 339 | ⋯ |
| 03370346+2444356 | 54.26437463 | 24.74277685 | 16.00 | Stauffer | 11.44 | 0.02 | Stauffer | −0.05 | 0.49 | 0 | 0.21 | 95.29 | 0.04 | 304 | 0.21 |
| 03372223+2454163 | 54.34224470 | 24.90448260 | ⋯ | ⋯ | 12.82 | 0.03 | 2MASS | ⋯ | 0.26 | ⋯ | 0.36 | 32.81 | 0.03 | 304 | ⋯ |
| 03374891+2651455 | 54.45384442 | 26.86271968 | ⋯ | ⋯ | 12.59 | 0.03 | Stauffer | ⋯ | 0.30 | ⋯ | 0.62 | 46.50 | 0.06 | 305 | ⋯ |
| 03380203+2420154 | 54.50866201 | 24.33753119 | 17.60 | Stauffer | 12.26 | 0.02 | Stauffer | −0.06 | 0.36 | 0 | 1.31 | 54.23 | 0.06 | 334 | ⋯ |
| 03381302+2438171 | 54.55440308 | 24.63795865 | 18.30 | Stauffer | 12.79 | 0.02 | Stauffer | −0.18 | 0.26 | 0 | 0.38 | 33.85 | 0.09 | 334 | ⋯ |
| 03382478+2615238 | 54.60338648 | 26.25648344 | 17.60 | Stauffer | 12.22 | 0.02 | Stauffer | −0.01 | 0.36 | 0 | 1.79 | 94.16 | 0.12 | 305 | ⋯ |
| 03384329+2522273 | 54.68052998 | 25.37414464 | 16.40 | Stauffer | 11.32 | 0.02 | Stauffer | 0.30 | 0.52 | 1 | 0.50 | 41.92 | 0.03 | 305 | ⋯ |
| 03393231+2416014 | 54.88470657 | 24.26698474 | ⋯ | ⋯ | 12.20 | 0.02 | Stauffer | ⋯ | 0.37 | ⋯ | 0.72 | 59.47 | 0.06 | 335 | ⋯ |
| 03394111+2328235 | 54.92152693 | 23.47259278 | 18.80 | Stauffer | 13.11 | 0.03 | Stauffer | −0.21 | 0.21 | 0 | 0.27 | 32.16 | 0.12 | 336 | ⋯ |
| 03400700+2238477 | 55.02936853 | 22.64644641 | 19.20 | Stauffer | 13.05 | 0.03 | Stauffer | 0.08 | 0.22 | 0 | 0.48 | 51.16 | 0.18 | 335 | ⋯ |
| 03400967+2310328 | 55.04051866 | 23.17547150 | ⋯ | ⋯ | 12.65 | 0.02 | Stauffer | ⋯ | 0.29 | ⋯ | 0.50 | 59.40 | 0.07 | 336 | ⋯ |
| 03403115+2508530 | 55.12990545 | 25.14797490 | 17.17 | Stauffer | 11.71 | 0.02 | Stauffer | 0.25 | 0.45 | 1 | 0.30 | 57.01 | 0.05 | 305 | 0.42 |
| 03403257+2528409 | 55.13581401 | 25.47781023 | 19.50 | Stauffer | 13.18 | 0.03 | Stauffer | 0.13 | 0.20 | 0 | 0.55 | 41.09 | 0.09 | 305 | ⋯ |
| 03411985+2506492 | 55.33281900 | 25.11356486 | 18.20 | Stauffer | 12.83 | 0.03 | Stauffer | −0.28 | 0.26 | 0 | 0.60 | 65.92 | 0.06 | 305 | ⋯ |
| 03412635+2308029 | 55.35996882 | 23.13382276 | ⋯ | ⋯ | 12.62 | 0.02 | Stauffer | ⋯ | 0.29 | ⋯ | 0.84 | 66.57 | 0.10 | 336 | ⋯ |
| 03415230+2441579 | 55.46811989 | 24.69928730 | 18.90 | Stauffer | 13.05 | 0.02 | Stauffer | −0.09 | 0.22 | 0 | 0.35 | 51.14 | 0.11 | 334 | ⋯ |
| 03415420+2543473 | 55.47588758 | 25.72952459 | 16.79 | Stauffer | 11.91 | 0.02 | Stauffer | −0.11 | 0.42 | 0 | 6.36 | 48.18 | 0.04 | 305 | ⋯ |
| 03420286+2412363 | 55.51205208 | 24.21002278 | 16.41 | Stauffer | 11.61 | 0.02 | Stauffer | 0.02 | 0.47 | 0 | 0.70 | 48.36 | 0.04 | 334 | 0.70 |
| 03420341+2522393 | 55.51427049 | 25.37745032 | 18.10 | Stauffer | 12.44 | 0.03 | Stauffer | 0.05 | 0.32 | 0 | 0.30 | 65.95 | 0.08 | 305 | ⋯ |
| 03421090+2405086 | 55.54564278 | 24.08571020 | 15.95 | Stauffer | 11.15 | 0.02 | Stauffer | 0.21 | 0.55 | 1 | 0.48 | 59.56 | 0.03 | 334 | 0.48 |
| 03422864+2501004 | 55.61952053 | 25.01661724 | 16.48 | Stauffer | 11.67 | 0.02 | Stauffer | −0.00 | 0.46 | 0 | 1.39 | 52.21 | 0.03 | 305 | ⋯ |
| 03423626+2322048 | 55.65112799 | 23.36794738 | 17.60 | Stauffer | 12.32 | 0.02 | Stauffer | −0.11 | 0.35 | 0 | 1.55 | 77.37 | 0.09 | 295 | ⋯ |
| 03424022+2359217 | 55.66750543 | 23.98909457 | 15.72 | Stauffer | 11.14 | 0.02 | Stauffer | 0.12 | 0.55 | 0 | 0.26 | 39.26 | 0.03 | 294 | 0.26 |
| 03424184+2400158 | 55.67426506 | 24.00421795 | ⋯ | ⋯ | 12.71 | 0.02 | Stauffer | ⋯ | 0.28 | ⋯ | 0.67 | 47.57 | 0.07 | 294 | ⋯ |
| 03424210+2511489 | 55.67558280 | 25.19676662 | 19.61 | Stauffer | 13.39 | 0.04 | Stauffer | −0.02 | 0.18 | 0 | 0.26 | 37.37 | 0.15 | 305 | ⋯ |
| ⋯ | 55.72212582 | 23.51858757 | ⋯ | ⋯ | 12.21 | ⋯ | DANCe | ⋯ | 0.37 | ⋯ | 0.38 | 31.43 | 0.03 | 295 | ⋯ |
| 03425399+2608163 | 55.72517121 | 26.13793696 | 18.70 | Stauffer | 12.82 | 0.03 | Stauffer | 0.02 | 0.26 | 0 | 0.56 | 60.39 | 0.07 | 305 | ⋯ |
| 03425665+2558504 | 55.73633992 | 25.98088064 | 18.00 | Stauffer | 11.96 | 0.03 | Stauffer | 0.47 | 0.41 | 1 | 0.57 | 62.00 | 0.08 | 305 | ⋯ |
| 03431659+2350018 | 55.81912223 | 23.83372277 | 18.48 | Stauffer | 12.40 | 0.02 | Stauffer | 0.32 | 0.33 | 1 | 0.77 | 104.55 | 0.20 | 294 | ⋯ |
| 03431905+2604441 | 55.82956767 | 26.07901470 | 18.00 | Stauffer | 12.31 | 0.02 | Stauffer | 0.13 | 0.35 | 0 | 0.50 | 81.28 | 0.11 | 305 | ⋯ |
| 03432619+2602308 | 55.85934378 | 26.04199654 | 16.56 | Stauffer | 11.89 | 0.02 | Stauffer | −0.18 | 0.42 | 0 | 1.50 | 88.97 | 0.05 | 305 | ⋯ |
| 03432820+2453311 | 55.86767976 | 24.89163425 | 17.53 | Stauffer | 12.17 | 0.02 | Stauffer | −0.01 | 0.37 | 0 | 0.77 | 38.88 | 0.07 | 305 | ⋯ |
| 03433413+2535261 | 55.89232064 | 25.59047460 | 16.99 | Stauffer | 12.00 | 0.02 | Stauffer | −0.12 | 0.40 | 0 | 1.44 | 81.14 | 0.09 | 305 | ⋯ |
| 03433656+2312343 | 55.90245549 | 23.20940912 | 18.00 | Stauffer | 12.37 | 0.02 | Stauffer | 0.06 | 0.33 | 0 | 0.31 | 44.46 | 0.09 | 295 | ⋯ |
| 03433666+2547007 | 55.90287551 | 25.78340745 | 16.83 | Stauffer | 12.05 | 0.02 | Stauffer | −0.23 | 0.39 | 0 | 0.35 | 96.61 | 0.08 | 305 | ⋯ |
| 03433903+2344054 | 55.91258238 | 23.73487587 | 18.05 | Stauffer | 12.27 | 0.02 | Stauffer | 0.20 | 0.35 | 1 | 0.31 | 33.08 | 0.05 | 294 | ⋯ |
| 03434371+2429157 | 55.93216646 | 24.48767634 | 16.10 | Stauffer | 11.50 | 0.02 | Stauffer | −0.05 | 0.48 | 0 | 3.98 | 67.09 | 0.04 | 293 | ⋯ |
| 03434496+2303213 | 55.93741630 | 23.05578639 | 16.83 | Stauffer | 11.73 | 0.02 | Stauffer | 0.09 | 0.45 | 0 | 2.32 | 56.83 | 0.05 | 293 | ⋯ |
| 03435175+2414161 | 55.96570267 | 24.23770738 | ⋯ | ⋯ | 12.38 | 0.02 | Stauffer | ⋯ | 0.33 | ⋯ | 0.65 | 42.55 | 0.09 | 293 | ⋯ |
| 03435386+2528301 | 55.97454226 | 25.47495274 | 16.15 | Stauffer | 11.47 | 0.02 | Stauffer | 0.00 | 0.49 | 0 | 0.35 | 49.19 | 0.02 | 305 | 0.35 |
| 03435699+2357059 | 55.98749666 | 23.95160059 | 17.93 | Stauffer | 12.30 | 0.02 | Stauffer | 0.09 | 0.35 | 0 | 0.82 | 51.63 | 0.07 | 294 | ⋯ |
| 03440167+2351462 | 56.00699494 | 23.86288793 | 17.22 | Stauffer | 11.99 | 0.02 | Stauffer | −0.01 | 0.40 | 0 | 0.78 | 31.86 | 0.03 | 294 | ⋯ |
| 03440990+2416040 | 56.04137815 | 24.26769482 | 16.36 | Kamai | 11.53 | 0.02 | Stauffer | 0.06 | 0.48 | 0 | 1.24 | 42.52 | 0.03 | 293 | 1.24 |
| 03441213+2352375 | 56.05054289 | 23.87709713 | 17.90 | Stauffer | 12.57 | 0.02 | Stauffer | −0.19 | 0.30 | 0 | 0.61 | 31.66 | 0.05 | 294 | ⋯ |
| 03441644+2337043 | 56.06837622 | 23.61803853 | 17.69 | Stauffer | 11.89 | 0.02 | Stauffer | 0.37 | 0.42 | 1 | 0.37 | 87.74 | 0.08 | 294 | ⋯ |
| 03441774+2426469 | 56.07402913 | 24.44627184 | 16.62 | Stauffer | 11.69 | 0.02 | Stauffer | 0.05 | 0.45 | 0 | 0.27 | 69.46 | 0.06 | 293 | ⋯ |
| 03441905+2435184 | 56.07946744 | 24.58839573 | 17.83 | Stauffer | 12.44 | 0.02 | Stauffer | −0.10 | 0.32 | 0 | 0.68 | 64.27 | 0.11 | 293 | ⋯ |
| 03442338+2521301 | 56.09761289 | 25.35819838 | 16.80 | Stauffer | 11.61 | 0.02 | Stauffer | 0.19 | 0.47 | 0 | 0.34 | 41.15 | 0.03 | 305 | ⋯ |
| 03442687+2424318 | 56.11206969 | 24.40870971 | 16.07 | Stauffer | 11.45 | 0.02 | Stauffer | −0.02 | 0.49 | 0 | 5.85 | 57.72 | 0.04 | 293 | ⋯ |
| 03450287+2505198 | 56.26224139 | 25.08873294 | 18.54 | Stauffer | 12.85 | 0.02 | Stauffer | −0.10 | 0.25 | 0 | 0.44 | 32.63 | 0.07 | 305 | ⋯ |
| 03451214+2321532 | 56.30060152 | 23.36461647 | 17.64 | Stauffer | 12.24 | 0.02 | Stauffer | −0.02 | 0.36 | 0 | 2.99 | 45.72 | 0.07 | 292 | ⋯ |
| 03451612+2407162 | 56.31718678 | 24.12114504 | 16.00 | Stauffer | 11.63 | 0.02 | Stauffer | −0.24 | 0.46 | 0 | 2.19 | 57.12 | 0.05 | 298 | ⋯ |
| 03451664+2434325 | 56.31921573 | 24.57589935 | 16.18 | Stauffer | 11.43 | 0.02 | Stauffer | 0.05 | 0.50 | 0 | 0.85 | 80.13 | 0.05 | 293 | 0.86 |
| 03452655+2231322 | 56.36056011 | 22.52522100 | 17.40 | Stauffer | 12.25 | 0.02 | Stauffer | −0.16 | 0.36 | 0 | 1.21 | 56.55 | 0.15 | 297 | ⋯ |
| 03453021+2418455 | 56.37592551 | 24.31265149 | 15.74 | Stauffer | 11.13 | 0.02 | Stauffer | 0.14 | 0.55 | 0 | 2.20 | 71.66 | 0.04 | 293 | 2.19 |
| 03454286+2320124 | 56.42861587 | 23.33661859 | ⋯ | ⋯ | 13.20 | ⋯ | UKIDSS | ⋯ | 0.20 | ⋯ | 0.58 | 32.87 | 0.13 | 292 | ⋯ |
| 03455194+2510019 | 56.46656334 | 25.16703178 | 18.70 | Stauffer | 12.81 | 0.02 | Stauffer | 0.03 | 0.26 | 0 | 0.65 | 55.11 | 0.09 | 305 | ⋯ |
| 03455695+2301292 | 56.48739829 | 23.02466598 | 17.90 | Stauffer | 12.58 | 0.02 | Stauffer | −0.20 | 0.30 | 0 | 0.57 | 36.09 | 0.07 | 292 | ⋯ |
| 03460750+2422278 | 56.53132955 | 24.37436769 | 14.71 | Stauffer | 10.86 | 0.02 | Stauffer | −0.04 | 0.60 | 0 | 5.17 | 46.77 | 0.02 | 293 | 5.17 |
| 03461793+2441095 | 56.57470506 | 24.68621385 | 16.20 | Stauffer | 11.69 | 0.02 | Stauffer | −0.19 | 0.45 | 0 | 5.49 | 50.23 | 0.04 | 295 | 5.49 |
| 03461984+2459015 | 56.58292723 | 24.98346040 | 17.40 | Stauffer | 11.97 | 0.02 | Stauffer | 0.12 | 0.41 | 0 | 0.34 | 49.98 | 0.03 | 305 | ⋯ |
| 03462372+2634234 | 56.59898192 | 26.57301170 | 18.60 | Stauffer | 12.84 | 0.03 | Stauffer | −0.06 | 0.26 | 0 | 0.61 | 64.49 | 0.08 | 305 | ⋯ |
| ⋯ | 56.66668339 | 23.78301855 | ⋯ | ⋯ | 11.92 | ⋯ | DANCe | ⋯ | 0.42 | ⋯ | 0.33 | 79.44 | 0.12 | 293 | ⋯ |
| 03464718+2520534 | 56.69669244 | 25.34798089 | 18.70 | Stauffer | 12.53 | 0.03 | Stauffer | 0.31 | 0.31 | 1 | 0.33 | 42.71 | 0.06 | 305 | ⋯ |
| 03464831+2418060 | 56.70129124 | 24.30178170 | 16.24 | Stauffer | 11.72 | 0.02 | Stauffer | −0.20 | 0.45 | 0 | 3.70 | 30.40 | 0.01 | 295 | 3.72 |
| 03465008+2331563 | 56.70855377 | 23.53193973 | 17.80 | Stauffer | 12.39 | 0.02 | Stauffer | −0.07 | 0.33 | 0 | 2.14 | 63.91 | 0.08 | 296 | ⋯ |
| 03465360+2417151 | 56.72341315 | 24.28743618 | 16.27 | Stauffer | 11.21 | 0.02 | Stauffer | 0.32 | 0.54 | 1 | 0.66 | 46.41 | 0.04 | 295 | ⋯ |
| 03465403+2514449 | 56.72524431 | 25.24563863 | 16.19 | Stauffer | 11.49 | 0.02 | Stauffer | −0.00 | 0.49 | 0 | 2.69 | 82.39 | 0.03 | 305 | ⋯ |
| 03465931+2401429 | 56.74717714 | 24.02853609 | 17.60 | Stauffer | 12.11 | 0.02 | Stauffer | 0.09 | 0.38 | 0 | 0.46 | 35.68 | 0.06 | 293 | ⋯ |
| 03465947+2452464 | 56.74814984 | 24.87901350 | 18.40 | Stauffer | 12.35 | 0.02 | Stauffer | 0.32 | 0.34 | 1 | 0.34 | 46.19 | 0.07 | 305 | ⋯ |
| 03470099+2458574 | 56.75441943 | 24.98225183 | ⋯ | ⋯ | 12.34 | 0.02 | Stauffer | ⋯ | 0.34 | ⋯ | 0.35 | 71.08 | 0.10 | 305 | ⋯ |
| 03470376+2336588 | 56.76568048 | 23.61642753 | 15.35 | Stauffer | 10.60 | 0.02 | Stauffer | 0.48 | 0.65 | 1 | 2.47 | 93.02 | 0.03 | 293 | 2.45 |
| 03470474+2522502 | 56.76991193 | 25.38044651 | 16.35 | Stauffer | 11.26 | 0.02 | Stauffer | 0.32 | 0.53 | 1 | 0.47 | 38.75 | 0.03 | 305 | ⋯ |
| 03470813+2418246 | 56.78397188 | 24.30677566 | 16.95 | Stauffer | 11.90 | 0.02 | Stauffer | −0.04 | 0.42 | 0 | 1.83 | 50.53 | 0.04 | 295 | ⋯ |
| 03471365+2349535 | 56.80690016 | 23.83151104 | 15.78 | Stauffer | 11.09 | 0.02 | Stauffer | 0.20 | 0.56 | 1 | 0.53 | 53.79 | 0.03 | 293 | ⋯ |
| 03472385+2308571 | 56.84922746 | 23.14903368 | 17.33 | Stauffer | 12.07 | 0.02 | Stauffer | −0.03 | 0.39 | 0 | 1.66 | 84.48 | 0.08 | 296 | ⋯ |
| 03472578+2508330 | 56.85752870 | 25.14236677 | 16.91 | Stauffer | 11.45 | 0.02 | Stauffer | 0.40 | 0.49 | 1 | 0.12 | 74.67 | 0.09 | 304 | 0.14 |
| 03472840+2632058 | 56.86820506 | 26.53499222 | ⋯ | ⋯ | 12.39 | 0.02 | Stauffer | ⋯ | 0.33 | ⋯ | 0.36 | 77.49 | 0.13 | 303 | ⋯ |
| 03473585+2452269 | 56.89942978 | 24.87387056 | 18.78 | Stauffer | 12.84 | 0.02 | Stauffer | 0.05 | 0.26 | 0 | 0.42 | 54.44 | 0.10 | 304 | ⋯ |
| 03473935+2427322 | 56.91393165 | 24.45894716 | 17.56 | Stauffer | 12.16 | 0.02 | Stauffer | 0.02 | 0.37 | 0 | 0.52 | 45.89 | 0.08 | 293 | ⋯ |
| 03474386+2613271 | 56.93285137 | 26.22409550 | ⋯ | ⋯ | 12.82 | 0.03 | Stauffer | ⋯ | 0.26 | ⋯ | 0.34 | 54.53 | 0.09 | 302 | ⋯ |
| ⋯ | 56.94063826 | 24.09363326 | ⋯ | ⋯ | 12.35 | ⋯ | DANCe | ⋯ | 0.34 | ⋯ | 0.53 | 35.73 | 0.07 | 291 | ⋯ |
| 03475094+2430188 | 56.96224034 | 24.50524354 | 16.13 | Stauffer | 11.47 | 0.02 | Stauffer | −0.01 | 0.49 | 0 | 1.42 | 50.37 | 0.03 | 293 | 1.41 |
| 03475526+2319060 | 56.98032942 | 23.31817262 | 17.33 | Stauffer | 12.15 | 0.02 | Stauffer | −0.10 | 0.38 | 0 | 1.37 | 46.82 | 0.04 | 292 | ⋯ |
| 03480581+2302030 | 57.02426564 | 23.03397771 | 16.16 | Stauffer | 11.55 | 0.02 | Stauffer | −0.08 | 0.48 | 0 | 1.56 | 38.34 | 0.03 | 292 | 1.56 |
| 03480796+2344238 | 57.03322114 | 23.73998951 | 17.30 | Stauffer | 12.18 | 0.02 | Stauffer | −0.15 | 0.37 | 0 | 0.51 | 58.92 | 0.07 | 291 | ⋯ |
| 03481377+2337596 | 57.05743494 | 23.63332766 | 17.72 | Stauffer | 12.11 | 0.02 | Stauffer | 0.17 | 0.38 | 1 | 1.83 | 41.22 | 0.08 | 291 | ⋯ |
| 03482658+2311299 | 57.11084501 | 23.19148426 | 17.87 | Stauffer | 11.36 | 0.02 | Stauffer | 1.00 | 0.51 | 1 | 0.46 | 65.14 | 0.07 | 292 | ⋯ |
| 03483183+2401590 | 57.13269373 | 24.03295810 | 18.30 | Stauffer | 12.85 | 0.02 | Stauffer | −0.24 | 0.25 | 0 | 0.49 | 34.22 | 0.07 | 291 | ⋯ |
| 03483267+2352407 | 57.13611052 | 23.87808619 | ⋯ | ⋯ | 12.87 | 0.03 | 2MASS | ⋯ | 0.25 | ⋯ | 1.56 | 61.00 | 0.11 | 291 | ⋯ |
| 03483548+2412033 | 57.14788550 | 24.20077232 | 19.67 | Stauffer | 13.21 | 0.02 | Stauffer | 0.20 | 0.20 | 1 | 0.52 | 41.58 | 0.17 | 293 | ⋯ |
| 03490148+2411383 | 57.25628182 | 24.19392074 | 17.70 | Stauffer | 12.51 | 0.02 | Stauffer | −0.25 | 0.31 | 0 | 0.41 | 35.54 | 0.07 | 292 | ⋯ |
| 03491102+2420513 | 57.29603697 | 24.34751792 | 17.43 | Stauffer | 12.18 | 0.02 | Stauffer | −0.07 | 0.37 | 0 | 2.01 | 62.43 | 0.11 | 292 | ⋯ |
| 03492148+2339066 | 57.33955247 | 23.65192192 | 17.15 | Stauffer | 11.98 | 0.02 | Stauffer | −0.03 | 0.41 | 0 | 0.34 | 62.54 | 0.04 | 291 | ⋯ |
| 03492662+2250548 | 57.36099383 | 22.84838830 | 18.23 | Stauffer | 12.51 | 0.02 | Stauffer | 0.06 | 0.31 | 0 | 0.98 | 65.52 | 0.08 | 292 | ⋯ |
| 03493253+2355426 | 57.38558548 | 23.92848672 | 17.91 | Stauffer | 12.44 | 0.02 | Stauffer | −0.05 | 0.32 | 0 | 0.78 | 72.39 | 0.12 | 291 | ⋯ |
| 03493279+2547471 | 57.38634076 | 25.79585908 | 18.30 | Stauffer | 12.62 | 0.02 | Stauffer | −0.01 | 0.29 | 0 | 0.41 | 35.46 | 0.05 | 301 | ⋯ |
| 03493302+2432027 | 57.38773738 | 24.53401103 | 16.58 | Stauffer | 11.74 | 0.02 | Stauffer | −0.02 | 0.45 | 0 | 1.59 | 83.09 | 0.07 | 292 | 1.59 |
| 03493527+2559350 | 57.39686426 | 25.99298827 | 18.30 | Stauffer | 12.69 | 0.03 | Stauffer | −0.08 | 0.28 | 0 | 0.27 | 58.69 | 0.08 | 302 | ⋯ |
| 03493610+2356234 | 57.40049832 | 23.93980292 | 17.46 | Stauffer | 12.28 | 0.02 | Stauffer | −0.15 | 0.35 | 0 | 0.62 | 50.31 | 0.08 | 291 | ⋯ |
| 03493651+2418144 | 57.40225000 | 24.30384552 | 17.23 | Stauffer | 12.43 | 0.02 | Stauffer | −0.44 | 0.32 | 0 | 0.68 | 65.92 | 0.09 | 292 | ⋯ |
| 03495547+2406052 | 57.48120347 | 24.10136598 | ⋯ | ⋯ | 12.63 | 0.02 | Stauffer | ⋯ | 0.29 | ⋯ | 0.56 | 51.39 | 0.10 | 291 | ⋯ |
| 03495762+2343284 | 57.49008659 | 23.72463071 | ⋯ | ⋯ | 13.39 | 0.02 | Stauffer | ⋯ | 0.18 | ⋯ | 0.30 | 52.78 | 0.24 | 291 | ⋯ |
| 03502203+2237326 | 57.59187149 | 22.62542831 | 18.09 | Stauffer | 12.30 | 0.02 | Stauffer | 0.19 | 0.35 | 1 | 0.60 | 30.67 | 0.04 | 295 | ⋯ |
| 03503740+2228083 | 57.65592827 | 22.46853150 | ⋯ | ⋯ | 12.37 | 0.02 | Stauffer | ⋯ | 0.34 | ⋯ | 1.79 | 77.37 | 0.08 | 295 | ⋯ |
| 03503890+2313028 | 57.66221496 | 23.21729769 | 17.12 | Stauffer | 11.75 | 0.02 | Stauffer | 0.19 | 0.44 | 1 | 0.89 | 76.51 | 0.06 | 294 | ⋯ |
| 03510611+2238010 | 57.77559169 | 22.63330340 | ⋯ | ⋯ | 12.98 | 0.03 | Stauffer | ⋯ | 0.23 | ⋯ | 0.53 | 45.82 | 0.10 | 295 | ⋯ |
| 03512416+2603116 | 57.85071482 | 26.05306881 | 16.68 | Stauffer | 11.68 | 0.02 | Stauffer | 0.08 | 0.46 | 0 | 1.67 | 78.35 | 0.05 | 301 | 1.67 |
| 03512586+2447390 | 57.85776837 | 24.79381174 | 15.83 | Stauffer | 11.19 | 0.02 | Stauffer | 0.12 | 0.54 | 0 | 0.31 | 80.22 | 0.04 | 305 | 0.31 |
| 03515450+2333317 | 57.97715824 | 23.55853930 | 17.53 | Stauffer | 11.78 | 0.02 | Stauffer | 0.38 | 0.44 | 1 | 0.58 | 69.58 | 0.09 | 295 | ⋯ |
| 03532410+2347587 | 58.35064263 | 23.79967662 | 18.10 | Stauffer | 12.55 | 0.02 | Stauffer | −0.06 | 0.30 | 0 | 0.44 | 72.65 | 0.11 | 292 | ⋯ |
| 03534758+2344310 | 58.44836996 | 23.74201991 | 17.64 | Stauffer | 12.28 | 0.02 | Stauffer | −0.05 | 0.35 | 0 | 0.68 | 41.66 | 0.06 | 292 | ⋯ |
| 03535152+2337327 | 58.46485025 | 23.62594161 | ⋯ | ⋯ | 13.10 | ⋯ | UKIDSS | ⋯ | 0.21 | ⋯ | 0.52 | 31.79 | 0.12 | 292 | ⋯ |
| 03542247+2338122 | 58.59380575 | 23.63679846 | 18.00 | Stauffer | 12.57 | 0.02 | Stauffer | −0.14 | 0.30 | 0 | 1.55 | 51.03 | 0.08 | 291 | ⋯ |
| 03544652+2531352 | 58.69386732 | 25.52631461 | ⋯ | ⋯ | 12.68 | 0.03 | Stauffer | ⋯ | 0.28 | ⋯ | 0.72 | 39.89 | 0.08 | 304 | ⋯ |
| 03552488+2327215 | 58.85411337 | 23.45543324 | ⋯ | ⋯ | 12.59 | 0.03 | 2MASS | ⋯ | 0.30 | ⋯ | 0.97 | 32.87 | 0.02 | 293 | ⋯ |
| 03553089+2323512 | 58.87904998 | 23.39703776 | 17.21 | Stauffer | 12.18 | 0.02 | Stauffer | −0.20 | 0.37 | 0 | 1.58 | 63.35 | 0.05 | 293 | ⋯ |
| 03562592+2416515 | 59.10809025 | 24.28090082 | 15.03 | Stauffer | 11.01 | 0.02 | Stauffer | −0.08 | 0.57 | 0 | 2.12 | 48.54 | 0.01 | 292 | ⋯ |
| 03562890+2401544 | 59.12054309 | 24.03179251 | 17.90 | Stauffer | 12.64 | 0.02 | Stauffer | −0.26 | 0.29 | 0 | 0.45 | 31.63 | 0.05 | 292 | ⋯ |
| 03574296+2523069 | 59.42942675 | 25.38481451 | ⋯ | ⋯ | 12.57 | 0.03 | Stauffer | ⋯ | 0.30 | ⋯ | 0.54 | 76.84 | 0.10 | 304 | ⋯ |
| 04001585+2501465 | 60.06632455 | 25.02934101 | ⋯ | ⋯ | 11.69 | 0.02 | 2MASS | ⋯ | 0.45 | ⋯ | 0.18 | 104.43 | 0.05 | 303 | ⋯ |
| 04015585+2444026 | 60.48343341 | 24.73309279 | ⋯ | ⋯ | 12.35 | 0.02 | 2MASS | ⋯ | 0.34 | ⋯ | 0.57 | 65.63 | 0.07 | 304 | ⋯ |
The 132 Prot we have obtained represent a ≈16% success rate for extracting period measurements from PTF light curves of Pleiades members. Studies of older clusters return a smaller fraction of period measurements. For example, Agüeros et al. (2011) used PTF to monitor Praesepe, a 600 Myr-old cluster, and obtained periods for ≈5% of the cluster members that fell within the PTF fields. This is consistent with the overall decay of photometric amplitudes as a function of stellar age.
4. DISCUSSION
4.1. Linking the Offsets in the (V − K) versus V CMD to Prot
Several groups have explored anomalies in the photometric properties of Pleiades members (Stauffer 1984; Stauffer et al. 2003; Bell et al. 2012; Kamai et al. 2014). These anomalies were identified as offsets between the Pleiades's cluster sequence and those measured in older open clusters (i.e., Praesepe and the Hyades) or theoretical 125 Myr isochrones. For example, Stauffer et al. (2003) found that the cluster's K dwarfs were bluer than their Praesepe analogs in the V versus (B − V) CMD, and redder in the V versus (V − K) one. In V versus (V − I), no offset was apparent, however, suggesting that the offsets seen in the other colors were not due to differences in the stars' V magnitudes, but rather represented excesses in both B and K.
The photometric anomalies seen in Pleiades members are typically attributed to the presence of cool starspots on their stellar photospheres. Kamai et al. (2014) found evidence for this explanation in a correlation between each star's Prot and its color/magnitude displacement relative to the mean cluster sequence. Those authors interpreted this rotation–color relationship as a signature of the increased impact of temperature differences on the photospheres of the Pleiades's fastest-rotating, and thus most heavily spotted, low-mass members.
We utilize our new period measurements to re-visit this potential connection between Pleiades members' Prot colors and photometric amplitudes. The low-mass stars for which we measured Prot are sufficiently faint and red that accurate B magnitudes are difficult to acquire, as reflected by the truncation of the (B − V) versus V cluster sequence at V = 17 mag in Figure 1. We therefore restrict our analysis of these color offsets to the V versus (V − K) plane, where the Pleiades cluster sequence is well defined for even the faintest, lowest-mass members for which we have measured Prot (V = 19.8, ≈0.18 M⊙). To provide a simple metric for each member's location in the CMD relative to the cluster sequence, we calculate the difference between its observed (V − K) and that predicted for its V magnitude by our extension of the V versus (V − K) cluster sequence of Kamai et al. (2014). Δ(V − K), the distance in color space from the cluster sequence, is conveyed in Figure 1 by the color of each point. We use this same color-coding in Figure 13, which shows each star's Prot as a function of its V magnitude. This color-coding reveals a vertical gradient in Figure 13, such that faster rotating stars have redder Δ(V − K) color excesses; this effect is most easily visible for 12 < V < 16, where fast and slow rotators are most widely separated. This gradient is consistent with the color-period correlation reported by Kamai et al. (2014): slowly rotating stars have bluer (V − K) colors than more rapidly rotating stars with the same V.
Figure 13. Prot as a function of V for Pleiades members, with individual points color-coded as in Figure 1. A color gradient is visible, particularly for sources with V > 14 mag. Rapidly rotating stars are systematically redder in (V − K) than more slowly rotating stars with the same V magnitude. To investigate the statistical significance of this effect, we overlay a dashed line to demonstrate the change in the median period as a function of V. We identify stars above and below this line as slow and fast rotators, respectively.
Download figure:
Standard image High-resolution imageIn Figure 13, we also include sources that we identify as candidate binaries. As noted earlier, these are cluster members that are at least 0.375 mag brighter than the cluster sequence in the V versus (V − K) CMD; our assumption is that an unseen secondary may be responsible for the excess V-band flux. Sources that are brighter than the cluster sequence for their color are also redder than the cluster sequence at their magnitude, however, so that there is likely no clear distinction in a single CMD between color anomalies due to spots and modest photometric contributions from a low-mass secondary. Indeed, our candidate binaries populate the same regions of the diagram as high Δ(V − K) sources.
To make matters worse, since tidal interactions with a close companion can affect a star's angular-momentum evolution, systems with low-mass secondaries that do remain in the putatively single-star sample may contribute to the observed correlation between Prot and Δ(V − K).
Lacking a complete census of stellar multiplicity in the Pleiades, we cannot fully disentangle the influence of binaries on the photometric and rotational signatures of cluster members. Therefore, we first establish the statistical significance of the correlation between Prot and Δ(V − K) visible in Figure 13, where we have removed candidate binaries with V excesses greater than 0.375 mag. We then examine how the significance of that correlation varies with the exact threshold adopted to identify candidate photometric binaries.
4.2. Statistical Significance of to the Correlation Between Prot and Δ(V − K)
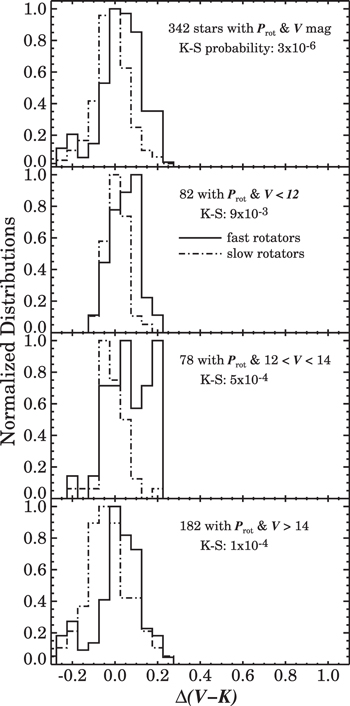
To confirm the correlation between Prot and Δ(V − K), we perform a Kolmogorov–Smirnov (K–S) test on the Δ(V − K) distributions for rapid and slow rotators. We first compute the median Prot for bins of V = 1 mag. Using the resulting median V versus Prot relation, shown as a dashed line in Figure 13, we divide the sample into slow and rapid rotators by determining if each star's Prot value is larger or smaller, respectively, than the median Prot for that star's magnitude bin.
Figure 14 shows the Δ(V − K) distributions for rapid and slow rotators across the sample's full range of magnitudes, and for bright (V ≤ 12 mag), intermediate (12 < V ≤ 14), and faint subsets (V > 14). K–S tests strongly reject the hypothesis that the Δ(V − K) distributions for the slow and fast rotators are selected from the same parent population: in all brightness regimes, there is a <0.1% chance that this is the case.
Figure 14. (V − K) offsets for samples of rapid (solid histograms) and slow (dot-dashed histograms) rotators. Top: offsets for all Pleiads with a measured Prot and (V − K). Second panel: for 82 bright (V < 12) Pleiads with a measured Prot and (V − K). Third panel: for 78 Pleiads of intermediate brightness (12 < V < 14). Bottom: for 182 faint (V > 14) Pleiads. In each panel, the distribution of (V − K) colors is skewed to the red for fast rotators relative to the distribution for bluer, slower rotators. K–S tests indicate this effect is highly significant, with a <0.1% chance that both distributions are drawn from the same parent sample in any given panel.
Download figure:
Standard image High-resolution imageThis correlation between rotation rate and color offset was detected by Kamai et al. (2014), but at different significance levels for different mass regimes. Using a Spearman ρ rank correlation test, these authors identified this signature for the K and M stars in their sample at a slightly higher level of statistical significance. This likely reflects the significant structure that is present in the relationship between Prot and color over any significant magnitude range.
In the high-mass regime, for example, stars follow a relation between Prot and mass/color/magnitude (i.e., bluer/higher-mass stars rotate more rapidly relative to redder/lower-mass stars) that directly counteracts the behavior of the rotation offset at a single mass/magnitude (i.e., rapidly rotating stars are redder than more slowly rotating counterparts at the same mass/magnitude). The opposing directions of these two effects serve to mute the overall impact of the correlation between Prot and color in the mass–period plane, making the underlying correlations more difficult to detect with the single rank correlation test employed by Kamai et al. (2014).
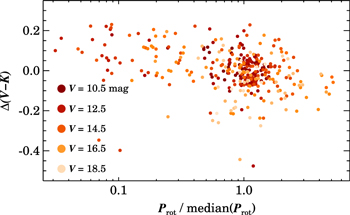
Our approach of searching for differences in Prot and color relative to stars with similar magnitudes, by contrast, appears better suited to detecting the second order correlation between Prot and Δ(V − K) across the full magnitude/mass range of the Pleiades CMD. Figure 15 shows the correlation between a star's relative rotation rate and color excess most directly, by plotting Δ(V − K) as a function of the star's Prot value normalized to the median Prot for stars in its magnitude bin. Significant scatter remains, but the fundamental relationship between a star's relative rotation rate and color emerges: rapid rotators have positive Δ(V − K) offsets (i.e., are redder), while slower rotators have negative Δ(V − K) offsets (i.e., are bluer).
Figure 15. Δ(V − K) offset as a function of relative rotation period for apparently single Pleiades members, with individual points color-coded according to each star's V magnitude. Rotation periods are normalized by the median Prot of stars within a 1 mag bin in V (i.e., the points anchoring the dashed line in Figure 13). While there is substantial scatter, a star's Prot and Δ(V − K) color offset are correlated. Rapid rotators with Prot/median(Prot) < 0.3 show largely positive Δ(V − K) offsets, while slower rotators with Prot/median(Prot) > 1.5 exhibit mostly negative Δ(V − K) offsets.
Download figure:
Standard image High-resolution imageA relationship between a star's rotation rate and the filling factor of its cool starspots could provide a natural explanation for the observed correlation between Prot and photospheric colors. As Stauffer et al. (2003) and Kamai et al. (2014) outlined previously, cool spots will produce redder colors, and will be more prominent on rapidly rotating stars, whose strong rotationally driven dynamos will generate large spots in regions of high magnetic flux. As starspots are thought to be responsible for the rotationally modulated flux changes that enable Prot measurements, this explanation could also imply that rapid rotators should exhibit larger photometric amplitudes than slower rotators, if the asymmetry in starspot distributions grow proportionally to the size of the spots themselves.
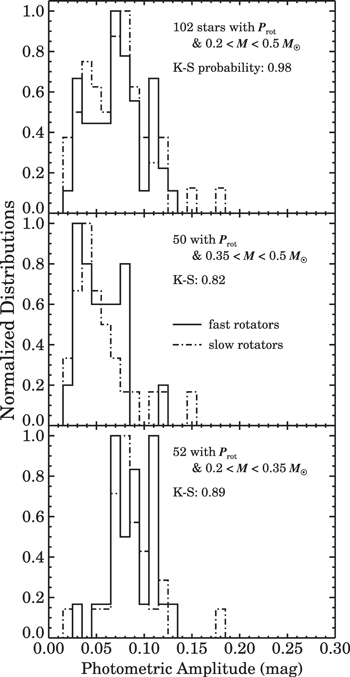
We therefore searched for differences in the photometric amplitudes of the stars in our sample as a function of their Prot. The resulting histograms are shown in Figure 16, divided into bins to examine the behavior across different mass regimes. Interestingly, we find no significant difference between the photometric amplitudes exhibited by fast and slow rotators, indicating that any dependence of spot size/filling factor on rotation rate must not produce a corresponding change in the asymmetry of the longitudinal distribution of starspots.
Figure 16. Photometric amplitudes measured from PTF light curves for rapid (solid histograms) and slow (dashed histograms) rotators. Top: amplitudes for Pleiads with masses 0.2 < M ≤ 0.5 M⊙. Second panel: for Pleiads with 0.35 < M ≤ 0.5 M⊙. Bottom: for Pleiads with 0.2 < M ≤ 0.35 M⊙. No significant differences are detected in the photometric amplitudes of rapidly and slowly rotating Pleiads. K–S tests indicate a ≥82% likelihood that both distributions are drawn from the same parent sample in any given panel.
Download figure:
Standard image High-resolution image4.3. Sensitivity of the Prot, Δ(V − K) Correlation to the Adopted Binary Threshold
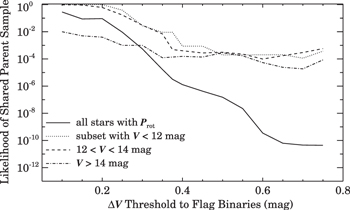
While starspots provide one explanation for the connection between a Pleiad's Prot and Δ(V − K), another could be the presence and influence of an unseen secondary, which could both produce a redder Δ(V − K) offset and spin up the primary. To test the robustness of this observational correlation against various photometric thresholds for flagging candidate binaries, we re-computed the K–S tests shown in Figure 14 after using thresholds as low as 0.1 mag and as high as 0.75 mag, to remove candidate binaries from the sample. We show the resulting likelihoods in Figure 17 as a function of the adopted binary threshold; separate lines show the likelihoods for the full sample, and subsets of the sample drawn from narrower magnitude ranges.
Figure 17. Likelihood of a shared parent sample for the Δ(V − K) offsets of rapid and slow rotators as a function of the V magnitude threshold ΔV used to remove candidate binaries from the sample.
Download figure:
Standard image High-resolution imageAdopting a stricter threshold by rejecting candidate binaries lying closer to the primary cluster sequence increases the likelihood that the Δ(V − K) distributions for the remaining fast and slow rotators are drawn from the same parent population. Increasing the likelihood of a shared parent sample for the full sample to be >1%, however, requires rejecting all sources 0.25 mag or brighter than the cluster sequence as candidate binaries. And no threshold is strict enough to bring the Δ(V − K) distributions for the faintest cohort into agreement. Even rejecting stars as little as 0.1 mag above the cluster sequence results in a <1% likelihood of a shared parent Δ(V − K) distribution for the faint rapid and slow rotators.
Relaxing the binary selection threshold, by contrast, only increases the discrepancy between the Δ(V − K) distributions of fast and slow rotators. Objects flagged as binaries are, by definition, those with the greatest separations from the cluster sequence, and relaxing the binary threshold only adds sources with large, positive Δ(V − K) values. Furthermore, as expected if unseen companions are spinning up the primaries, Figure 13 shows that sources flagged as binaries using our default 0.375 mag threshold are overwhelmingly fast rotators. The result is that the high Δ(V − K) sources that are added by relaxing the binary threshold are nearly all incorporated into the fast rotating population, thus enhancing the underlying Δ(V − K) discrepancy.
Ultimately, changing the threshold used to flag likely binaries does not affect the underlying empirical correlation between Prot and Δ(V − K) across the full population of Pleiades members. Adopting a strict binary threshold simply relegates the fastest rotators into the cluster's binary population, for which rapid rotation is explained as the product of interactions. Conversely, relaxing the threshold incorporates increasing numbers of rapidly rotators into the cluster's putatively single-star population, for which color excess is explained as the signature of starspots.
4.4. Evolution of the Mass–Period Relation
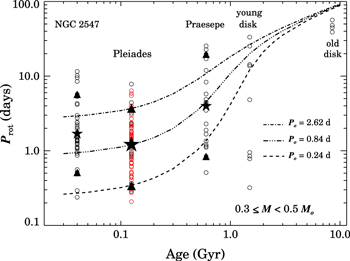
As the lowest-mass members of the Pleiades have only recently arrived on the ZAMS, their Prot measurements provide a new opportunity to test whether models can correctly predict the rotational evolution of these stars. We begin by selecting 75 Pleiads with HATNet or POCS Prot measurements (19 from the former survey, 56 from the latter), no evidence of potential binarity based on their position in the cluster CMD, and masses 0.3 ≤ M < 0.5 M⊙.
We find median, 10th, and 90th percentile Prot values of 1.21, 0.34, and 3.70 days, respectively. Following Agüeros et al. (2011), we then use the formalism developed by Barnes & Kim (2010) and Barnes (2010) to find the corresponding zero-age-main-sequence periods (Po) for each of these representative 125 Myr-old stars, to which we assign a mass of 0.4 M⊙. This Po is fed back into the models to predict the Prot of these representative stars at ages ranging from 30 Myr to 10 Gyr.
The resulting evolutionary tracks are plotted in Figure 18, along with periods for 0.3 ≤ M < 0.5 M⊙ stars from NGC 2547 (≈40 Myr; data from Irwin et al. 2008), Praesepe (≈600 Myr; Agüeros et al. 2011), and young and old disk stars (1.5 and 8.5 Gyr; Kiraga & Stępień 2007). The masses for NGC 2547 stars were obtained by Irwin et al. (2008) using model isochrones from Baraffe et al. (1998) and Chabrier et al. (2000). For Praesepe, Agüeros et al. (2011) used both the empirical Delfosse et al. (2000) and the theoretical Dotter et al. (2008) absolute magnitude-mass relation to obtain masses from the stars' MK. Finally, Kiraga & Stępień (2007) estimated masses for their stars based on the Delfosse et al. (2000) relation for MV.
Figure 18. Predicted evolutionary tracks for 0.4 M⊙ Pleiads generated using the Barnes (2010) models compared to the observed distributions of Prot for 0.3 ≤ M < 0.5 M⊙ populations of different ages. The tracks are anchored to the median (star), 10th, and 90th percentile (triangles) Pleiads, which are obtained from the distribution of Prot for the 75 cluster members in this mass range with no evidence of potential binarity and HATNet or POCS Prot measurements (black and red circles, respectively). The models reproduce the spin-down seen for the median rotator between the age of the Pleiades and that of Praesepe. However, the range of periods observed at 600 Myr is larger than that expected based on the tracks anchored by the Pleiades 10th and 90th percentile rotators. A comparison to the younger NGC 2547 stars shows that these stars are still spinning up before reaching 100 Myr.
Download figure:
Standard image High-resolution imageThe models accurately reproduce the spin-down seen for the median ≈0.4 M⊙ rotator between the age of the Pleiades and that of Praesepe. However, the predictions for the 10th and 90th percentile stars fare less well, as the Prot distribution in Praesepe is broader than one would predict based on the Pleiades data. There are a number of possible explanations for this discrepancy. One is that the models may not account correctly for the spin-down for the fastest/slowest rotators. Conversely, our sample of Pleiades rotators may be incomplete, particularly for the always-hard-to-obtain longest Prot. Figure 12 shows a dearth of >3 day periods for the 0.3–0.4 M⊙ stars, and this may explain the apparent excess of slow rotators in Praesepe relative to predictions based on our sample of Pleiades Prot. Similarly, the HATNet and POCs sampling may not be sufficient to detect all of the fast rotators in Pleiades, leading to an apparent excess of fast rotators in Praesepe.
The disagreement between the predictions and what is seen at ages >1 Gyr is a by-product of the nature of the available sample of field stars. As pointed out in Agüeros et al. (2011), the Kiraga & Stępień (2007) sample is selected from X-ray-luminous stars and therefore potentially biased toward faster rotators. In addition, these are not true single-age populations. If the fast rotators are all younger than the slow ones, the disagreement with the evolutionary tracks is not as significant as suggested by Figure 18. The limitations of this comparison underlines the ongoing need for (admittedly difficult-to-obtain) Prot measurements of low-mass stars in older clusters.
The evolutionary tracks are extended to 30 Myr purely for reference. Low-mass stars at these young ages are still spinning up, presumably because they are still contracting. Indeed, the transition from spinning up to spinning down should occur at about the age of the Pleiades for ≈0.4 M⊙ stars (Reiners & Mohanty 2012). The distributions of Prot for NGC 2547 and the Pleiades shown in Figure 18 are fully consistent with this picture.
5. CONCLUSIONS
- 1.We present results from a PTF monitoring campaign to measure rotation periods for low-mass (0.18 < M < 0.65 M⊙) Pleiades members. This campaign, carried out over the fall and winter of 2011–2012, obtained ≈300 epochs of RPTF photometry for 818 Pleiades members in the cluster's central ≈24 square degrees.
- 2.Applying quality cuts informed by internal and external tests, we used an automated analysis pipeline to measure rotation periods for 132 Pleiades members. The periods produced by this pipeline were validated against period measurements previously reported for a subset of our sample, and results of Monte Carlo simulations where ≈106 synthetic periods were injected into authentic PTF light curves. These tests demonstrate that, with simple criteria to identify strong and unambiguous periodogram peaks, this pipeline is able to accurately identify a star's rotation period with ≥80% reliability, depending on the strength of the periodogram peak in question.
- 3.These Prot measurements reveal the morphology of the Pleiades's mass–period plane down to masses as low as 0.18 M⊙. Three-quarters (99/132) of the periods measured here were obtained for stars with masses ≤0.45 M⊙, a >6× increase over the number of periods that had been measured previously for Pleiads in this mass regime. These measurements demonstrate that low-mass Pleiades members occupy a distinct space in the mass–period plane, between a locus of rapid rotators with Prot ≈ 0.25 days, and a strongly mass-dependent upper envelope of slow rotators, with the maximum period declining from ≈4 days at 0.5 M⊙ to only ≈0.5 days at 0.2 M⊙.
- 4.When tested against rotation periods measured in the Pleiades and Praesepe, models developed by Barnes (2010) to describe stellar rotational evolution can quantitatively reproduce the spin-down of a typical 0.3 ≤ M < 0.5 M⊙ star from 125 to 600 Myr. The spin-down rates predicted by the Barnes (2010) models do not agree quantitatively with the periods measured for rapid and slow rotators in these clusters, however. When anchored by the 10th and 90th percentile Prot values measured for Pleiads in this mass range, models predict a narrower range of periods than is actually observed in the ≈600 Myr Praesepe cluster. This model-data discrepancy points to either missing physics in the rotational models, or to lingering incompleteness and bias in the samples of measured Prot.
- 5.We confirm that rapidly rotating stars exhibit systematically redder (V − K) colors than their more slowly rotating cousins. K–S tests indicate a <0.1% likelihood of a common (V − K) distribution for stars with Prot greater and less than the median Prot for their mass; this finding holds true when the cluster is considered as a whole, and when evaluating subsets covering a more restricted range of masses. The statistical significance of these photometric differences can be minimized if we adopt a conservative photometric binary threshold, thereby flagging most of the rapid rotators as likely binaries. In this scenario, the underlying photometric differences are explained as a product of a strong relationship between stellar rotation rate and binary frequency, rather than a dependence of photospheric/spot properties on rotation rate for putatively single rotators.
- 6.We identify no significant difference in the RPTF-band photometric amplitudes of slow and rapid rotators. K–S tests indicate a ≥82% likelihood that the observed amplitude distributions could arise even if slow and rapid rotators were randomly sampling of the same parent distribution. This null detection indicates that asymmetries in the longitudinal distributions of starspots do not scale strongly with stellar rotation period; subtler correlations may be detectable with Kepler/K2 light curves, however, given their significantly denser sampling and higher photometric precision than the PTF light curves that we analyze here.
We are grateful to Eran Ofek for his help scheduling and carrying out the PTF observations, to Adrian Price-Whelan for his help extracting light curves from the PTF database, and to Aaron Dotter for providing a 125 Myr isochrone with colors computed in the specific filters used during the course of this analysis. We also thank John Stauffer, Luisa Rebull, Kristen Larson, and the anonymous referee for comments that improved our analysis and presentation of our results.
K.R.C. thanks Hilary Schwandt and the WWU Faculty Research Writing Seminar for sage advice that accelerated the completion of this manuscript, and acknowledges support provided by the NSF through grant AST-1449476. M.A.A. acknowledges support provided by the NSF through grant AST-1255419.
Observations were obtained with the Samuel Oschin Telescope as part of the Palomar Transient Factory project, a scientific collaboration between the California Institute of Technology, Columbia University, Las Cumbres Observatory, the Lawrence Berkeley National Laboratory, the National Energy Research Scientific Computing Center, the University of Oxford, and the Weizmann Institute of Science.
The Two Micron All-Sky Survey was a joint project of the University of Massachusetts and the Infrared Processing and Analysis Center (California Institute of Technology). The University of Massachusetts was responsible for the overall management of the project, the observing facilities and the data acquisition. The Infrared Processing and Analysis Center was responsible for data processing, data distribution and data archiving.
This research has made use of NASA's Astrophysics Data System Bibliographic Services, the SIMBAD database, operated at CDS, Strasbourg, France, and the VizieR catalog access tool, CDS, Strasbourg, France (Ochsenbein et al. 2000).
This research was made possible through the use of the AAVSO Photometric All-Sky Survey (APASS), funded by the Robert Martin Ayers Sciences Fund.
APPENDIX A: INTERESTING VARIABLE STARS IN THE PTF PLEIADES FIELDS
Our light-curve analysis was largely restricted to stars identified previously as candidate Pleiades members. These are a small fraction of the objects in our target fields, however, so that many other variable stars are likely to be present in the full catalog of PTF light curves. We therefore performed a broader search for high-confidence variables within the full catalog of light curves in the PTF Pleiades fields.
Candidate variables were identified using the same period-finding algorithm described above, with the same criteria for significance and uniqueness. Among the 119 variable stars we identify in this manner are five known RR Lyrae (see Figure 19). All 119 stars are tabulated in Table 5.
Figure 19. Phased PTF light curves for five known RR Lyrae in our Pleiades fields.
Download figure:
Standard image High-resolution imageFigure 20. Phase-folded light curves for Pleiades members with newly measured Prot. The X-axis for each panel spans 0–1.5 in phase; the Y-axis is scaled to show 6.25 times the light curve's standard deviation, with the light curve offset vertically by 10% to leave white space for the coordinate and Prot information displayed at the bottom of each panel. Panels are ordered according to the object's right ascension (R.A.), as in Table 4: R.A. increases to the right in each row, and from the top row down.
Download figure:
Standard image High-resolution imageFigure 21. Phase-folded light curves for Pleiades members with newly measured Prot. The axes are scaled as described in Figure 20, and the R.A. ordering continues from Figure 20.
Download figure:
Standard image High-resolution imageFigure 22. Phase-folded light curves for Pleiades members with newly measured Prot. The axes are scaled as described in Figure 20, and the R.A. ordering continues from Figure 21.
Download figure:
Standard image High-resolution imageFigure 23. Phase-folded light curves for Pleiades members with newly measured Prot. The axes are scaled as described in Figure 20, and the R.A. ordering continues from Figure 22.
Download figure:
Standard image High-resolution imageFigure 24. Phase-folded light curves for Pleiades members with newly measured Prot. The axes are scaled as described in Figure 20, and the R.A. ordering continues from Figure 23.
Download figure:
Standard image High-resolution imageTable 5. Periods For Field Stars Observed During PTF Pleiades Campaign
| R.A. | decl. | RPTF | RPTF err | POCS | POCS | POCS | POCS | Notes |
|---|---|---|---|---|---|---|---|---|
| (J2000) | (J2000) | (mag) | (mag) | Prot | Power | Amp. | epochs | |
| 51.94879326 | 24.24068055 | 15.24 | 0.016 | 0.71 | 57.74 | 0.04 | 337 | ⋯ |
| 52.00883989 | 23.53802349 | 17.69 | 0.090 | 0.12 | 53.50 | 0.20 | 335 | ⋯ |
| 52.02393778 | 23.12858749 | 18.16 | 0.130 | 0.14 | 68.41 | 0.28 | 335 | ⋯ |
| 52.92060368 | 24.35219393 | 15.56 | 0.020 | 0.67 | 61.25 | 0.06 | 335 | ⋯ |
| 53.04009792 | 26.70932925 | 16.32 | 0.030 | 0.67 | 61.70 | 0.08 | 303 | ⋯ |
| 53.06836191 | 26.71902482 | 18.01 | 0.160 | 0.37 | 99.67 | 0.39 | 303 | ⋯ |
| 53.09808043 | 26.73725839 | 15.50 | 0.024 | 1.95 | 83.11 | 0.07 | 303 | HAT 214-16653a |
| 53.16238823 | 26.42155890 | 14.67 | 0.010 | 7.18 | 91.94 | 0.04 | 303 | ⋯ |
| 53.24573261 | 24.08963059 | 18.37 | 0.120 | 0.28 | 53.69 | 0.28 | 337 | ⋯ |
| 53.30451868 | 23.99756412 | 15.82 | 0.030 | 1.70 | 71.59 | 0.08 | 337 | ⋯ |
| 53.32414716 | 25.63574174 | 14.43 | 0.021 | 0.41 | 65.55 | 0.05 | 304 | ⋯ |
| 53.32645996 | 25.96274168 | 17.24 | 0.050 | 0.12 | 53.93 | 0.09 | 303 | ⋯ |
| 53.46385766 | 24.21337868 | 17.05 | 0.040 | 0.13 | 69.67 | 0.11 | 336 | ⋯ |
| 53.48379170 | 25.67595397 | 17.75 | 0.065 | 0.58 | 48.94 | 0.11 | 304 | ⋯ |
| 53.49683966 | 24.13472687 | 17.70 | 0.155 | 0.20 | 76.66 | 0.35 | 335 | ⋯ |
| 53.50491740 | 25.36498503 | 16.82 | 0.060 | 0.28 | 72.27 | 0.12 | 304 | ⋯ |
| 53.51194633 | 25.65112676 | 17.27 | 0.090 | 0.17 | 69.48 | 0.21 | 304 | ⋯ |
| 53.55047644 | 26.87167932 | 18.69 | 0.150 | 0.13 | 61.11 | 0.34 | 303 | ⋯ |
| 53.60923875 | 25.62690743 | 14.61 | 0.020 | 0.20 | 111.63 | 0.04 | 304 | ⋯ |
| 53.63960226 | 24.14289527 | 15.64 | 0.020 | 0.22 | 74.42 | 0.05 | 335 | ⋯ |
| 53.65023728 | 26.81475491 | 17.81 | 0.200 | 0.15 | 89.75 | 0.50 | 304 | ⋯ |
| 53.67593849 | 25.90575834 | 16.50 | 0.030 | 0.78 | 59.30 | 0.08 | 304 | ⋯ |
| 53.68094857 | 22.48026418 | 15.51 | 0.018 | 1.03 | 70.41 | 0.04 | 335 | ⋯ |
| 53.69424026 | 26.22319633 | 15.07 | 0.011 | 1.48 | 57.74 | 0.02 | 304 | ⋯ |
| 53.77350467 | 26.08222880 | 15.77 | 0.025 | 1.08 | 44.19 | 0.07 | 304 | ⋯ |
| 53.83466983 | 25.17530613 | 17.60 | 0.091 | 0.45 | 75.93 | 0.22 | 303 | ⋯ |
| 53.93929183 | 25.70422374 | 16.70 | 0.060 | 0.14 | 36.24 | 0.13 | 303 | ⋯ |
| 54.19947418 | 23.51579144 | 15.33 | 0.010 | 0.26 | 45.32 | 0.02 | 338 | ⋯ |
| 54.33276246 | 26.19422870 | 15.28 | 0.020 | 0.21 | 93.75 | 0.05 | 305 | ⋯ |
| 54.41420020 | 22.97074248 | 19.66 | 0.646 | 0.14 | 63.02 | 1.66 | 337 | ⋯ |
| 54.42398191 | 23.26708362 | 15.83 | 0.020 | 0.13 | 71.68 | 0.05 | 338 | ⋯ |
| 54.47309794 | 26.52419033 | 15.98 | 0.016 | 0.78 | 48.85 | 0.03 | 305 | ⋯ |
| 54.54425672 | 24.14586696 | 17.36 | 0.080 | 0.13 | 41.54 | 0.15 | 335 | ⋯ |
| 54.70270854 | 22.87224373 | 17.48 | 0.064 | 0.49 | 45.62 | 0.13 | 336 | ⋯ |
| 54.71701864 | 25.22733869 | 15.44 | 0.017 | 0.99 | 79.50 | 0.07 | 305 | ⋯ |
| 54.74292701 | 24.51279467 | 16.69 | 0.040 | 0.13 | 72.44 | 0.11 | 334 | ⋯ |
| 54.76559838 | 25.71999163 | 16.77 | 0.070 | 0.13 | 89.70 | 0.18 | 305 | ⋯ |
| 54.83170241 | 26.56893551 | 16.42 | 0.041 | 0.70 | 68.82 | 0.10 | 305 | ⋯ |
| 54.91657927 | 24.99429467 | 16.46 | 0.053 | 0.17 | 101.78 | 0.13 | 305 | ⋯ |
| 54.96611859 | 25.01020565 | 18.59 | 0.110 | 0.36 | 69.60 | 0.28 | 305 | ⋯ |
| 55.06090612 | 22.96704754 | 15.52 | 0.030 | 0.64 | 79.15 | 0.06 | 335 | ⋯ |
| 55.28896875 | 22.50216499 | 17.54 | 0.177 | 0.11 | 88.91 | 0.48 | 335 | ⋯ |
| 55.43015735 | 25.45481442 | 19.91 | 0.575 | 0.57 | 39.48 | 1.21 | 305 | ⋯ |
| 55.63105607 | 25.57347007 | 16.33 | 0.036 | 0.33 | 64.40 | 0.10 | 305 | ⋯ |
| 55.63175109 | 26.80435653 | 20.22 | 0.732 | 0.13 | 40.23 | 1.91 | 305 | ⋯ |
| 55.63893441 | 23.11859443 | 15.34 | 0.020 | 0.45 | 83.92 | 0.04 | 334 | ⋯ |
| 55.69099572 | 22.81896800 | 13.37 | 0.008 | 7.20 | 38.74 | 0.02 | 296 | HAT 259-07524a |
| 55.70723171 | 25.55042185 | 14.20 | 0.009 | 0.11 | 50.54 | 0.02 | 305 | ⋯ |
| 55.75994836 | 25.50616517 | 18.97 | 0.431 | 0.30 | 83.49 | 1.06 | 305 | ⋯ |
| 55.78017367 | 26.96653374 | 16.70 | 0.102 | 0.36 | 70.90 | 0.24 | 305 | eclipsing system? |
| 55.78048863 | 23.12129595 | 18.66 | 0.310 | 0.54 | 65.46 | 0.75 | 295 | ⋯ |
| 55.82047107 | 23.84000817 | 18.36 | 0.213 | 0.59 | 71.78 | 0.60 | 294 | ⋯ |
| 55.91060411 | 26.78811427 | 19.91 | 0.783 | 0.13 | 52.49 | 1.85 | 305 | ⋯ |
| 55.93421048 | 24.50778814 | 15.02 | 0.017 | 0.17 | 80.59 | 0.04 | 293 | ⋯ |
| 55.97155762 | 23.17001070 | 17.13 | 0.046 | 0.10 | 38.94 | 0.08 | 293 | ⋯ |
| 55.98405336 | 24.87148133 | 16.28 | 0.070 | 0.13 | 120.49 | 0.19 | 305 | ⋯ |
| 56.09297988 | 26.13287932 | 15.43 | 0.021 | 2.65 | 85.90 | 0.05 | 305 | ⋯ |
| 56.22457089 | 22.83150805 | 17.29 | 0.153 | 0.13 | 78.60 | 0.34 | 296 | ⋯ |
| 56.31226993 | 23.01847327 | 18.64 | 0.320 | 0.20 | 58.85 | 0.73 | 292 | ⋯ |
| 56.34840165 | 25.18516272 | 16.47 | 0.030 | 0.78 | 81.83 | 0.07 | 305 | ⋯ |
| 56.48350681 | 26.53822482 | 17.67 | 0.151 | 0.16 | 80.98 | 0.36 | 305 | ⋯ |
| 56.49159078 | 22.47860791 | 16.65 | 0.050 | 0.16 | 70.49 | 0.12 | 297 | ⋯ |
| 56.49195399 | 24.77451636 | 16.55 | 0.071 | 0.15 | 107.98 | 0.19 | 305 | ⋯ |
| 56.54708239 | 22.85455220 | 16.68 | 0.059 | 0.11 | 98.75 | 0.15 | 297 | ⋯ |
| 56.60629379 | 22.52109131 | 15.40 | 0.030 | 0.21 | 74.71 | 0.06 | 294 | ⋯ |
| 56.60903906 | 23.83696489 | 17.80 | 0.169 | 0.61 | 71.34 | 0.37 | 293 | ⋯ |
| 56.63370336 | 25.77739441 | 17.62 | 0.270 | 0.12 | 84.34 | 0.64 | 305 | ⋯ |
| 56.66720415 | 23.73691040 | 16.94 | 0.076 | 0.67 | 70.87 | 0.15 | 293 | ⋯ |
| 56.78816577 | 22.50875452 | 15.50 | 0.025 | 2.38 | 91.99 | 0.07 | 294 | HAT 260-17311a |
| 56.95470385 | 23.31837208 | 13.93 | 0.010 | 8.41 | 42.05 | 0.01 | 292 | HAT 260-15511a |
| 57.02932992 | 24.45347207 | 13.80 | 0.004 | 0.55 | 65.90 | 0.01 | 293 | ⋯ |
| 57.27038431 | 23.49428226 | 17.17 | 0.117 | 0.16 | 87.16 | 0.28 | 293 | ⋯ |
| 57.28316201 | 24.66621172 | 17.16 | 0.050 | 1.14 | 62.35 | 0.11 | 292 | ⋯ |
| 57.34771579 | 26.46287240 | 17.22 | 0.117 | 0.18 | 85.55 | 0.27 | 304 | ⋯ |
| 57.50125009 | 26.23309952 | 16.06 | 0.070 | 0.17 | 90.85 | 0.16 | 303 | ⋯ |
| 57.52071549 | 24.84965532 | 15.77 | 0.025 | 0.86 | 50.32 | 0.06 | 302 | ⋯ |
| 57.63369801 | 22.93461472 | 18.37 | 0.120 | 0.11 | 41.85 | 0.23 | 295 | ⋯ |
| 57.65023870 | 24.80087266 | 13.29 | 0.006 | 7.61 | 50.46 | 0.01 | 302 | ⋯ |
| 57.65520164 | 23.24005508 | 15.96 | 0.020 | 3.46 | 66.60 | 0.07 | 294 | ⋯ |
| 57.79423753 | 22.85162850 | 13.94 | 0.006 | 1.40 | 54.75 | 0.02 | 295 | HAT 260-17647a |
| 57.95069142 | 23.28593777 | 15.02 | 0.010 | 0.98 | 58.74 | 0.02 | 295 | LP 357-25 |
| 57.97951864 | 22.56919993 | 18.92 | 0.203 | 0.15 | 55.36 | 0.47 | 295 | ⋯ |
| 58.15605533 | 26.33587884 | 17.21 | 0.124 | 0.12 | 85.49 | 0.31 | 304 | ⋯ |
| 58.18445476 | 26.16550063 | 14.27 | 0.008 | 0.81 | 61.99 | 0.02 | 304 | ⋯ |
| 58.23250991 | 24.43780141 | 18.42 | 0.122 | 0.77 | 62.33 | 0.31 | 293 | CSS J035255.8+242615b |
| 58.29638364 | 23.48580383 | 15.41 | 0.030 | 0.22 | 108.64 | 0.08 | 296 | ⋯ |
| 58.41222669 | 25.73144733 | 17.39 | 0.110 | 0.16 | 67.98 | 0.24 | 304 | ⋯ |
| 58.47022025 | 23.44487631 | 16.04 | 0.028 | 0.85 | 97.70 | 0.08 | 296 | ⋯ |
| 58.48019506 | 24.63153754 | 18.67 | 0.110 | 0.21 | 42.51 | 0.23 | 293 | ⋯ |
| 58.51391773 | 23.86491914 | 15.68 | 0.019 | 7.54 | 76.75 | 0.05 | 291 | ⋯ |
| 58.61281679 | 26.41789809 | 16.65 | 0.030 | 0.10 | 46.14 | 0.06 | 304 | ⋯ |
| 58.61606076 | 24.27806186 | 18.66 | 0.212 | 0.55 | 58.34 | 0.57 | 292 | CSS J035427.8+241640b |
| 58.62379156 | 25.01125225 | 17.30 | 0.100 | 0.13 | 77.92 | 0.24 | 304 | ⋯ |
| 58.65999363 | 26.26945856 | 17.00 | 0.249 | 0.13 | 63.94 | 0.54 | 304 | ⋯ |
| 58.71177661 | 24.06327876 | 16.42 | 0.050 | 0.17 | 83.42 | 0.11 | 291 | ⋯ |
| 58.87438235 | 24.48944040 | 20.26 | 0.647 | 2.11 | 48.46 | 1.90 | 292 | ⋯ |
| 58.92479274 | 22.62798755 | 16.10 | 0.028 | 0.85 | 83.53 | 0.07 | 295 | ⋯ |
| 58.93820123 | 25.26666618 | 17.11 | 0.073 | 0.16 | 50.99 | 0.18 | 303 | ⋯ |
| 58.96314646 | 22.89492339 | 17.70 | 0.189 | 0.60 | 68.37 | 0.48 | 295 | CSS J035551.1+225341b |
| 58.97522679 | 23.06746821 | 19.45 | 0.289 | 0.53 | 46.92 | 0.66 | 293 | CSS J035554.0+230403b |
| 59.03207308 | 22.90516749 | 19.03 | 0.180 | 0.33 | 56.98 | 0.36 | 295 | ⋯ |
| 59.09405239 | 23.18376714 | 18.32 | 0.141 | 0.10 | 54.00 | 0.29 | 293 | ⋯ |
| 59.17446697 | 22.66218246 | 18.07 | 0.192 | 0.18 | 81.20 | 0.44 | 296 | ⋯ |
| 59.19322655 | 23.97335364 | 19.03 | 0.246 | 0.56 | 37.94 | 0.48 | 292 | CSS J035646.3+235824b |
| 59.21960568 | 23.40598291 | 17.21 | 0.039 | 1.74 | 58.04 | 0.09 | 294 | ⋯ |
| 59.22448748 | 23.20549547 | 15.23 | 0.008 | 0.37 | 44.74 | 0.02 | 294 | ⋯ |
| 59.30690890 | 22.94937108 | 17.97 | 0.065 | 0.25 | 41.32 | 0.15 | 296 | ⋯ |
| 59.58672103 | 25.33420027 | 15.96 | 0.022 | 9.98 | 43.22 | 0.08 | 304 | ⋯ |
| 59.60070147 | 26.69279303 | 14.68 | 0.010 | 0.42 | 65.18 | 0.02 | 303 | ⋯ |
| 59.65776395 | 25.70938149 | 16.33 | 0.070 | 0.15 | 107.01 | 0.19 | 304 | ⋯ |
| 59.73946412 | 25.53273386 | 16.99 | 0.080 | 0.21 | 87.24 | 0.18 | 304 | ⋯ |
| 59.75175618 | 26.11063316 | 17.44 | 0.096 | 0.13 | 91.11 | 0.26 | 303 | ⋯ |
| 59.78840316 | 25.15999718 | 15.92 | 0.064 | 0.17 | 81.69 | 0.15 | 305 | ⋯ |
| 60.19923012 | 25.63211714 | 17.71 | 0.110 | 0.16 | 76.53 | 0.27 | 304 | ⋯ |
| 60.28371183 | 24.82612949 | 18.39 | 0.310 | 0.18 | 80.25 | 0.70 | 303 | ⋯ |
| 60.59665635 | 25.75287068 | 16.19 | 0.102 | 0.16 | 112.14 | 0.26 | 304 | ⋯ |
| 60.61352009 | 26.07631206 | 17.53 | 0.168 | 0.20 | 81.21 | 0.40 | 302 | ⋯ |
| 60.62548353 | 25.32855704 | 17.79 | 0.160 | 0.11 | 70.67 | 0.36 | 304 | ⋯ |
| 60.64253195 | 26.26916643 | 17.14 | 0.060 | 0.16 | 64.95 | 0.12 | 302 | ⋯ |
Notes.
aThese are non-members with Prot measured by Hartman et al. (2010). The Prot derived here and in that work agree to better than 1% for all these stars. bKnown RR Lyrae.APPENDIX B: PHASED LIGHT CURVES FOR PLEIADES MEMBERS WITH MEASURED ROTATION PERIDOS
Footnotes
- 9
The 1314 candidate Pleiades members in Appendix C of Lodieu et al. (2012) are mislabeled. This is the complete list of candidate cluster members, not just newly identified members.
- 10
The distance implied by the parallax measurements in the revised Hipparcos catalog disagrees with that measured by Melis et al. (2014) as well as by other authors (e.g., Pinsonneault et al. 2004; Soderblom et al. 2005) at the ≈5σ level according to the formal errors in each study. This distance difference corresponds to a ≈10% systematic uncertainty in the masses we infer, a relatively modest effect in the context of a sample which spans an order of magnitude in mass (0.1 < M < 1.0 M⊙).
