Abstract
Urine testing is a powerful clinical diagnostic tool. The noninvasive collection of samples and wide range of diagnostic targets found in urine makes urinalysis well suited for point-of-care (PoC) monitoring applications. Complete urinalysis testing faces many limitations due to the large quantity of samples processed, the time required for testing, and the labor involved in sample preparation and processing. Development of PoC urinalysis devices with microfluidic technology can enable the detection of infections and monitoring of chronic disease while reducing the demand on testing facilities. In this article, current approaches in clinical urinalysis are reviewed. Emerging sensing and imaging technologies specifically suitable for point-of-care examination of urine samples are discussed with an outlook on the future of point of care urinalysis devices as well as emerging applications enabled by these technologies such as in situ monitoring of Activities of Daily Living (ADL).
Export citation and abstract BibTeX RIS
This is an open access article distributed under the terms of the Creative Commons Attribution 4.0 License (CC BY, http://creativecommons.org/licenses/by/4.0/), which permits unrestricted reuse of the work in any medium, provided the original work is properly cited.
Urine samples are complex and contain many components that are indicative of patient health. Urinalysis is a valuable noninvasive diagnostic tool in patient care, for example, it aids in the diagnosis of various urologic and renal conditions; and it provides evidence of complications in asymptomatic patients.1 Many illnesses, such as sexually transmitted infections (STI's) may be asymptomatic and lead to the development of more serious health problems over time if not properly treated.2
A complete urinalysis includes physical, chemical, and microscopic examination of a urine sample. A physical examination includes visual analysis of the color and odor of the urine, a chemical examination determines the pH and protein/chemical content of the sample, while microscopic examinations focus on the morphology of particles.3 Different tests have been implemented to detect these biomarkers to aid in patient diagnosis. For example, blood cells and casts are indicative of kidney health and can be used to detect acute kidney injury, and to monitor the progression of chronic kidney disease. A full comprehensive review of urinalysis can be found in Strasinger et al.4
In general, a complete urinalysis requires trained technicians to operate on complex instruments in central processing facilities which may hold thousands of samples at a time.5 Many of the microscopy tests are time consuming due to the need to culture and manual examination. Given a large number of the results are negative, this approach requires many resources, labor, and at a high over all system cost. There are challenges with storing and transporting urine samples to testing facilities. Transportation of samples containing test strips can also lead to degradation of targets of interest.6 To mitigate these issues, point-of-care (PoC) devices can be implemented, either at the clinic or for in-home care. Commonly available PoC urinalysis devices include dip strips for pregnancy testing, and urinary tract infections (UTIs). Urinalysis tests are often performed to diagnose symptomatic illnesses or performed on a routine basis. It is difficult to make clinical decisions based on some test results because there can be a large variability in the contents of a 'normal' sample between individuals, and even for a single person over time.7
The capability of processing samples directly at the site of collection would significantly reduce the demand on testing facilities and associated cost, while also reducing the risk of improper storage and transportation. Further development of PoC testing devices would enable the continuous monitoring of an individual patient in order to establish a personalized baseline.8
For example, a common, rapid, and cost-effective test that can be done on site is the dipstick test, which is often employed in cases where urinary tract infections are suspected. Dipsticks are devices coated with reagents that change color in the presence of an analyte, such as nitrite.3 The benefit of such a test is that it only takes a few seconds to change color, giving a preliminary diagnosis in real time. Extensive clinical studies and meta-analyses have been done to determine the diagnostic accuracy of the dipstick test. In general, it has been shown that screening by dipstick alone carries the risk of missing infections and other urinary diseases. Urine dipsticks may give false-negative results in the case of dilute urine samples or samples in which the pathogen does not produce nitrite, such as Enterococcus and Staphylococcus.9 Urinary pH is also tested with a dipstick and is useful for the diagnosis of UTIs, as alkali urine indicates the potential presence of microorganisms breaking down urea. Urinary pH change, however, is not specific to UTIs, but also associated with other conditions.3 In order to get a more specific diagnosis, microscopic examination is employed. As a result, urine dipsticks are not recommended as the sole diagnostic tool nor a PoC test9,10 but combined with other methods of urinalysis in clinical laboratories.11
This review focuses on recently developed point-of-care device technologies that can be applied to urinalysis. It covers the strategies for measuring the contents of urine samples and an outlook on the development of PoC urinalysis devices. We have divided the paper into three distinct sections in order to cover urinalysis from several perspectives. First the assessment of suspended urine sediments using imaging techniques are discussed. Next the assessment of dissolved analytes in urine by chemical analysis methods are covered. Finally, we discuss monitoring daily behaviors associated with urination as useful indicators of health and context for PoC applications. Activities of Daily Living (ADL) such as medication adherence, bathroom frequency and volume can provide additional context to consider when assessing urine samples. Monitoring ADL on a continuous basis becomes possible with the development of PoC devices and is well suited for integration for personalized urinalysis.
Detection of Urine Sediments
Urine sediments can be either organized or unorganized. Organized sediments include cells, casts, bacteria, fungi, parasites and sperm. Unorganized sediments include various types of crystals.12 These sediments all have a characteristic morphology that can be exploited for identification under a microscope. Flow cytometry has been implemented to screen for urine sediments, and eliminate samples negative for the presence of bacteria to reduce the number of urine samples being cultured. To date, microscopy and flow cytometry are being used as benchtop tools in centralized laboratories. A number of techniques have been investigated to produce compact, low-cost PoC sensing devices. As an example, lensless imaging may be integrated with a microfluidic device to achieve a low-cost image based flow cytometer.
Microscopic urinalysis
Through microscopic urinalysis, casts, cells, crystals, parasites, and bacteria can be identified. A list of urine components and sizes is provided in Table I. Optical microscopy allows for direct visualization of the different urinary sediments to produce morphological and movement characteristics for identification. Brightfield microscopy is the most common method of microscopic urinalysis, though other techniques, like phase contrast, dark field and fluorescence are also employed. Normally, to prepare for microscopic urinalysis, a fresh sample of urine is centrifuged to concentrate particulate matter to ensure a higher limit of detection. Samples are then viewed under the microscope, and scored over 10 fields of view (FOV).4 Examined by a trained analyst, these elements can be distinguished from one another. In practice, the quality of these tests strongly depends on the training and experiences of the analyst. In addition, microscopic examination of urine samples is time consuming due to the number of FOVs that must be analyzed for each sample.4 Laboratories may need to analyze thousands of samples a week and the turnaround time per cultured sample is 1–3 days.
Table I. A list of the different components of urine and their sizes, and the subsequent diagnosis if found. Information was derived from Simerville et al.3 For more variations of different components, visit Strasinger et al.4
| Component | Clinical Significance | Size (um) |
|---|---|---|
| Leukocytes (White Blood Cells) | - Normally, men have <2 WBC/HPF (high powered field) and women <5WBC/HPF | 10-12 |
| Erythrocytes (Red Blood Cells) | - >3 RBC/HPF in two of three urine samples suggests hematuria | 6-8 |
| - If RBCs are dysmorphic, patient may have glomerular disease. | ||
| Epithelial cells | - Squamous epithelial cells suggests contamination | 15+ |
| - Transitional epithelial cells is normal | ||
| - Renal tubule cells indicates significant renal pathology | ||
| Casts | - Casts are used to localize disease to a specific location in the genitourinary tract depending on their composition | 15+ |
| - Hyaline casts can be associated with pyelonephritis or chronic renal disease. A full list of casts and associated conditions can be found in Simerville et al. 3 | ||
| Crystals | - Calcium oxalate crystals are normal | 15+ |
| - Uric acid crystals are normal | ||
| - Triple phosphate crystals are associated with UTIs caused by Proteus | ||
| - Cystine crystals are associated with cystinuria | ||
| Bacteriuria | - In asymptomatic females 5 bacteria/HPF (roughly 100,000 colony forming units (CFU) per mL) represents asymptomatic bacteriuria | 1-2 |
| - In symptomatic patients, 100 CFU per mL suggests UTI | ||
| - In males, the presence of bacteria is abnormal and culture should be obtained | ||
| Parasites | - Although less common, parasitic infections can also be detected in the urine. The two most common parasites that give rise to urological disorders are schistosomiasis (1mm length) and Trichomonas vaginalis (10 μm length). Trichomonas vaginalis is estimated to be one of the most common non-viral STIs in the world 123 and often gives rise to renal and lower urinary tract diseases. | 10 μm–1 mm |
| Yeast | - The presence of budding yeast, Candida albicans, can be an indication of a yeast infection. They can be single, budding, or branched based on the severity of the infection. | 5-10 |
Microscopes and specialists qualified to perform microscopic analysis are not commonly found in outpatient clinics or where samples are collected. Instead, samples collected from multiple sites across a region then sent to a centralized clinical microbiological laboratory for processing.13 In order to prevent sample contamination, urine specimens must either be refrigerated or examined within two hours as longer delay times often cause unreliable results.3 Tests for bacteria and parasites often take a few days due to the need for culture, which also requires significant resources for incubation.14 Furthermore, urinalysis tests are also often requested unnecessarily,15 which adds to the demand. For example, in the case of the diagnosis of trichomoniasis, commonly diagnosed through wet mount microscopy, the test must be read within 10 minutes of collection to avoid false results.16 Ideally, optical microscopy would be used to detect the samples but with an improvement in throughput. This would allow for a universal instrument to detect any urinary sediment.
Sample amplification
Generally, urine sediments are easily identifiable through microscopy, with the exception being bacteria. Although visible, bacteria remains difficult to examine microscopically due to their small size and semi-transparent nature. The gold standard for bacterial detection is culture, which requires an 18–30 hour incubation time to visualize growth. This is a time consuming process that has become automated, however, there remains the issue of expending resources in the culturing of negative samples. In urine culture, a urine sample is placed on agar plates for growth and identification of present bacteria. Culture positives are generally those which grow ≥104cfu/ml of one species of bacteria.17 Though effective, this approach is time consuming and of all samples being screened 60–80% are negative.18 Automated culturing, such as the Copan WASPLab (Walk-Away Specimen Processor and smart incubator), has reduced the workload and automated the process, but has not decreased the need for an alternative processing method.
A solution to unnecessary culturing of samples is a screening test prior to culture with a high negative predictive value, ensuring that a sample determined to be negative is truly negative. In an effort to improve the efficacy of urinalysis, several alternative screening methods such as flow cytometry have been developed. These techniques are a preliminary screen that aim to reduce the number of samples cultured, reducing the workload, time, and costs in large laboratories. In addition, negative results are informed earlier which reduces broad spectrum antibiotic prescriptions.19
A PoC device that would enable the rapid detection of bacteria would enable physicians to determine a treatment plan quicker, and decrease the time and cost required for culture. Ideally, this device would be able to determine the concentration of bacteria in the sample in order to facilitate the physician's decision, as different concentrations indicate different treatment plans as well. Davenport et al. reviews new and developing diagnostic technologies specifically for UTIs.11
Flow cytometry
An alternative to microscopy is flow cytometry, where the sample is examined as it is hydrodynamically focused and continuously flowed through a channel. This can be done to reduce the number of samples that go through culture and increase the throughput of manual microscopy.
Non-imaging flow cytometry
Fluorescence and scattering flow cytometry is a method by which cells are optically screened to rapidly determine chemical and physical properties of urinary constituents.20 The urine sample is labeled with fluorescent dyes, which bind to nucleic acids, and sorted to two different chambers: microorganisms and other. This prevents any interference in the analysis. There the hydrodynamically focused samples are illuminated with lasers of appropriate wavelength and the signal of emitted fluorescence and forward- and side-scattered light are examined. Fluorescent signal informs on nucleic acid contents. Forward scatter provides information on particle size, while side scatter dictates surface and internal complexity. Red Blood Cells (RBCs), White Blood Cells (WBCs), squamous epithelial cells, casts, bacteria, yeast-like cells, spermatozoa, and crystals can be individually identified and counted. Stained bacteria are determined as gram positive or negative. The software from the cytometer presents the data as identified particles per field of view or particles per microliter.20
A thorough meta-analysis of the use of flow cytometers as a tool for urinalysis was conducted by Díaz-Gigante et al., where studies using the UF1000i (Sysmex, Hamburg, Germany) as a pre-screening technique for urinalysis were analyzed.13 They show a 28%–60% reduction in the number of processed samples when pre-screened with flow cytometry. Savings of $239-$306 USD per 100 samples have also been reported, indicating the use of a flow cytometer is cost efficient.21 A significant reduction of turnaround time of negative cultures is noted, which leads to a decrease in empirical antibiotic prescription.
Although there are significant benefits to this pre-screening approach, there are certain caveats to this flow cytometry system. The performance of the screening process strongly depends on the cutoff criteria applied to the patients, which is highly dependent on the population being analyzed. Published data recommended adjusting the cutoff values of the screens according to the clinical situation of the patients as well as the type of specimen collection in order to implement fluorescence flow cytometry as an effective screen.13
Image-based flow cytometry
Image-based flow cytometry is a high throughput alternative to microscopy. The Iris iQ200 (Beckman Coulter, Brea, CA) is an FDA approved automated urine microscopy analyzer. In the Iris iQ200, urine samples are hydrodynamically focused between two layers of fluid in order to create a planar flow. Particles in the urine are analyzed as they are imaged by an objective lens and a camera at 500 frames per sample.20,22,23 A neural network algorithm analyzes the images and classifies particles based on shape, size, texture and contrast. Particles are classified into the following categories: RBCs, WBCs, squamous epithelial cells, non-squamous epithelial cells, hyaline casts, non-hyaline casts, bacteria, crystals, yeast, sperm and mucus. Images that contain particles that are not identified to be a part of one of these categories are collected separately and are classified by a trained analyst. The lower limit for particle detection and quantification has been reported to be about 20–30 particles/μl.20 One caveat of the system is that at times, the images may appear out of focus to the analyst, and the image cannot be improved as the sample has already left the flow chamber.
A study analyzing the Iris iQ200 as a urinalysis screen found that the Iris iQ200 results were similar to the result of manual microscopic examination.23 There were, however, uncertain cases (particularly dysmorphic cells, bacteria, yeasts, casts and crystals), in which images had to be reexamined by trained staff. This indicates that manual examination is still necessary in the implementation of this screen, and the software requires further development to be fully automated. With these modifications, similar to the findings for the UF1000i, İnce et al.23 concluded that automated systems would be helpful in terms of time saving and standardization.
POC testing for urine sediments
It is evident that urinalysis is a critical diagnostic tool used in health care, although current techniques tend to be time consuming and expensive. PoC devices, used to test patients in real time outside of a laboratory, has the ability to mitigate these issues. PoC testing for urinalysis has the ability to significantly reduce costs and allow physicians to administer earlier and more appropriate treatments to patients. With PoC testing, there can be a significant reduction in the storage and transportation of the samples to a centralized facility, as it would allow for home testing and pre-screening. A universal test for a variety of pathogens can also reduce the rate of misdiagnosis in situations where clinical presentations are similar to one another. Lensless imaging is a promising technique for PoC urinalysis.
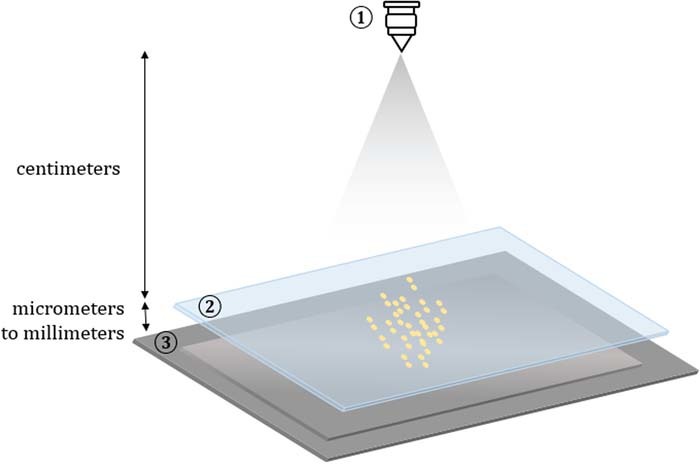
Lensless, or lens-free, microscopy is beginning to take shape as a competitive alternative to traditional microscopy, offering advantages like low-cost, large field of view, 3D reconstruction, and portability. This technique records the image of the specimen on the detector without any intervening lenses (Figure 1).24 This allows for a large field of view, limited by the size of the detector, while maintaining sub-micron resolution. Lensless microscopes are also cost effective, where the most expensive component is an image sensor costing a few dollars, and it allows for portability as there is no precise alignment needed.
Figure 1. Lensless imaging design. A light source (1) illuminates a sample (2) that is placed above the detector (3). The type of light source (coherent/incoherent) and distance from the sensor (far/close) can be adjusted to create a shadow imaging or holographic imaging setup.
By integrating a microfluidic channel in a lensless microscopy setup, an imaging flow cytometer is created, which can screen a large volume over a short period of time. One of the main advantages of using lensless imaging is the adaptability and cost effectiveness allowing these devices to be implemented as point-of-care instruments for community clinics and low-resource areas. It can also eliminate the need to culture every sample that comes through the regional microbiology laboratory by evaluating urine samples immediately after the sample was collected, resulting in a quicker turnover time, reduction in the administration of empirical antibiotics, and a lower operational cost. If a sensitive and specific test can be developed for urinalysis it could replace conventional microscopy tests and simultaneously perform trichomoniasis, candida and bacterial vaginosis testing in addition to UTI testing.
There are three main types of lensless imaging: holographic, shadow, and fluorescence. Benefits of holographic imaging include 3D reconstruction and a flexible sensor-sample distance. Holography also allows for phase recovery of the sample, which may be of benefit to imaging bacteria. Although bacteria are transparent and do not significantly affect the intensity of light that pass through them, the phase of the light is affected.23 Shadow imaging does not require image reconstruction and it is able to attain the same resolution as holographic imaging. Nonetheless, the resolution of shadow imaging is limited by pixel size and sensor-sample distance, which is difficult to attain. For urinalysis, 3D reconstruction is generally not needed; and most of the components can be identifiable by their morphology. Therefore, shadow imaging techniques are attractive options in PoC urinalysis.
Fluorescence imaging of a sample requires either autofluorescence or labeling with a fluorophore. Modern biological research relies on fluorescence microscopy, and as such, lensless modalities have been created as a low-cost alternative.25 In the case of urinalysis, minimal sample preparation is highly desired to reduce cost and turnover time, indicating that fluorescence labeling should be avoided if possible. Analyzing the autofluorescence of urine is possible, however the signal is a highly complex mosaic of overlapping signal from multiple microparticles and metabolites:26 making meaningful analysis very challenging.
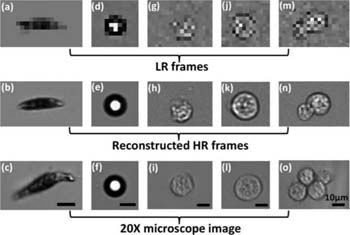
Lensless imaging can also be used together with pixel super-resolution to enhance the resolution of the images. Pixel super-resolution is a technique that uses multiple sub-pixel shifted low-resolution images to create a single high-resolution image. Other techniques create a high-resolution image through a training set of low and high-resolution images. Zheng et al. created a lensless optofluidic device with shadow imaging and pixel super-resolution to image several homogenous samples flowing through the channel (Figure 2).27 In the application of urinalysis, a high resolution is not necessarily critical in order to distinguish between the macroscopic urinary constituents.
Figure 2. Shadow images of Euglena gracilis (a–c), microspheres (d–f), and Entamoeba invadens cysts (g–o). The LR frames (top row) are directly from the device, with reconstructed HR frames below. Brightfield microscopy images taken with 20x objective lens are on the bottom row. Figure and caption derived from Zheng et al.27
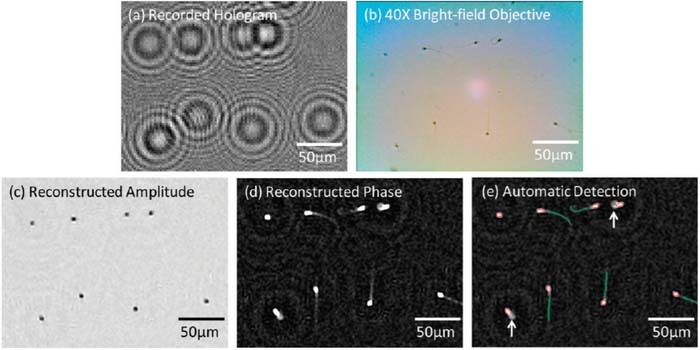
Though a detailed review of the applications of lensless imaging is beyond the scope of this review, a number of devices have been fabricated as an alternative to standardized health care screens. These include blood counting and analysis,28 pap smear analysis,29 sperm motility analysis30 (Figure 3), and so on. It is evident that lensless imaging has a lot of potential for health care monitoring. Applications of many of these techniques can be extended to urinalysis.
Figure 3. (a) Lensfree hologram of an immobilized semen sample (b) A bright-field microscope image of the same FOV as in (a) 40 × objective-lens; NA: 0.65. (c,d) The reconstructed amplitude and phase images from (a). (e) Automatic detection of the sperm. Figure and caption derived from Su et al.30
Recently, Zhang et al. developed a lensless holographic imaging device for the analysis of parasites in cerebrospinal fluid.31 Their device is adaptable to Trichomonas vaginalis detection, though further testing must be done in urine samples. The device uses holographic phase imaging to scan and analyze 3ml of fluid in 20 minutes. The limit of detection was found to be 10 parasites per milliliter of whole blood, and it costs ∼$1850 USD to construct one device. This cost does not include the price of a laptop which is necessary for the short processing time.
Optical microscopic analysis techniques for urinalysis have the potential to detect and analyze different components of urine, thus allowing for a universal testing platform. Flow cytometry is being developed and tested as preliminary screens for urinalysis, and PoC tests have been developed for the diagnosis of trichomoniasis, bacterial vaginosis and vulvovaginal candidiasis. Though there has been progress in this area, rapid and cost-effective diagnosis is not yet routine. Lensless imaging as a PoC device has the potential to reduce the turnaround time for samples, decrease the health care costs, and decrease the workload in labs. Turnaround time is crucial for the comfort and diagnosis of the patient as well as for the overloaded lab, and pre-screening techniques bypass the initial overnight urine culture thereby eliminating the most time consuming step. By filtering out negative samples early from the screening process, unnecessary culturing is avoided, as well as avoiding unnecessary antibiotics. Ideally, this device would be implemented as a point-of-care device in hospital rooms and clinics to reduce the number of samples being sent to the lab, as well as allowing for personalized diagnosis as the clinical situation of the patient is immediately apparent.
Chemical Analysis of Urine
Microscopic methods are mostly used for identifying sediments suspended in urine, while chemical analysis of urine provides opportunities to detect and quantify a wide range of small molecules dissolved in samples. In this section we first discuss test strips as they have been used to measure indicators of infection, physical parameters, and small molecules. Direct measurement of physical parameters are discussed as indicators of sample concentration which is important to consider for quantification. Refractometric methods are optical techniques that can be used to assess specific gravity (SG) and indicators of infection such as cells and proteins. DNA detection techniques and chromatography are also capable of detecting pathogens by genetic markers and bacterial proteins respectively. Several of the target parameters and their indications are summarized in Table II.
Table II. Target parameters of interest in urinalysis testing.
| Target | Indications | Notes |
|---|---|---|
| Proteins | Infection kidney health | Bacterial proteins can be used to identify the organism, and antimicrobial resistances. Protein markers may indicate diabetic nephropathy or cancer.103,105,124 |
| Cells, DNA, RNA | Infection Antimicrobial susceptibility | Presence of bacteria, bacterial DNA and RNA indicates infection. Can be identified to determine antimicrobial susceptibility.11 |
| Leukocyte Esterase | Infection | Indicates presence of WBCs due to infection or arthritis. Can be used to detect prosthetic joint infections.125 |
| Nitrites | Infection | Found due to metabolism of Nitrates by bacteria.126 |
| Osmolality & Specific Gravity | Hydration Status Urolithiasis Kidney Health | Physical measures of the amount of solute in the sample to determine concentration.52,76 |
| Creatinine | Internal Reference Dilution | Produced from degradation of Creatine. Used normalize measurements for dilution adjustment. Clearance may indicate renal disease.120,127,128 |
| Renal Disease | ||
| Glucose | Diabetes | Monitored as indication of Diabetes and progression of disease.129,130 |
| Ketones | Ketonuria Diabetes Starvation | Ketones accumulate due to metabolism of secondary energy sources caused by insufficient insulin. Low insulin indicates diabetes or starvation.120,129 |
| Ammonia | Urolithiasis Infection | Ammonia is produced by metabolism of urease producing bacteria. Low ammonia and acidic urine is common in uric acid stone cases.131–133 |
| Urea | Diet Starvation | Produced by the degradation of protein. Indicates dietary protein intake and starvation.134,135 |
| Phosphates | Infection Kidney health | Phosphate levels in combination with other parameters may be used to determine causes of kidney stone formation.131,133,136 |
| Cholesterol & Lipids | Renal Disease | Elevated levels in nephritic patients.137,138 |
| Drug Metabolites | Medication Adherence Drugs of Abuse Doping | Monitored in urine to determine medication adherence. Can also be used to detect drugs of abuse and doping in sporting events.100,116,120,139 |
Lateral flow assays
The lateral flow assay (LFA) is the most common chemical analysis method and has been extensively reviewed.32–37 Briefly, the LFA uses diffusion to transport the sample to sensing regions along a hydrophillic strip. Target molecules may be detected by the development of a signal at the sensing region. The technique has received significant interest in the field of point of care diagnostics due to the low cost, high specificity, and simplicity of these devices. Test strips have been developed for a wide range of analytes and have been used to detect indicators of infection, bacteria such as trichomonas vaginalis.38 Commonly used commercial lateral flow test strips include the pregnancy test, fertility and ovulation tests, and cancer diagnosis.39 LFA strips are discussed here as Immunochromatographic assays, and reagent based assays. Immumochromatographic test strips rely upon immobilized antibodies to capture and concentrate target biomolecules, where reagent based strips depend on the development of a colorimetric reaction with the target analytes. The diagnostic potential of this method appears to be well established. The more recent developments have generally been in strategies for enhancing the signal from the test strips and in producing portable reagent strip readers.
Immunochromatographic test strips
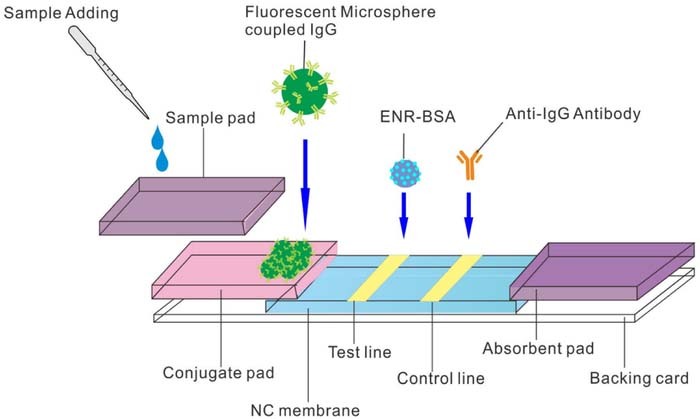
Lateral Flow Immunochromatographic Assay (LFIA) strips are often used for the detection of proteins and hormones. E. Coli and N. gonorrhoeae have been detected by mie scattering as indicator of STI.40 The LFIA method is based on the Enzyme-Linked Immunosorbent Assay (ELISA) which is considered the gold standard in protein detection. The ELISA relies on capture antibodies to concentrate the target molecule and a labeled secondary antibody binds the captured targets.41 The concentration of target molecules is determined by a measurement of the rate of color development, fluorescence generated, or magnetic field depending on the label used. A review of lateral flow assay design is provided by Sajid et al.42 The strip is placed in a sample and the fluid travels up the strip, through a conjugation pad, toward a reaction zone where color develops to indicate the presence of an analyte. The development of a control line indicates the validity of the test.39 An example of an LFIA strip design is presented in Figure 4.
Figure 4. Standard layout of a lateral flow test strip.39 The sample mixes with reagents in the conjugate pad as it travels up the strip. Aggregation of particles at the test and control lines leads to color development.
The lateral flow assay (LFIA) typically uses antibodies deposited in lines along a test strip. The test strip has a higher detection limit compared to the ELISA. A Chemiluminescent LFIA design has been produced for the measurement of serum albumin. Light is generated as a result of a reaction catalyzed by Horseradish Peroxidase (HRP) concentrated at the test and control lines to be detected by a photodiode.43
Various nanomaterials and structures have been actively studied to enhance the sensitivity and specificity of LFA. Fluorescent nano-spheres, quantum dots (QDs) or Upconverting Nanoparticles (UCNPs) can be used as reporters in LFA strips for more sensitive measurement.44 An example of a fluorescence based LFIA strip is shown in Figure 5. Gold nanoparticle labels can be detected on a LFIA strip due to the color change as the gold particles accumulate on a test line, a strategy recently used to detect phenylethanolamine A.45 Magnetic nanoparticles have been used in a competitive lateral flow assay for the detection of drugs such as Cocaine.41 Biosensors employing antibodies to capture human IgG in urine samples have been developed using fluorescence probes.46
Figure 5. Fluorescent probes as reporters in LFIA tests.44
Enzyme Multiplied Immunoassay Technique (EMIT) relies on the use of an antigen linked to an enzyme that competes with the target analyte for binding sites. The enzyme is inactivated by binding and enzyme activity can be monitored as a measure of target concentration.47 Devices are available for the detection of drugs using EMIT.48 Multiplexed lateral flow tests are being developed to improve the utility of portable test strips.49
Urine reagent test strips
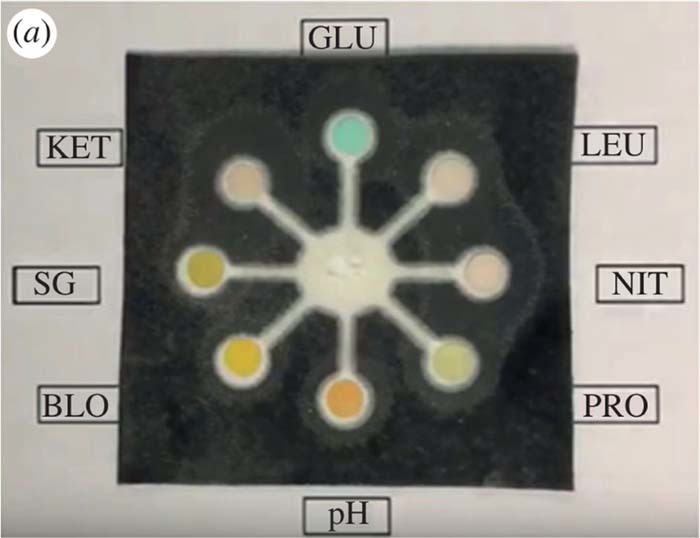
Urine test strips have been developed for a wide range of analytes in urine samples including Specific Gravity, Creatinine, Glucose, Ions, Ketones, Lactate, Nitrite, pH, Protein, and Uric Acid.33,50 Specific gravity reagent strips have been used for some time but have been found to be less reliable than the refractometric methods.51 Urine samples may be compared to a urine color chart to predict the specific gravity.52 SG test strips rely on the development of color by a chemical reaction that is compared to a lookup table.51 The specific gravity test strips can be influenced by pH and may not be appropriate as a measure of osmolality for some conditions.53 pH may play a role in the formation of crystals in saturated urine.54 Interference of test strip results and false negatives may be caused by vitamin C.55,56 An example of a colorimetric urine test strip is shown in Figure 6.
Figure 6. Example of colorimetric urine test pad.50 The sample diffuses radially into various test zones where a colorimetric reaction progresses to quantify targets.
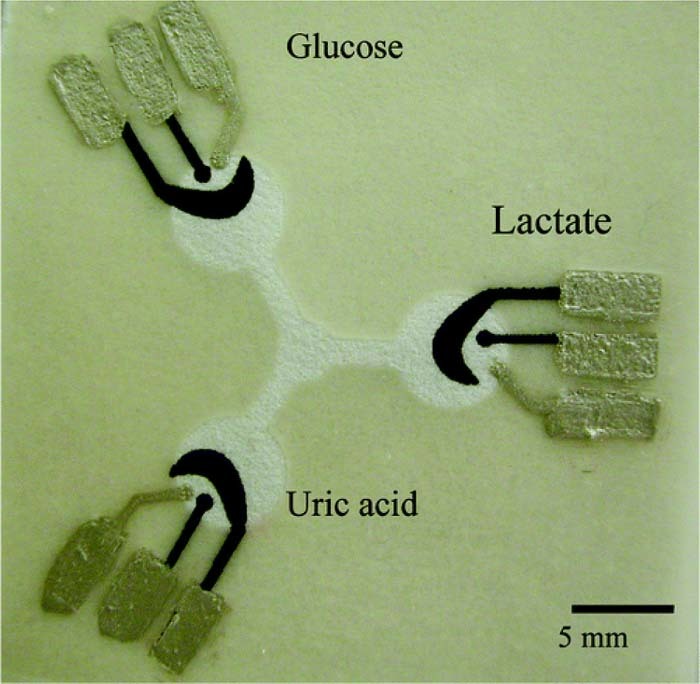
Micro paper based analytical devices (μPADs) employing electrochemical detection have been produced for monitoring Glucose, Lactate, and Uric Acid. Oxidase enzymes immobilized at each of the test zones leads to production of peroxide with the degradation of target molecules. The change in potential can be monitored using cyclic voltammetry.57 μPADs have been developed to directly sense ammonia in urine samples using printed Pt electrodes.58 An electrochemical μPAD has been recently developed to simultaneously measure several channels.59 An example of a paper based electrochemical test strip is shown in Figure 7.
Figure 7. Example of electrochemical detection of paper based analytical devices.57 The sample diffuses radially into the test zones where reactions with target molecules cause changes in electrical potential across electrode pads. Reprinted with permission from (W. Dungchai, O. Chailapakul, and C. S. Henry, Anal. Chem., 81, 5821 (2009)). Copyright (2009) American Chemical Society.
Portable reagent strip readers
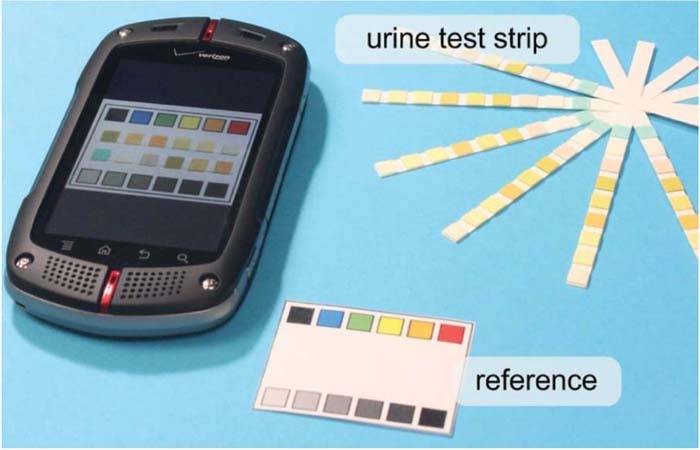
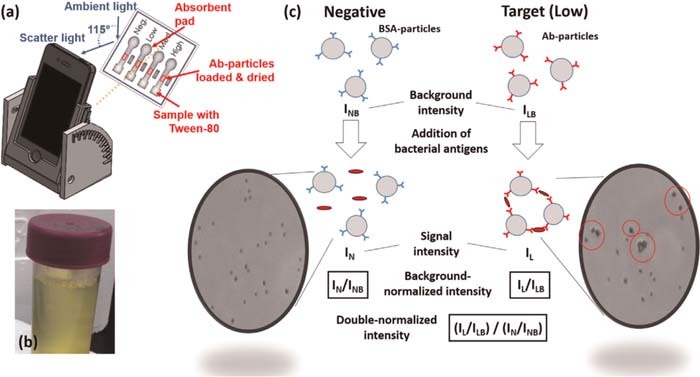
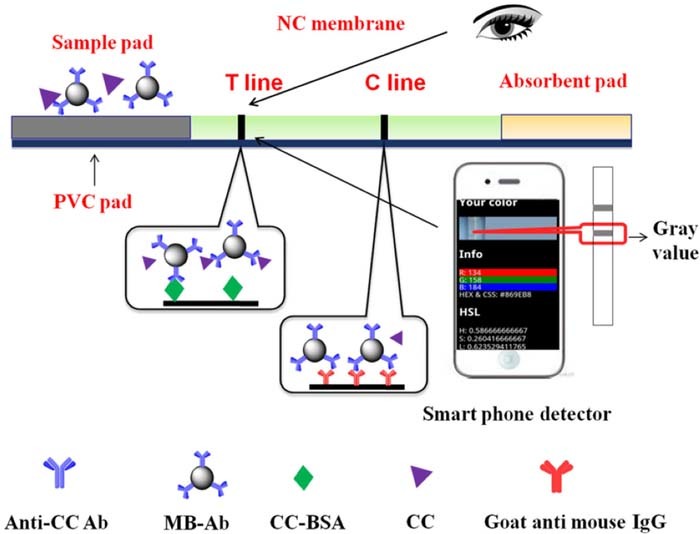
Reagent strip readers are an effective way to objectively assess colorimetric test strips. They can be designed to read fluorescent tags and could work with cell phone cameras making them particularly useful for diagnosis in low resource settings. Rapid improvements in the quality of smartphone cameras and image processing techniques have enabled low cost devices for quantifying colorimetric test strips. Recently there has been significant interest in the development of portable urinalysis reagent strip readers for point of care testing applications.32,50,60–65 An example of a smartphone imaging application of urinary pH test strips is provided in Figure 8. Aggregation of nanoparticles in test regions have been monitored using Mie scattering as shown in Figure 9.
Figure 8. Smartphone analysis of urine test strips.140 Smartphone images of colorimetric test strips are compared against a reference color chart to detect analytes in urine.
Figure 9. Smartphone Mie scattering for bacteria detection.40 Changes in signal intensity due to aggregation of particles in the sample are used to detect target antigens.
Color development of test and control lines due to accumulation of magnetic nanoparticles has been measured using smartphone imaging as shown in Figure 10. The smartphone optical measurement concept can be applied for development of microfluidic devices as well as lateral flow assays.
Figure 10. Magnetic nanoparticle based LFIA sensor with colorimetric detection.41 The aggregation of target antigens is monitored by the development of color and magnetic field.
Physical parameters
Physical measurements of urine samples such as color, specific gravity, and osmolality provide information about the concentration of urine samples and hydration status. Electrical conductivity measurements of urine samples can also be used to predict sample concentration.
Color
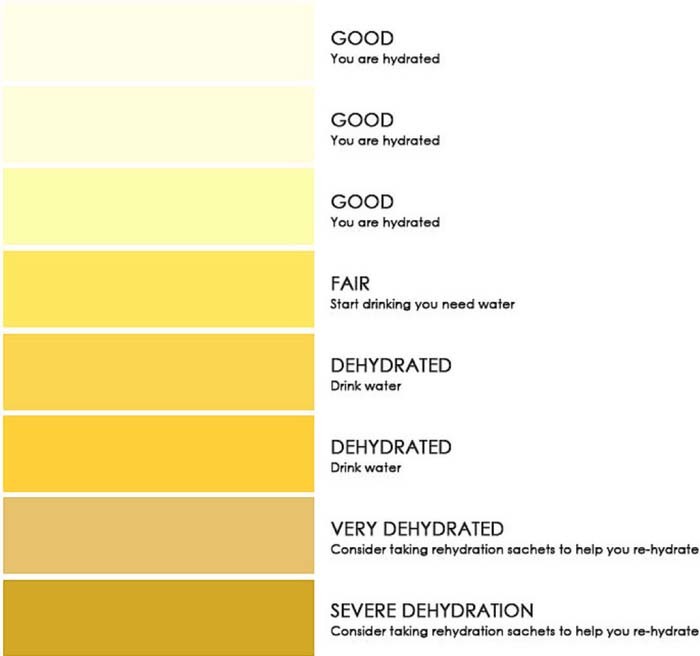
Color of urine samples is related to sedimentation and hydration status. The color is typically measured by comparison to a color chart. There are positive correlations between the color of samples and electrical conductivity.54 The urine color chart is used to classify the sample based on a color scale. Color measurements are interfered with by consumption of certain medications, fruits, vegetables, and vitamins.52 An example color chart is provided in Figure 11.
Figure 11. Example of a urine color chart for hydration assessment.141
Hydrometers and osmometers
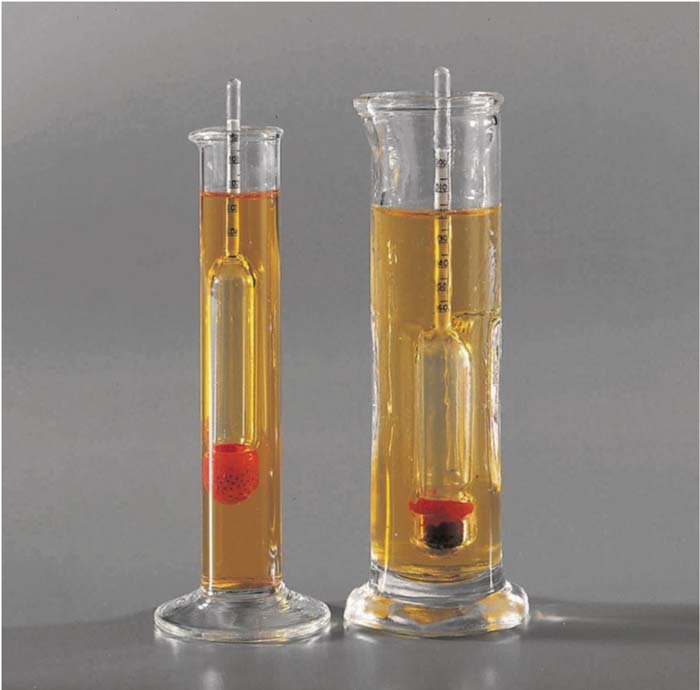
Hydrometers rely on the buoyancy of a floating scale to determine the specific gravity of the fluid. Hydrometers are traditionally relied upon, but require a reasonable sample size and are not suitable for continuous point of care application. The result obtained from a hydrometer is subject to error depending on the judgement of the user.66 Osmometers are commonly used to directly measure the osmolarity of urine samples but they are typically large and expensive and are restricted to lab testing rather than remote measurements.52 An example of a hydrometer measurement is provided in Figure 12.
Figure 12. Example of hydrometer for urine specific gravity assessment.142
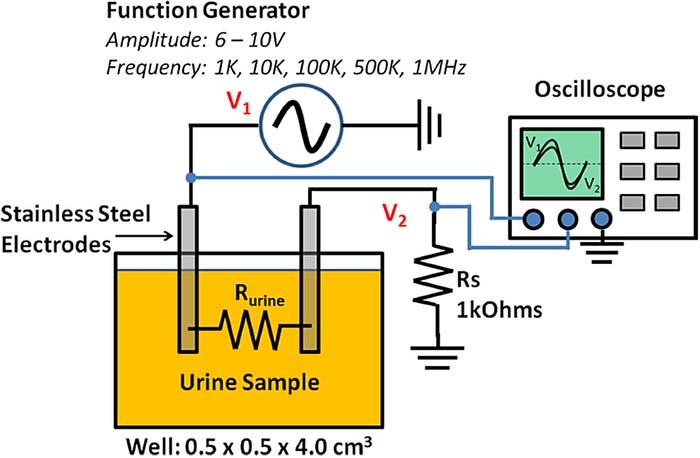
Figure 13. Example of urine multi-frequency electrical conductivity measurement.54
Electrical conductivity
Electrical conductivity of urine samples is measured to predict the development of kidney stones. Conductivity has been shown to positively correlate with SG, and color as indicators of sedimentation.54 Electrical conductivity also correlates with osmolality.67 Impedimetric sensors have also been developed for E.Coli in urine samples. The sensor is incubated with the urine sample and changes in the conductivity over time are indicative of bacterial growth and the formation of biofilm.68 An example of multi-frequency electrical conductivity measurement of urine samples is provided in Figure 13.
Modification of electrode surfaces has led to the production of electrochemical sensors for several analytes in urine. Modified glassy carbon electrodes have been used to detect UA in urine with high specificity.69,70 Ionic liquid modified carbon paste electrodes with ZnO nanoparticles have been used to simultaneously detect the drugs Analgine and Camylofin.71 Multiwalled carbon nanotube (MWCNT) structures with Zinc nanoparticles have been used for the simultaneous detection of two antidepressant drugs.72 MWCNTs are also being developed for the simultaneous detection targets with overlapping electrochemical oxidation peaks.73 Functionalized carbon black and Nickel Sulfide have been used to detect Glucose in a non-enzymatic sensor.74 Nickel Bromide nanoparticles have also been used for non-enzymatic Glucose detection.75
Refractometric methods
The refractive index of fluids change with the concentration of dissolved components such as salts. Refractometers, fiber optic sensors, and photonic crystals76,77 can be used to monitor specific gravity to assess hydration. Refractometric methods demonstrate the best linear relationship with osmolality.78,79
Refractometric methods for detection of acute dehydration
The refractometer measures the refraction of light as it encounters an interface of different refractive index between the waveguide material and the sample. The refractive index of the sample is influenced by the concentrations of solutes including salts, glucose, protein, and creatinine. Simple manual and digital refractometers are available for measurement of urine specific gravity.53,78
Surface plasmon resonance
Recently surface plasmon resonance (SPR) sensors have been employed for osmolality measurement in urine samples.80 SPR methods have been developed as sensitive biosensors for fluid samples and are integrated into microfluidic devices. These devices employ prism coupling, grating based, and fiber optic based sensing mechanisms.81 Excitation light is injected and Surface plasmons are generated at the interface of the dielectric material (sample) and a metal (coated coupling element) by optical excitation. An absorbance peak indicates the region where energy is transferred to generation of SPR which is dependent on the refractive index of the sample acting as the dielectric layer.80,82 The metal coating may be left bare to measure the average RI of the sample, or the coating may be functionalized with antibodies to target a particular molecule. As target molecules bind the antibodies, there is a local change in the refractive index which can be detected as a change in transmission efficiency through the sensor. The SPR sensor and biosensor mechanisms are presented in Figure 14.
Figure 14. Example of SPR sensing mechanism.81 Analytes binding the sensor surface results in a change of refractive index that is measured to determine concentration of targets.
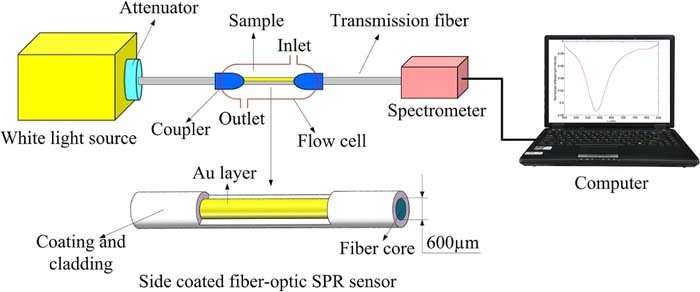
SPR is well suited for integration into microfluidic devices and may be a powerful detection method for point of care diagnostic devices. Fiber optic SPR sensors could be of interest for sampling from directly inside the toilet at the point of care. Light is directly injected into the fiber and detected from opposing ends of the fiber. These SPR sensors employ a sensing region made of de-clad fiber, coated in a thin metal layer. The shift in the peak wavelength coupled to SPR generation is monitored as an indication of SG using a spectrometer.80 An example of a fiber based SPR sensor for urine SG is presented in Figure 15. Smartphone based imaging devices are being developed for PoC measurement of plasmonic sensors, and colorimetric sensors.83,84
Figure 15. Example of fiber based SPR sensor for urine Specific Gravity.80 Changes of refractive index by SG in the sample are monitored by the peak wavelength coupled to SPR.
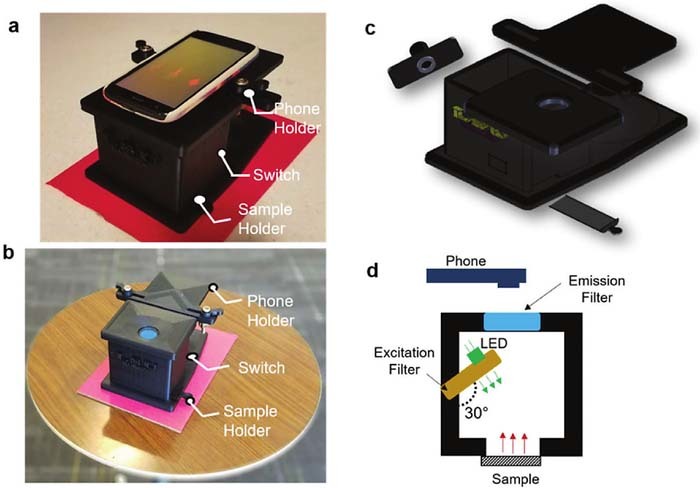
Figure 16. Example of portable smartphone reader for fluorescence paper based DNA microarray.143 An LED is used to excite a fluorescent DNA microarray sample. A smartphone camera images the microarray through an emission filter to measure the sample.
Nanoplasmonic microarrays have been developed to detect the presence of bacteria based on surface plasmonics. A gold substrate with a nanohole array is placed above a CCD detector. The transmission spectrum of the nanohole array is sensitive to changes in the refractive index near the gold surface. The surface of the gold array is functionalized with detection spots of capture antibodies. The sensor is illuminated with a broadband source and the transmitted light is detected by the CCD. When target cells bind to the antibodies the change in refractive index is captured as a wavelength shift in the transmission spectrum detected by the CCD. This is a very new and promising technique enabling multiplexed and label free detection of infections in near real time.85
DNA and RNA detection
Polymerase Chain Reaction (PCR) is a popular method for amplification and detection of DNA used for the detection and identification of bacteria based on their characteristic genetic features. Several methods have been developed based on the traditional PCR process.86 Traditional PCR is a cyclical process that involves the denaturation of double stranded DNA (dsDNA), annealing of DNA primers, and subsequent amplification. The process is conducted in a thermocycler in order to denature the dsDNA to facilitate primer binding and amplification. Traditional PCR was typically used to amplify any target DNA of interest before detection using electrophoretic methods.86
Quantitative Real-time PCR (qRT-PCR) methods can be used to indicate the concentration of target DNA present after multiple cycles. The reaction tube is measured after each cycle so target pathogens can be quantified based on the number of cycles required to produce a detectable concentration of DNA molecules. Primers are selected to amplify target segments of DNA and can be designed specifically in order to detect the presence and speciation of bacteria.87 The nucleotides provided for the amplification are labeled with fluorescent reporter.88 RNA transcripts generated by expressed bacterial DNA may also be monitored using PCR processes. Reverse transcription PCR is used to generate a complementary DNA strand from RNA present in the sample. The concentration of DNA is then monitored as a change in fluorescence signal at the end of each reaction cycle.89
Isothermic PCR reactions are being developed that can be conducted at a constant temperature to avoid the need of thermocyclers, leading to cost reductions.90 Recombinase Polymerase Amplification (RPA) is an isothermic method that forms a complex of recombinase and primer.91 The primer recombinase complex binds the target DNA and causes the strands to dissociate at the primer. Single strand binding proteins adhere to the single stranded DNA. The DNA polymerase then displaces the recombinase and replicates the DNA.90 The isothermic methods such as RPA are well suited for integration with microfluidic devices due to the simplicity of the method and instrumentation required. Loop Mediated Isothermal Amplification (LAMP) is another effective technique for detection of bacterial and viral DNA.92,93 Isothermic amplification methods may be used in the detection of hepatitis C. The use of LAMP in future portable diagnostic tests may not be as promising as alternative methods such as RPA due to the complex primer design required for LAMP processes.90
DNA microarrays – DNA and RNA level detection
DNA microarrays may be used to establish the presence of target DNA sequences. Microfluidic DNA microarrays with fluorescence detection enable the simultaneous detection of bacteria species. It is also possible to differentiate between pathogenic and non-pathogenic strains of similar bacteria.94 DNA microchips have been developed for the detection of sexually transmitted infections such as human papillomavirus (HPV).95 Bladder cancer (BC) may also be detected by the presence of tumor cells in urine sediment which are characterized by high degrees of DNA methylation.96 Monitoring BC is possible using DNA microarrays targeting mRNA by the real time PCR method.97
Several single stranded DNA probes are bound to the bottom of a reaction chamber in spots such that each spot is specific to a unique DNA sequence. Sample DNA is mixed and if a complementary strand of ssDNA is present in the sample it will hybridize with the DNA probe.86,87 Fluorescently labeled target DNA has been detected as a change in fluorescence intensity in the hybridization regions with DNA probes in a paper-based microarray.98 DNA microarrays provide an opportunity for improving the throughput and simultaneous detection of DNA markers in urine.86 This is particularly useful for detection of pathogens that are difficult to culture and to determine variants of detected species.99 Probes may also be used to detect single nucleotide polymorphisms in bacterial DNA to detect variants.100 An example of a smartphone based detection system for a fluorescence based DNA microarray is presented in Figure 16.
Chromatography
Chromatographic methods such as High performance liquid chromatography (HPLC) and Micelar Liquid Chromatography (MLC)101 are effective at separating samples based on different affinities between mobile and stationary phase. The sample is analyzed based on the retention time of contents. The sample fractions may then be investigated further using alternative methods such as Mass Spectroscopy (MS). These methods are difficult to employ as point of care diagnostic methods due to the required solvents, and expensive separation columns, pumps, and detectors involved.
Matrix Assisted Laser Desorption/Ionization - Time of Flight – Mass Spectrometry (MALDI-TOF-MS) is used to measure the charge to mass ratio of ionized fragments of analytes.102 It is well suited to analysis of macromolecules such as proteins. In clinical applications it has been used to identify bacteria in urine samples103 and to determine antimicrobial resistance. Chromatograhic methods in combination with TOF-MS have been used to demonstrate that changes in urine metabolome may indicate the reappearance of tumors in BC patients.104 First the samples are mixed and dried to produce a crystalized matrix. Next a pulsed laser is used to desorb and ionize the sample components. The particles are separated by their relative velocity as they are accelerated through an electromagnetic field to a time of flight detector. The particle velocity depends on the charge and mass of the particle.102
Although it has been suggested that MALDI-MS methods could be useful in daily practice105 there are still limitations to be overcome in order to further apply MALDI-TOF-MS in point of care urinalysis applications. The results are more reliable for the detection of Gram-negative bacteria than for the detection of Gram positive bacteria and Yeasts.106 Matrix effects must be considered where sample constituents that are not of interest may influence the efficiency of ionization of components of interest. There is an isobaric effect where components with the same mass to charge ratio are detected simultaneously. The technique still requires expensive detectors and could benefit from miniaturization and cost reduction.103 New techniques are being developed in order to reduce the incubation time required in order to directly analyze urine samples.107
Urinalysis in the Context of Activities of Daily Living
ADL refers to the behaviors, tasks, and routines adhered to on a daily basis. Monitoring ADL on a continuing basis can be used to provide additional context to be considered when analyzing samples. In the conventional urinalysis setting, sample analysis provides information about the sample contents but does not offer information about frequency or volume of urination. This is an emerging application area of urine analysis technologies enabled by the recent advances of PoC urinalysis technologies that allow continuous multi-parameter measurements of urine in a home setting. Several of the ADL parameters of interest associated with urination are presented in Table III.
Table III. Activities of Daily Living associated with urination.
| Activities of Daily Living | Indications | Notes |
|---|---|---|
| Bathroom Frequency | Chronic Disease Monitoring Nocturia Assessment of Diuretics | Bathroom frequency, and times of use can indicate developing challenges.109,111 Medication adherence and response to treatment.117,118 |
| Uroflowmetry | Volume and flow rate of urination Renal health | Changes in volume and flow rate may indicate kidney injury.113 Change in weight indicates the volume of urine.114 |
| Medication Adherence Monitoring | Adherence to Medication Schedules Context of urine test results | Assist in optimizing medication schedules.117 |
Bathroom frequency
Frequent use of the bathroom at night known as nocturia can be monitored.108–110 Nocturia is a common symptom experienced by older adults and negatively impacts sleep quality. The more frequent need to urinate can be caused by an increase in urine production due to disease, or as a side effect of diuretic medications.111,112 Reduced bladder capacity caused by the formation of kidney stones may also cause nocturia.110
Several strategies have been suggested for monitoring the frequency and timing of bathroom use. These generally involve mechanisms for determining when the bathroom is in use, and in identifying the occupant of the washroom. Indoor positioning strategies such as Radio Frequency Idendification (RFID) tracking have been used that rely on a wearable tag to identify the occupant of the bathroom.108 Ultrasonic range finders have been used to identify the occupant by measuring their height as they enter the bathroom.112 Ultrasonic flow meters have been employed to track when water starts flowing to refill the toilet bowl as an indicator of bathroom use.108 Electrodes placed inside of the toilet can be used to measure the change in conductivity of the toilet water during a urination event to indicate use.112
Uroflowmetry
Uroflowmetry involves the measurement of urine volume, duration, and flow rate. The volume of urine samples can be monitored each time the bathroom is used to establish a daily urine volume. Changes in the volume of urine over time may indicate the development of kidney injuries.
Urine volume has been predicted by the change in weight of an individual before and after they use the toilet. The weight measurements may be conducted by special scales upon which the toilet is installed, or by weight sensors built into the toilet seat.113 Electrodes can be installed in the toilet bowl to monitor urine volume and average flow rate using fluid models considering the shape and volume of the toilet, and has been shown to correlate with changes in weight to predict volume.114 Recent preliminary work has demonstrated an array of sensors mounted under the toilet seat have been used to monitor changes in the temperature of water falling into a toilet bowl as an indication of sample volume using thermal models.115 An optical detection strategy has also been demonstrated to predict sample volume by measuring the change in height of fluid in a special fill container. This technique was not integrated with a smart toilet.116
Medication compliance
Drug metabolites may be detected in the urine for several applications. Medication compliance is known to be low and strategies are being developed to monitor and improve adherence to medication schedules. Consequences of non-compliance may lead to preventable medication related hospitalization which comes at a cost of patient comfort and cost to the medical system.117,118 There are several situations that lead to patients failing to take their prescribed medications which may lead to the development of health issues. Patients may feel that they do not need a medication any longer or they may simply get confused and fail to take their medication at the appropriate time.119 Detection of drugs in urine samples is also used to detect doping for athletic events and the use of drugs of abuse.120
Strategies for medication compliance monitoring have focused on determining when medications are removed from their containers and to identify which individual removed the medication. Drugs can be detected in urine to monitor drug abuse as well as to monitor drug metabolites to assist in dose control of medication.121 Typically drug detection relies on chromatographic methods like HPLC, and liquid chromatography with tandem mass spectroscopy (LC-MS).122 Microchip electrophoresis followed by UV or electrochemical detection have also been used.121
Discussion and Future Outlook
The current challenges facing urinalysis may be overcome with the development of high throughput integrated sensing systems, and Point of Care devices for personalized medicine. Measurements right at the site of collection reduces the need for sample storage and transportation for testing and may provide more reliable results for patients sending samples far from testing facilities. The results may be available shortly after sample collection enabling more rapid response to results. Additionally, samples may be screened at the site of collection to determine if a more detailed analysis is required to reduce the number of samples sent to testing facilities, reducing the demand and cost of urinalysis testing. By screening for infections and monitoring chronic diseases before they become symptomatic the demand on testing labs may be reduced and potential for early intervention may be improved. The contents of urine samples are highly variable, between individuals and for a given individual over time. Remotely monitoring contents of urine samples over time provides an opportunity to establish normal baselines for individual users. Trends in results over time may be used to identify the development of health challenges before symptoms appear. Integration of new functional components in microfluidic devices such as pumps, mixers, valves, filters may be used to enable automated sample handling, processing, analysis, and disposal, in order to overcome the need for trained technicians to perform analysis. Additionally, many studies focus on validating methods on healthy subjects. Work should be done to investigate the reliability of these methods on subjects with health issues, and to identify behaviors that influence test results.
Continuing development of microfluidic detection methods for the analysis of urine will lead to reliable sensing modules for many diagnostic indicators. Many of these sensing modules may be integrated in a single device to allow for the simultaneous detection of several analytes. The development of new microfluidic microscopies and lensless imaging techniques provide an opportunity to dramatically reduce the size and cost of microscopic examination of samples. High throughput microfluidic microscopy has the potential to detect infections with low concentrations of bacteria without long incubation times, significantly reducing the time for test results.
Point of Care diagnostic devices may be developed that are capable of continuously monitoring urine samples on an ongoing basis, enabling the early detection of diseases and the monitoring of chronic disease. These monitoring devices may be portable units to be deployed, or permanently installed in the home such as smart toilets. Several parameters can be measured from the toilet itself such as the frequency of toilet use, and Uroflowmetry when using the toilet which may provide an indication of a patient's response to medications such as diuretics.
Most of the new PoC urinalysis devices are based on reagent strip readers. The reagent strip design has inspired several chip-based sensors employing a wide range of detection methods. It is not recommended that we should simply develop more test strips to cover a wider range of analytes or concentrations due to the complex nature of the sample and the interactions between different components. Making a device that incorporates redundancy by measuring several parameters using independent methods may provide more reliable information about sample contents. Not all of the methods used in urinalysis testing needs to be translated to microfluidic devices. There are several methods that can be used to detect the presence of bacterial infection. More extensive testing can be performed in lab settings to identify the infecting organism and to determine the effective antibiotic treatment for the infection.
As the methods used to perform urinalysis continue to translate to portable PoC monitoring devices results can be obtained directly from the site of collection, rapidly, and on a continuing basis. The integration of urinalysis devices into smart toilets also allows monitoring of the frequency of urination and volume of urine. This provides an opportunity to detect developing illnesses at an early stage, as well as to monitor ongoing chronic illnesses and response to treatment. The personalized urinalysis may be used to reduce the number of samples sent to large testing facilities to save time and cost by prescreening samples. With the development of lensless imaging devices automated point of care microscopy may also be conducted on urine samples for direct detection of sediment and infectious particles. These sensing strategies may also be applied to alternative remote fluid monitoring applications such as analysis of saliva, environmental water quality monitoring, and process control.
Acknowledgments
This project is supported in part by the Natural Science and Engineering Research Council (NSERC) of Canada, Canadian Institutes of Health Research (CIHR), and the Ontario Research Fund-Research Excellence (ORF-RE), the Canadian Foundation of Innovation (CFI), the ORF-Research Infrastructure (ORF-RI), and an Interdisciplinary Research grant by McMaster University. EM was supported by the Ontario Graduate Scholarship and the McMaster Faculty of Engineering through a Dean's Excellence PhD scholarship. JK acknowledges the support from McMaster Engineering through a graduate innovation fellowship. QF held the Canada Research Chair in Biophotonics.
ORCID
Qiyin Fang 0000-0003-2786-9884
