Abstract
We combine Landsat and MODIS data in a land model to assess the impact of urbanization on US surface climate. For cities built within forests, daytime urban land surface temperature (LST) is much higher than that of vegetated lands. For example, in Washington DC and Atlanta, daytime mean temperature differences between impervious and vegetated lands reach 3.3 and 2.0 °C, respectively. Conversely, for cities built within arid lands, such as Phoenix, urban areas are 2.2 °C cooler than surrounding shrubs. We find that the choice and amount of tree species in urban settings play a commanding role in modulating cities' LST. At continental and monthly scales, impervious surfaces are 1.9 °C ± 0.6 °C warmer than surroundings during summer and expel 12% of incoming precipitation as surface runoff compared to 3.2% over vegetation. We also show that the carbon lost to urbanization represents 1.8% of the continental total, a striking number considering urbanization occupies only 1.1% of the US land. With a small areal extent, urbanization has significant effects on surface energy, water and carbon budgets and reveals an uneven impact on surface climate that should inform upon policy options for improving urban growth including heat mitigation and carbon sequestration.
Export citation and abstract BibTeX RIS
Content from this work may be used under the terms of the Creative Commons Attribution 3.0 licence. Any further distribution of this work must maintain attribution to the author(s) and the title of the work, journal citation and DOI.
1. Introduction
Viewed from the perspective of the amount of space it currently occupies, urbanization appears as a minor form of land transformation. However, in terms of ecological impact it is one of the most significant and long lasting forms of land transformation and its extent of increase is at least proportional to population growth and economic development (Shepherd et al 2013). The cumulative signature of this anthropogenic land cover (LC) disturbance is reaching higher proportions in some regions of the world and may already be playing a role in local and regional scale biological, hydrological, energetic and socio-economic activities (e.g., Güneralp and Seto 2013, Mahmood et al 2014, McDonald et al 2014). Given these seemingly conflicting attributes of small area but high ecological impact of urbanization and its expected increase, it is important to assess its rate of change and its impacts on the biological, hydrological and energy cycles for the continental USA.
Urbanization affects its environment through several distinct but coupled mechanisms: the first and most significant impact is expressed by the reduction of the fraction of vegetation (e.g., Bounoua et al 2009, Qureshi et al 2010) and the subsequent inhibition of photosynthetic activity and plant's water transpiration and interception losses. The second impact comes from the introduction in the landscape of an impervious surface (IS) which alters the partitioning of surface runoff and water infiltration into the ground, and modifies the soil moisture content and water table. The third impact results from changes in surface albedo (e.g., Akbari 2002) and its effect on the surface energy partitioning; while the fourth impact is associated with a modification of the surface roughness and its implication for the surface turbulent fluxes and diffusion of heat (e.g., Zhao et al 2014, Oke 1988).
Urbanization is often concentrated to specific areas within landscape and forms heterogeneous patches with respect to surface radiation and other elements of the energy, water and carbon budgets. Therefore it needs to be studied at spatial and temporal scales fine enough to capture the responses of different LC elements existing within and immediately surrounding the build-up. At the local scale, case studies have illustrated its effects on surface temperature and hydrology (Shepherd 2006, Bounoua et al 2009, Sajjad et al 2009). Over larger scales however, little (e.g.; Oleson et al 2013) has been done to quantify its aggregate impact due in part to lack of LC data at space and time scales appropriate for resolving the urban metabolism within larger scale climate. Landsat data have a fine spatial resolution (30 m) from which impervious surface area (ISA) can be estimated at continental scale and, combined with the Moderate Resolution Imaging Spectroradiometer (MODIS) products to describe the phenology of the surrounding vegetated lands, provide a unique characterization of the urban environment.
While most previous studies evaluating the urban heat island (UHI) at the US continental scale have consisted of static, remote sensing-based analysis of the UHI amplitude (e.g., Imhoff et al 2010, Zhang et al 2010), in this paper we use a fusion of Landsat and MODIS data in the Simple Biosphere model (SiB2) of Sellers et al (1996a) as modified by Bounoua et al (2009) to describe the UHI and its amplitude and evolution at different time and space scales. Specifically, we use the Landsat-based ISA from the National Land Cover Dataset (NLCD) (Homer et al 2004) to characterize the urban areas at 30 m × 30 m spatial resolution, and MODIS-based biophysical products at 500 m × 500 m spatial resolution and 8-day time-interval to describe the vegetation phenology within a climate modeling grid (CMG) of 0.05° × 0.05° of latitude–longitude (approximately 5 km × 5 km) over the continental United States (CONUS) to simulate the impact of urbanization as a form of land use on the surface energy, carbon and water cycles for 2001.
2. Method
Landsat-based ISA from the NLCD was used to characterize urban LC at 30 m spatial resolution over the CONUS for 2001 (Homer et al 2004). The ISA data was combined with MODIS LC at 500 m spatial resolution and then aggregated into a 5 km × 5 km CMG. This data fusion considers ISA as a reliable product to characterize the build-up and was implemented as follows: (1) we co-registered the Landsat data to the CMG and aggregated the ISA from 30 m to 5 km × 5 km resolution, (2) we aggregated the different cover types from the 500m MODIS LC map (MCD12Q1) and obtained fractions in the CMG, (3) we then imposed the aggregated ISA fractions into the CMG in lieu of the MODIS build-up. When imposing Landsat-based ISA into the CMG, differences between ISA fractions and MODIS build-up fractions were proportionally distributed over other non-impervious LC types co-existing in the CMG. The distribution was weighted by fractions of LC types existing in the CMG. Each CMG may have up to 12 LC classes with their fractions within the CMG obtained from higher resolution Landsat and MODIS data (Bounoua et al 2015). For each LC class in the CMG a set of biophysical parameters was generated at the same resolution using the 8-day composite 500m gap-filled North American Carbon Program MODIS normalized difference vegetation index (Tan et al 2011, Bounoua et al 2015). Along with other vegetation physiological, optical and morphological parameters, these biophysical parameters served as surface boundary conditions to SiB2. Urban IS is characterized with a heat absorption function represented by an average heat capacity of a thin concrete slab modulated by diurnally varying sun angle, and augmented by the heat capacity of water and snow on the ground.
The SiB2 model is driven by external meteorological data in an offline mode over the CONUS. The initialization is done iteratively using the fraction of photosynthetically active radiation based on the logic that vegetation density is in quasi-equilibrium with climate and the amount of soil water (Stefanova 2001). The model was spun up for 5 years forced by hourly meteorological data at 5 km × 5 km obtained from the North American Land Data Assimilation System NLDAS-2, interpolated using a Lagrangian interpolation in time from hourly to half-hourly and a bi-linear interpolation in space from 0.125° × 0.125° to 0.05° × 0.05° grid spacing. The model was integrated independently for each of the twelve LC classes and outputs from different integrations are stratified by LC, as well as a weighted average obtained as a response from each LC weighted by its fraction within the CMG. The simulations differ in their LC types, morphological, optical and physiological attributes, and the associated vegetation phenological parameters derived from MODIS. Each simulation was integrated forward another 3 years after spin up using the same atmospheric drivers so that model responses are exclusively attributable to changes in LC. The simulations do not account for feedback to the atmosphere and therefore allows us to isolate the effects of landscape differences on local to continental scale near-surface climate conditions. In this analysis, we present results from model outputs averaged over the last three years of model integration.
3. Results and discussion
Hourly outputs were saved, for an a priori selection of 90 CMGs and for the entire year; 24 of these CMGs are within cities selected to spatially represent major ecoregions of the CONUS and have the highest ISA fraction. CMGs belonging to the same ecoregion exhibited a similar surface temperature diurnal evolution with some variations in the maximum temperature. We therefore limited our discussion on the surface temperature to 10 cities. In this study we report about the surface urban heat island (SUHI) defined as difference in land surface temperature (LST) between the ISA and the vegetated land surrounding it, which is different from the classical UHI based on air temperature. Summer mean LST diurnal cycles are shown for select CMGs in US cities. Each CMG contains multiple LC types; however, only three temperature profiles are displayed: (1) the IS class, (2) the vegetation class with the highest fraction, and (3) the weighted average from vegetation classes only (excluding urban).
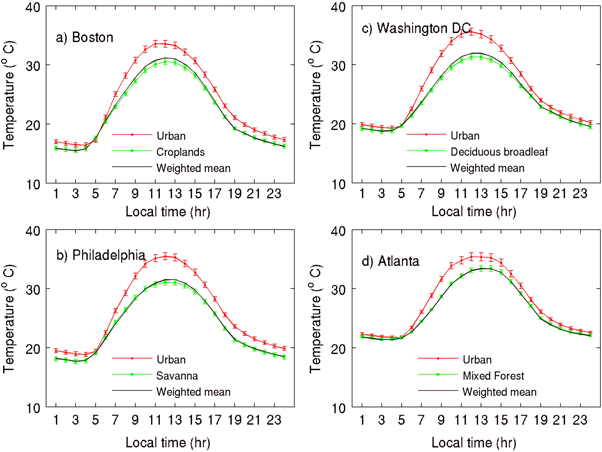
For the Eastern US cities (figure 1), the urban daytime mean LST is much higher than that of the vegetated class, with differences reaching 2.0 °C in Atlanta and 3.3 °C in Washington DC For these cities, the absolute maximum temperature differences between urban and vegetated lands are 3.1 and 4.5 °C, respectively and occur in the morning (11:00 AM) when the urban class warms faster than vegetation. For all cities, the vegetation's temperature presents a noticeable diurnal asymmetry during afternoons when solar radiation is maximal. Vegetation temperature is largely determined by local weather; however the extent of its diurnal variation is modulated by the plant's physiological activity. To regulate the capture of CO2 from the atmosphere and the simultaneous diffusion of water from the leaf interior, plants close their stomata during high irradiance, shunting most of the absorbed energy into sensible heating, thus increasing vegetation temperature during afternoons as compared to mornings. For example, in Atlanta GA, this asymmetry is characterized by an LST difference between the impervious and vegetated LC of 3.0 °C at 9:00 AM (ΔTam) and 1.6 °C at 3:00 PM (ΔTpm). The difference between ΔTam and ΔTpm is attenuated as surface temperature decreases with latitude. Indeed, in Boston ΔTam is 2.9 °C and ΔTpm is 2.0 °C (figure 1).
Figure 1. Summer (June, July and August) mean land surface (skin) temperature diurnal cycle for the urban class, the vegetation class with the highest fraction, and the weighted average temperature of all vegetation classes (excluding urban) co-existing within the climate modeling grid for (a) Boston, (b) Philadelphia, (c) Washington DC, and (d) Atlanta.
Download figure:
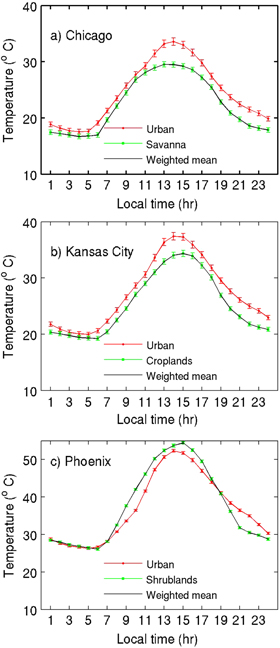
Standard image High-resolution imageThe composition and vegetation fractional coverage within landscapes play an important role in the city's energy budget. In Washington DC, composed of approximately 52% IS, 24% broadleaf deciduous (BD) and 24% mixed forest (MF), the daytime mean surface temperature difference between impervious and forested areas varies between 2.4 °C for the MF to 3.3 °C for the BD. This result, partly due to the fact that BD trees are more heat tolerant than the MF, suggests that the choice of a mix of trees within an urban composition is an important ecosystem service in the regulation of surface temperature and the SUHI mitigation. Our results also indicate that nighttime temperature differences between IS and surrounding vegetation is larger for those parts of cities built within short (savanna-type and cropland) vegetation such as the points in Boston MA and Philadelphia PA (figures 1(a) and (b)) than those built within tall trees such as Atlanta and Washington DC (figures 1(c) and (d)). For cities built in a temperate grassland/C3 agriculture biome such as Chicago IL with about 72% IS and 28% grassland/agriculture (figure 2(a)) and Kansas City MO with about 62% IS and 38% croplands (figure 2(b)), the daytime mean temperature difference between the IS and vegetated land is 2.3 and 2.2 °C, respectively. These differences are slightly lower than those simulated in eastern US cities built in forested lands but similar to differences of 2.2 °C obtained for the Boston CMG surrounded by short vegetation. Further south in Phoenix AZ built in a desert, the model simulates temperature within urban areas 2.2 °C cooler than the surrounding desert-like shrublands during daytime but 1.3 °C warmer during nighttime (figure 2(c)) due to introduction of irrigated exotic trees and lawns. The desert shrublands cool faster than urban areas after sunset resulting in urban nighttime temperature warmer than surroundings. These results are in agreement with previous studies (Grimmond et al 2002, Pearlmutter et al 2007, Imhoff et al 2010). In Portland OR, a northwestern city embedded in temperate coniferous forests (figure 3(a)), the daytime mean LST difference between impervious and forested lands is 1.7 °C, slightly less than that simulated for eastern cities built in MFs such as Washington DC and Atlanta, but larger at night when it reaches about 2.0 °C. In San Jose CA and Los Angeles CA (figures 3(b) and (c)) the urban is warmer than vegetation during daytime by 2.4 and 1.9 °C, respectively. Our results are consistent with recent analyses of the relationship between urban intensity and phenology across a region with broadly similar environmental characteristics (Walker et al 2015).
Figure 2. Same as figure 1, except for (a) Chicago, (b) Kansas City, (c) Phoenix.
Download figure:
Standard image High-resolution imageFigure 3. Same as figure 1, except for (a) Portland, (b) San Jose (averaged over March, April, and May), (c) Los Angeles (averaged over March, April, and May).
Download figure:
Standard image High-resolution imageIn most US cities, the material used in buildings and pavement construction absorbs more energy causing urban surfaces and the air immediately around them to warm faster than surrounding vegetated areas, creating an UHI (Voogt and Oke 2003, Shepherd 2006, Quattrochi et al 2007, Imhoff et al 2010, Stone et al 2013 ). As reported in Quattrochi et al (1997) the SiB2 model reproduces distinct responses from different LC elements forced by the same atmospheric variables, and captures the UHI with results in agreement with observations (Oke 1982, Imhoff et al 2010, Zhang et al 2010) and modeling studies (Shepherd 2006).
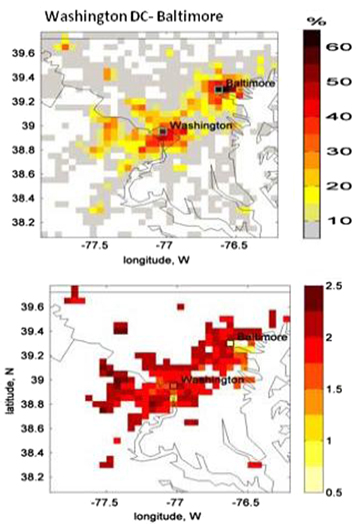
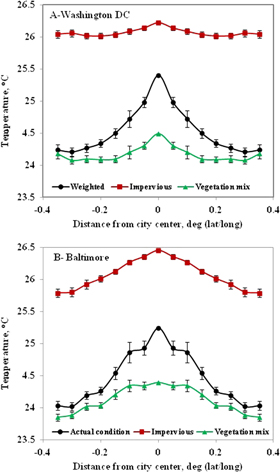
Except for Phoenix AZ where the model simulated an urban heat sink (figure 2(c)), for all other cities, the modeled urban surface temperature is warmer than that of the surrounding vegetated land (figures 1–3), creating thus well-defined UHIs. To illustrate this effect, we choose 2 large cities in close proximity, in the eastern US (Washington DC and Baltimore MD), forming a metropolis of the region, to assess the surface temperature contrast between the urban and vegetated lands. We also compare the UHI of this metropolis with that simulated in a city of similar size in the mid-Atlantic region with warmer climate (Atlanta, GA). We selected an area of about 1.5° × 1.5° of latitude–longitude including Washington DC and Baltimore to illustrate the amplitude and structure of the UHI. We analyzed the June–July–August (JJA) surface temperature difference between the impervious class and the weighted average temperature for vegetated classes for each CMG within the area (figure 4). We find temperature differences of more than 2 °C simulated along the northeastern corridor; and in regions with high ISA west of the cities. For Atlanta (not shown), most CMGs (52%) display an urban minus vegetation temperature differences less than 1.7 °C, whereas 53% of CMGs along the Washington-Baltimore corridor show temperature differences greater than 2 °C. This is due to higher summer temperature in Atlanta compared to the Washington DC-Baltimore region, which forces vegetation stomatal closure and increases its canopy temperature, thus reducing its difference from that in urban areas. We represent the UHI using surface temperature profiles in Washington DC and Baltimore over an area spanning about 75 km around Washington DC city center for: (1) a fully urban scenario (100% IS), (2) a weighted average scenario representing the actual condition and comprising all classes (including IS) weighted by their fractions, and (3) a fully vegetated scenario in which IS is replaced by a weighted mix of vegetation (figure 5). In line with observations (Imhoff et al 2010, Zhang et al 2010, 2012) and the work of Stone et al (2013), simulated results show that surface temperature in city cores is influenced by the IS fraction, and the amplitude of the UHI depends on surrounding LC composition. For example in Baltimore, where ambient air temperature is close to that of Washington DC and where 71.5% (20% more than Washington DC) of the area is impervious, the weighted average surface temperature in the city center is about 0.7 °C warmer than in Washington DC Furthermore, in Baltimore, the UHI amplitude decreases sharply, 1.35 °C, in a short distance (∼10 km) away from the city center, due to its LC composition and proximity to water.
Figure 4. Spatial distribution of impervious surface area- ISA (upper panel) and temperature difference (°C) between the urban and vegetation classes co-existing within each CMG. Only CMG with ISA greater than 10% are shown in lower panel.
Download figure:
Standard image High-resolution imageFigure 5. Summer (June–July–August) mean surface temperature profile across Washington DC (A) and Baltimore (B). From the city center, spatial average surface temperature is calculated using rings of CMGs with outward increasing grid increment (e.g., 1 CMG away, 2 CMGs away, etc). The 'Impervious' scenario represents the land surface (skin) temperature profile for a fully (100%) impervious area. The 'actual condition' represents the average surface temperature profile obtained using all land cover classes (including urban) weighted by their fractions, and the 'vegetation mix' temperature profile is obtained by replacing the impervious surface area with a fraction-weighted mixture of all vegetation classes existing in the area. The error bars represent the standard errors of the spatial average.
Download figure:
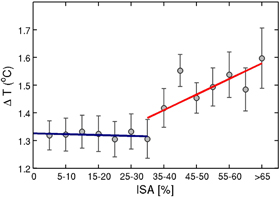
Standard image High-resolution imageThe fully vegetated scenario is a proxy for a pre-urban condition, and the departure of its temperature from the weighted average (actual condition) represents the cumulative impact of urbanization on the city's temperature. Using this comparison, we found that urbanization has increased the urban core surface temperature by about 0.9 °C in both Washington DC and Baltimore. Furthermore, if the area were to be fully urbanized, the surface temperature could rise by up to 1.8 °C at the fringes of both cities, while their city centers could warm up another 0.8 and 1.2 °C, respectively. Shepherd et al (2013) discussed the concept of how fragmented urban archipelagos scale up to impact climate, and this analysis confirms their theoretical framework. At the continental and monthly scales, spatially averaged over all pixels having more than 1% IS, we find urban lands warmer than their surroundings by 1.9 °C ± 0.6 °C during summer and 1.5 °C ± 0.4 °C during winter. These figures are in agreement with satellite estimated global average summer and winter UHI of 2.6 and 1.4 °C, respectively (Zhang et al 2010). This suggests that with increases in worldwide temperatures associated with global warming, cities may experience higher temperatures sooner than expected and the global average 2 °C upper limit endorsed by the United Nations Framework Convention on Climate Change may need to be revised for cities, which will host about 50% of the total population by 2050 (UNFPA 2007). Furthermore, our results indicate that the SUHI is quasi-insensitive to ISA fraction smaller than 35% and increases linearly after that (figure 6) which suggests that small cities, occupying about one third (35%) of their environment, may generate less heat.
Figure 6. Scatter plot showing continental average daytime mean surface temperature differences (ΔT) between urban and vegetation classes and impervious surface area (ISA).
Download figure:
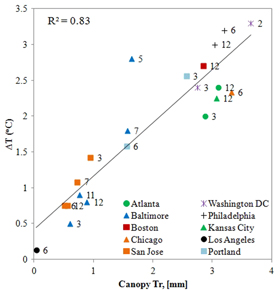
Standard image High-resolution imageWe find the daytime mean temperature difference between impervious and vegetated lands to be robustly correlated to daytime accumulated transpiration from vegetation (R2 = 0.83). This suggests that the choice and amount of tree species in urban settings can play a commanding role in modulating cities' overall surface temperature and can be used as a potential 'cooling' mechanism to alleviate the excess warming generated by IS, and to reduce domestic energy consumption. This result is in line with those from Gober et al (2009) and complements the quantitative attribution of the various contributions to UHI expressed in Zhao et al (2014); it indicates that a large part of the contrast in temperature making the SUHI is generated by evaporative cooling of vegetation surrounding urban areas (figure 7).
Figure 7. Relationship between daytime mean surface temperature difference (ΔT) between urban and vegetation classes within selected CMGs versus canopy transpiration (Tr) for June–July–August, Numbers next to markers indicate corresponding vegetation classes (2: Broadleaf Deciduous, 3: Mixed Forest, 5: Needleleaf Deciduous, 6: Savanna, 7: Grassland, 11: Barren, 12: Cropland).
Download figure:
Standard image High-resolution imageThe hydrological module of SiB2 distributes the precipitation into canopy interception and throughfall components. Water intercepted by the canopy either evaporates at the potential rate or contributes to throughfall when the canopy holding capacity is exceeded. The combined canopy water is added to the ground liquid water store from which it either evaporates or infiltrates into a shallow surface layer if the ground storage capacity is reached. In SiB2 the IS layer has a variable water storage capacity capped at 2 mm depth, an empirically determined value that matches modeled results with observations (e.g. Colello et al 1998, Ramamurthy and Bou-Zeid 2014). The surface layer has 2 cm depth for all other LC classes (Sellers et al 1996b). If the water infiltration rate is higher than the soil infiltration capacity, the excess water contributes to surface runoff.
For the grid cell located in Atlanta, we found that if the entire CMG were impervious, 47% of the precipitation will be expelled as surface runoff during summer (JJA) versus only 3.1% if the entire CMG were MF (table 1). Similar results are obtained for Washington DC with more surface runoff generated by broadleaf trees (BD) dominating the city. Given the satellite measured LC composition, we estimate the annual surface runoff in Atlanta to be about 28.9% of incoming precipitation in the urban area and only about 1.6% over the MF, whereas in Washington DC, it is about 25.7% in the urban area and 2.4% over the BD trees. Considering precipitation is uniformly distributed over the 5 km × 5 km CMG; this ratio is informative about the effect of LC on surface runoff and can be used for projecting the distribution of surface runoff given a rainfall prediction event and for defining the urban storm water guidelines. This ratio may also be helpful in designing cities with specific LC elements arrangement that will produce a desired surface water distribution. At continental and seasonal scales, urban areas expel 12% of incoming precipitation as surface runoff during summer (JJA) as compared to 3.2% over vegetated lands, with corresponding values of 14.3% and 1.1% during winter (December–January–February). Again, this confirms that the choice of tree species in an urban setting also influences surface water discharge and may be considered to reduce the risk for flash flooding (Shepherd et al 2011).
Table 1. Winter (DJF), summer (JJA) and annual mean precipitation and surface runoff (mm d−1) for Atlanta and Washington DC averaged over the urban and the vegetation class with the highest fraction. Bold figures represent the ratio of surface runoff to precipitation in percent. MF (for Atlanta) and BD (for Washington DC) stand for mixed forest and broadleaf deciduous trees, respectively.
| City | DJF mean | JJA mean | Annual mean | Actual runoff | |||||
|---|---|---|---|---|---|---|---|---|---|
| Atlanta | Precipitation | 2.71 3.52 2.85 | |||||||
| Surface runoff | Urban | 1.69 | 62.4 | 1.67 | 47.0 | 1.58 | 55.4 | 28.9 | |
| MF | 0.12 | 4.4 | 0.11 | 3.1 | 0.11 | 3.9 | 1.6 | ||
| Washington DC | Precipitation | 1.85 | 3.70 | 2.38 | |||||
| Surface runoff | Urban | 0.95 | 51.4 | 1.67 | 45.0 | 1.17 | 49.2 | 25.7 | |
| BD | 0.04 | 2.2 | 0.57 | 15.4 | 0.24 | 10.1 | 2.4 | ||
Carbon sequestration caused by LC change is an important climate change issue (Milesi et al 2003, Nemani et al 2003, Bounoua et al 2000, 2010). We compute the carbon uptake simulated by the model for each LC class, and using the fraction of each LC within the CMG we estimate the annual carbon uptake from all classes over the continent at 7.12 PgC per year (1 PgC = 1015 grams of carbon), a value slightly higher than the 6.29 PgC we obtain using MODIS product, noting that MODIS carbon estimates preclude pixels labeled buildup. We compute the carbon lost due to urbanization by postulating that, under same climate, before their conversion, current urban areas had the same carbon uptake rates as surrounding vegetation they replaced. Since LC classes differ in each CMG, we estimate the carbon lost to urbanization by replacing the IS by (1) the least productive vegetation class, (2) by the most productive vegetation and (3) by the weighted average carbon uptake from all vegetation classes existing in the CMG to constrain this reconstructed 'PRE-urban' scenario between two realistic extremes. The carbon lost to urbanization is then obtained by subtracting the total actual carbon uptake in the CMG from that of the 'pre-urban' condition. To put the estimated carbon loss into context, we compare it to the carbon gain since pre-agriculture (Imhoff et al 2004) using the same methodology.
In the 'maximum impact' scenario, i.e. urbanization and croplands have both replaced the most productive lands; the carbon lost to urbanization represents 1.8% of the total continental uptake, whereas carbon gain from agriculture represents 5.0% of the total. While statistically distinct, these numbers are striking considering agriculture occupies 32.1% of the total land while urban impervious areas occupy only 1.1% over the continental US. The carbon loss is 0.9% if both agriculture and urbanization took place over the least productive lands. The carbon lost to urbanization estimated here is in agreement with previous estimates (Imhoff et al 2004). However, the amount of carbon uptake gained from agriculture obtained in this study (5%) is higher than that previously estimated (1.8%) using coarse resolution satellite data (DeFries et al 1999).
4. Conclusion
Unlike previous studies providing a static remote sensing analysis of the UHI effect over the continental US; we use a fusion of Landsat and MODIS products within the SiB2 model to dynamically simulate the impact of urbanization, as a form of land use, on the surface energy, carbon and water cycles for the year 2001.
For US cities built in forested areas, the model simulated an urban LST higher than that of vegetated lands for much of the daytime. In most cases, the absolute maximum temperature difference between urban and vegetated lands is more than 3 °C. In contrast, for cities built in desert like environments such as Phoenix and similar cities, in which the urban core is greener than its surrounding due irrigated exotic vegetation, the model simulated an urban heat sink characterized by urban temperatures slightly cooler than surroundings during daytime. Averaged over CONUS, cities are warmer than vegetated lands by 1.9 °C during summer and 1.5 °C during winter. Our results strongly support the concept that transpiration-driven cooling is a major factor modulating the SUHI, and that smaller cities, occupying about one third (35%) of their environment, may generate less heat.
We find the ratio of surface runoff of each LC class to the incoming precipitation to be useful indicator for water discharge. On an annual mean basis and considering the observed LC composition fractions in cities of the eastern US, surface runoff in dense urban cores is about 18-fold greater than that occurring on vegetated lands. At continental scale however, urban areas expel 4 times more of incoming precipitation as surface runoff during summer (JJA) as compared to vegetated lands, with an even higher multiple in winter (December–January–February).
We estimate the maximum carbon loss due to replacement of productive lands by ISs at 1.8% of the total uptake over the continental US as compared to 5.0% gain from agriculture. These carbon estimates are revealing of the significant impact of ISs on land productivity since agriculture represents 32.1% and the impervious area represents only 1.1% of the total continental US land.
Acknowledgments
This work is funded by the NASA Interdisciplinary Research in Earth Science NNH09ZDA001N-IDS (2012). Garik Gutman, program manager.
