Abstract
China has large, estimated potential for direct air carbon capture and storage (DACCS) but its deployment locations and impacts at the subnational scale remain unclear. This is largely because higher spatial resolution studies on carbon dioxide removal (CDR) in China have focused mainly on bioenergy with carbon capture and storage. This study uses a spatially detailed integrated energy-economy-climate model to evaluate DACCS for 31 provinces in China as the country pursues its goal of climate neutrality by 2060. We find that DACCS could expand China's negative emissions capacity, particularly under sustainability-minded limits on bioenergy supply that are informed by bottom-up studies. But providing low-carbon electricity for multiple GtCO2 yr−1 DACCS may require over 600 GW of additional wind and solar capacity nationwide and comprise up to 30% of electricity demand in China's northern provinces. Investment requirements for DACCS range from $330 to $530 billion by 2060 but could be repaid manyfold in the form of avoided mitigation costs, which DACCS deployment could reduce by up to $6 trillion over the same period. Enhanced efforts to lower residual CO2 emissions that must be offset with CDR under a net-zero paradigm reduce but do not eliminate the use of DACCS for mitigation. For decision-makers and the energy-economy models guiding them, our results highlight the value of expanding beyond the current reliance on biomass for negative emissions in China.
Export citation and abstract BibTeX RIS
Original content from this work may be used under the terms of the Creative Commons Attribution 4.0 license. Any further distribution of this work must maintain attribution to the author(s) and the title of the work, journal citation and DOI.
1. Introduction
Leading up to the Glasgow Climate Conference in 2021, China submitted its mid-century strategy for low-emissions development, as well as an updated nationally determined contribution (NDC), in which the country officially pledged to peak its greenhouse gas (GHG) emissions by 2030 and to reach 'carbon neutrality' by 2060 (UNFCCC 2021a, 2021b). China's goal is of similar ambition to a spate of recent mid-century net-zero emissions targets announced by other high-emitting nations (UNFCCC 2020, 2022, 2023, United States Department of State 2021a). As the leading GHG emitter, China's commitment alone could reduce end-of-century warming by approximately 0.2 °C–0.3 °C (Climate Action Tracker 2020). Collectively, these pledges, if achieved, could keep the Paris Agreement's 2 °C temperature goal within reach (UNFCCC 2015, Rogelj et al 2016, Höhne et al 2021, Ou et al 2021)
China's existing policies to improve energy efficiency and expand renewable energy capacity and low emissions technology adoption (e.g. electric vehicles) appear to have the country on-track to meet its goal of peaking its emissions before 2030 (Department of Resource Conservation and Environmental Protection 2021, National Development and orm Commission 2021, Climate Action Tracker 2023). However, as with any other country, meeting China's longer-term and more ambitious carbon neutrality goal will also require a redoubling of efforts to phase down unabated fossil fuel infrastructure (Pan et al 2020, Zhou et al 2021, IEA 2022)
Recent modeling studies on deep decarbonization in China suggest this could be achieved in part with carbon capture and storage (CCS) deployment to dispose of multiple GtCO2 yr−1 of point-source emissions (Yu et al 2019, Sun et al 2022). Often, scenarios also project similarly large annual rates of carbon dioxide removal (CDR)—primarily underpinned by CCS—to compensate for emissions from distributed (e.g. from shipping and aviation) or otherwise highly costly to abate sources (Zhang et al 2023b). These results are driven in part by the country's large, estimated geologic carbon storage capacity (Dahowski et al 2010, 2017, Kearns et al 2017). By definition, achieving net-zero emissions without the use of CDR would require a complete elimination of residual emissions, which could drastically increase transition costs and/or require reductions in energy and material demands that are at odds with recent trends (Grubler et al 2018, Fankhauser et al 2021, Iyer et al 2021). For these reasons, the development and deployment of carbon capture, utilization and storage (CCUS) and CDR technologies was called out specifically in China's NDC and mid-century strategy documents (UNFCCC 2021a, 2021b).
China's NDC submissions in both 2015 and 2021 also include efforts to enhance its land carbon sink by expanding forested land area, which could allow for some residual emissions to continue in the context of a net-zero target (van Soest et al 2021, UNFCCC 2021a). While restoring forested ecosystems and avoiding their further degradation is critical for both climate objectives and biodiversity preservation (Roe et al 2019, Xu et al 2023), the efficacy and permanence of large-scale afforestation efforts in China and elsewhere have been mixed, and have sometimes led to issues with land and water competition (Cao 2008, Cao et al 2011, Jia et al 2017). Measurement, monitoring, reporting, and verification (MMRV) concerns also limit the realistic role of afforestation and other biospheric storage in offsetting large volumes of geologic carbon from fossil and industrial sources—which comprise the majority of China's current emissions (Fankhauser et al 2021, Dooley et al 2022, IPCC 2022, West et al 2023).
Many recent studies on carbon removal in China have therefore focused on bioenergy with carbon capture and storage (BECCS) with particular focus on the electricity sector (Pan et al 2018, Weng et al 2021, Sammarchi et al 2024). China has abundant arable land and geologic storage resources, and BECCS electricity could help avoid asset stranding by allowing a great number of China's existing coal-fired power plants to remain operational while contributing net CO2 removals rather than emissions (Li et al 2020, Wang et al 2021, Zhang et al 2023b). Additionally, BECCS could use agricultural and forestry residues, presenting a waste-to-energy approach that could reduce environmental impacts associated with dedicated bioenergy crop production (Shahbaz et al 2021, Zhang et al 2021) However, waste biomass alone will be unable to meet China's projected GtCO2-yr−1 CDR needs (Yang et al 2023). This could lead to land and water use competition between large-scale dedicated energy crop cultivation, food production and biodiversity (Li et al 2023, Perkins et al 2023, Ampah et al 2024). Procuring imported biomass sufficient for multi-GtCO2 yr−1 BECCS may be at odds with China's efforts to enhance its energy security and risks transferring the sustainability tradeoffs of such large-scale bioenergy cultivation abroad (Wu et al 2023, Feng 2024, Wang et al 2024).
Direct air capture with carbon storage (DACCS) refers to several liquid solvent or solid sorbent-based processes to separate CO2 from the atmosphere and store it in geologic reservoirs (Keith et al 2018, Beuttler et al 2019). DACCS is distinct from BECCS in that it consumes, rather than produces energy, but its relatively small land footprint could help soften the tradeoffs of relying solely on BECCS for CDR (Chen and Tavoni 2013, Marcucci et al 2017, Stler et al 2018, Realmonte et al 2019, Fuhrman et al 2020, Terlouw et al 2021). Evaluations of DACCS in the context of national net-zero emissions targets have consistently found large contributions of this technology to offset the most difficult-to-avoid emissions at relatively low cost (Bergero et al 2022, Horowitz et al 2022, Kim et al 2022, Browning et al 2023, Qiu et al 2024). Studies on DACCS in China have found similarly large potential, even at high costs, owing again to the country's vast, estimated geologic carbon storage resources (Fuhrman et al 2021b, IEA 2022).
Most of the studies above used integrated assessment modeling (IAM) frameworks, which dynamically represent the energy, land, water, and climate systems in a fully coupled manner (O'Neill et al 2020). However, the spatial resolution of these models is often at the level of major countries and geopolitical regions, with relatively few studies (IAM or otherwise) offering results at sub-national resolution (Shi et al 2017, Malik and Bertram 2022). A study by Wang et al (2023a) evaluated DACCS installations at major airports in China, but did not consider its interactions with other sectors. Fauvel et al (2023) conducted more spatially detailed but globally coupled modeling of DACCS at the U.S. state-level, but similar analysis—to our knowledge—has not yet been conducted in the context of China's net-zero goal.
Filling this gap will be critical because while China's governance follows a relatively centralized approach, it places significant importance on subnational regions in allocating the resources to implement its policy goals (Zhang et al 2020). Most of China's population and industrial output is located in the country's eastern provinces, as is much of the country's existing installed wind and solar capacity, and agricultural land (Chen et al 2020, Duan et al 2021, Jing et al 2022, Global Energy Monitor 2024). In contrast, the largest carbon storage reservoirs are located in the western part of the country (Dahowski et al 2010, 2017). Pathways for carbon emissions reduction and DACCS deployment thus vary significantly among provinces (Zhang et al 2023a, Wang et al 2023b).
To close this research gap, we enhanced GCAM-China—a version of Global Change Analysis Model with provincial level representation for China—with the ability to model DACCS (Center for Global Sustainability at the University of Maryland et al 2024). We then used this capability to evaluate which provinces in China could accommodate the largest deployments of DACCS, as well as its demand for low carbon energy in these locations. We ran several scenarios with varying constraints on biomass supply that were informed by bottom-up modeling of residual biomass availability and sustainable levels of bioenergy cultivation in China and globally (Wang et al 2022, 2023b). Finally, we assessed the value of DACCS availability on transition costs, and the investment requirements to achieve the projected levels of deployment.
2. Methods
2.1. Subnational Implementation of DACCS in GCAM-China
GCAM-China has been used extensively to evaluate China's transportation, buildings, power, industrial sectors (Cui et al 2021, Lou et al 2023, Yu et al 2023). We extended GCAM-China by incorporating the capability to model DACCS technologies at the provincial level. GCAM-China already includes BECCS and land-use change pathways for negative emissions (Yu et al 2019). Parameters of DACCS processes follow Fuhrman et al (2021a) with moderate improvements in the cost and performance over time. We consider two distinct archetypes for DACCS in China: a solvent-based process utilizing high temperature heat (>900 °C) generated from electricity and a solid sorbent process utilizing low temperature heat generated from an electric heat pump. Following consultations with stakeholders in China that indicated unlikelihood for the deployment of a natural gas based DACCS process, we have disabled this technology in China. It is possible to use alternative heat sources (e.g. from industrial processes, nuclear electricity generation, geothermal) for sorbent regeneration in the low-temperature DACCS process, which could substantially reduce the energy requirement (Fasihi et al 2019, Sizewell et al 2022, Leveni and Bielicki 2023, Bertoni et al 2024). Our choice of an electric heat pump to provide the low-grade heat is intended to provide a conservative representation of this still-nascent technology, given that DACCS represents only one of many prospective uses of waste heat (Forman et al 2016, Lu et al 2016, Arnaudo et al 2021).
To downscale DACCS potential to the provincial level, we adopt the approach of Fauvel et al (2023) and linearly scale the potential for DACCS based on each province's cumulative onshore geologic CO2 storage capacity relative to the national total (see supplementary figure 1). The onshore CO2 storage capacity for DACCS, BECCS, and captured fossil CO2 in each province is based on Dahowski et al (2010, 2017) and utilizes cost and cumulative capacity estimates for nearly 1700 geologic formations in China. These are processed into quantiles to create a graded 6-point supply curve for each province.
2.2. Scenario design
We developed seven core scenarios to investigate the impact of DACCS availability, biomass resources, and additional efforts to lower residual CO2 emissions in the context of China's 2060 carbon neutrality target (table 1). Constraints on biomass were based on the study of Wang et al (2023b) on available nationwide biomass resources in China. The 20 EJ constraint includes all estimated biomass energy potential from agricultural and forestry residues (17.9 EJ) and includes 2.1 EJ of dedicated bioenergy grown on marginal land. The 10 EJ lower bound on bioenergy availability reflects a 50% reduction from the 20 EJ constraint and is equal to 55% of the estimated biomass energy available from the full use of available agricultural and forestry residues (17.9 EJ). While bioenergy within GCAM may be provided from either dedicated bioenergy crops, or residual biomass, we did not prescribe the allowable biomass sources a priori and instead allowed the model to solve for the combination of dedicated and residual bioenergy under market equilibrium, within the constraint. Similarly, an endogenously solved combination of domestically cultivated and imported biomass may be used, so long as total consumption does not exceed the constraint value.
Table 1. Scenario design.
| Scenario name | CO2 emissions constrainta | DACCS availability | Biomass constraint (EJ/year) | Enhanced ambition on residual CO2 emissions |
|---|---|---|---|---|
| Reference (Ref) | NA | No | 20 | NA |
| NZ60_Dac_LowBio | Net-Zero by 2060 | Yes | 10 | No |
| NZ60_NoDac_LowBio | Net-Zero by 2060 | No | 10 | No |
| NZ60_Dac_MedBio (Central) | Net-Zero by 2060 | Yes | 20 | No |
| NZ60_NoDac_MedBio | Net-Zero by 2060 | No | 20 | No |
| NZ60_Dac_HighBio | Net-Zero by 2060 | Yes | Unconstrained | No |
| NZ60_NoDac_HighBio | Net-Zero by 2060 | No | Unconstrained | No |
| NZ60_LowCDR | Net-Zero by 2060 | Yes | 20 | Yes |
aThe CO2 emission constraints of the seven NZ60 scenarios follow the same trajectory. Emissions outside of China are also constrained to decline to net-zero by 2060 (see supplementary figure 2).
3. Results
3.1. Provincial decarbonization pathways under net-zero emissions
Provinces exhibit unique decarbonization pathways under national net-zero ambitions (figure 1). Some provinces including Shaanxi (SX) and Liaoning (LN) achieve net-zero CO2 emissions by 2060 (i.e. positive and negative CO2 emissions are balanced). While all provinces peak their emissions around 2030 and then substantially decline their CO2 emissions thereafter, continued net-positive emissions in some, generally more densely populated and/or industrialized provinces may be offset by net-negative emissions achieved with BECCS and DACCS in other provinces. Per-capita CO2 emissions pathways are reported in supplementary figure 12. For example, Guangdong (GD) and Shanghai (SH) are projected to have positive CO2 emissions until 2060 as they have more limited onshore geologic storage capacity with which to dispose of CO2 from point sources, and a higher share of residual emissions coming from transportation. (Supplementary figure 17).

Figure 1. China's provincial carbon emission pathway under the carbon neutrality target. The color gradient of each square indicates the 2015 CO2 emission in each province. The lines in each square represent the CO2 emission index of each province from 2020 to 2060 under REF and NZ60 scenarios. The CO2 emission index is calculated by dividing annual CO2 emission (from 2020 to 2060) by the 2015 CO2 emission (index = 1) for each province.
Download figure:
Standard image High-resolution image3.2. Provincial geologic CO2 storage
Figure 2 provides additional detail on how provinces utilize their geologic CO2 storage resources for DACCS, BECCS and fossil CCS if and when the country reaches net-zero emissions. In the NZ60_Dac_MedBio scenario, fossil CCS is deployed at large scale in many provinces to abate emissions from industry and electric power generation. GD has large, estimated potential for offshore CO2 storage, and it along with Hainan see this technology deployed at relatively large scale to abate fossil CO2 emissions. However, the high cost of offshore storage results in comparatively lower BECCS and DACCS deployment in these provinces. Instead, their remaining CO2 emissions are offset in other provinces more favorable for BECCS and DACCS. The largest DACCS deployments are limited to a few provinces in northeastern China. DACCS deployment in Shanxi, Hebei, Henan, Shandong, and Jiangsu enables these provinces to lead the way in net-negative emissions and offset net-positive emissions from other provinces (e.g. GD). Xinjiang, which has the highest cumulative CO2 storage capacity, is projected use a larger share of this capacity for fossil CCS (i.e. captured and thus avoided emissions, but not removals; see also supplementary figures 1 and 16). Because CO2 removal from BECCS electricity and liquids is essentially a coproduct of energy production, the scale of energy use is one of the main drivers of BECCS deployment, which is distributed somewhat more evenly across provinces than DACCS, but at smaller scale.
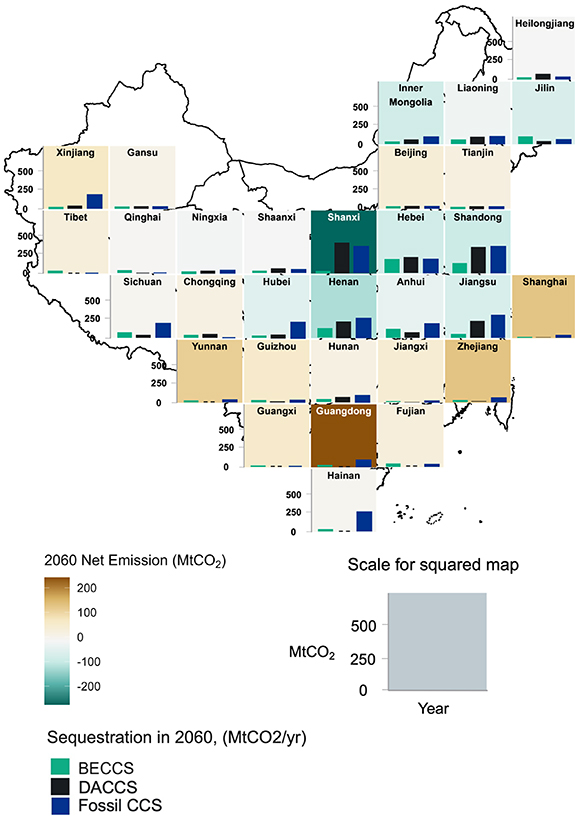
Figure 2. Net CO2 emissions (shading) and sequestration (bars) in 2060 for provinces in China. The color gradient of each square indicates the net CO2 emission in 2060. The three bars represent annual CO2 sequestration in 2060. (Black bar: DACCS, Green bar: BECCS, Blue bar: Fossil CCS).
Download figure:
Standard image High-resolution image3.3. Renewable electricity requirements for DACCS
Large-scale DACCS deployment in China would compete substantially with other prospective uses of low-carbon electricity including buildings, industry, and transportation. As shown in figure 3, DACCS could account for up to 20%–30% of electricity consumption in Shanxi, Inner Mongolia, and Shandong, which are also among the provinces with the largest projected renewable capacity additions under the net-zero emissions constraint. Country-wide, based on proportional electricity demand, DACCS could require approximately 635 GW of additional renewable generation capacity by 2060. This is approximately 10% of the 6300 GW projected to be installed nationwide, and over half of the current 1200 GW renewable capacity goal for 2030. The substantial renewable energy capacity requirement to support DACCS nationwide could be further magnified at the provincial scale, with provinces like Inner Mongolia (200 GW additional renewable capacity for DACCS), Shandong (70 GW), and Shanxi (64 GW).
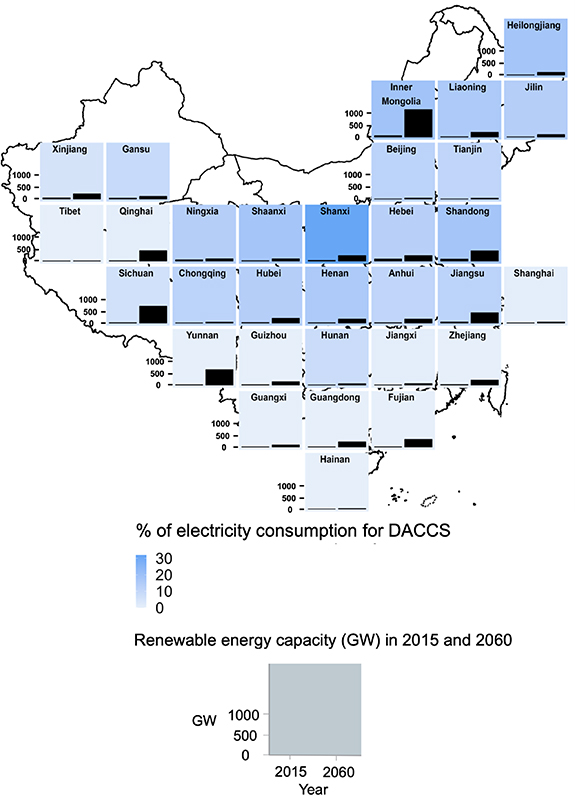
Figure 3. Renewable electricity capacity in each province in 2015 and 2060 (black bars), and electricity consumption by DACCS as a proportion of total electricity consumption in each province (shading).
Download figure:
Standard image High-resolution image3.4. Electricity generation and inter-provincial transfers
Figure 4 reports a breakdown of electricity generation and consumption in 2015 and 2060, as well as net exports by province in 2060 for the NZ60_Dac_MedBio scenario. As expected, by 2060, most provinces substantially increase their electricity production while transitioning from coal-dominated grids to a mix of renewables, nuclear, and fossil generation equipped with CCS. Notably, biomass (both conventional and with CCS) generation does not play a large role in any province's electricity mix, as the limited biomass supply under the sustainability constraint is mostly allocated to producing liquid fuels, which have fewer low-carbon technology options available to produce them. Additionally, provinces like Inner Mongolia, Sichuan, Yunnan, and Qinghai have an excess of renewable energy production compared to their demand. In contrast, more heavily populated and/or industrialized provinces such as GD, Hebei, and Shandong can import low-carbon electricity to meet demand. Figure 4 also helps further contextualize the potential electricity demand of large-scale DACCS deployment, which is projected to be similar or greater in magnitude to all 2015 electricity consumption in Shanxi, Inner Mongolia, Shandong, and Hebei.
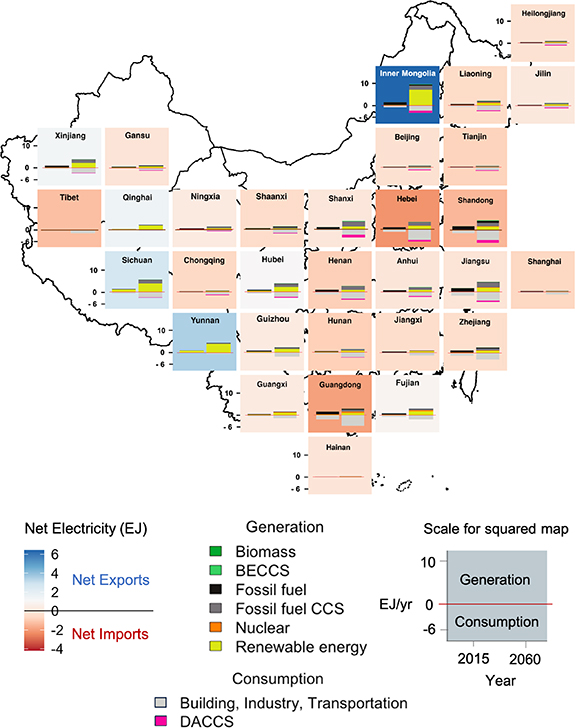
Figure 4. Electricity generation by technology and electricity consumption by sector in 2015 and 2060 (bars). Net electricity imports/exports for each province (red/blue shading).
Download figure:
Standard image High-resolution image3.5. Sensitivity analysis
Figure 5 reports the results of a sensitivity analysis in which we compare 2060 CO2 emissions by sector in each of our net-zero scenarios to the central NZ60_Dac_MedBio scenario. The NZ60_NoDac_LowBio scenario, which has the most restrictive supply-side constraints on CDR availability, results in sharply reduced residual CO2 emissions, slightly reduced levels of negative emissions from BECCS, and slightly increased negative emissions from land-use change relative to the central scenario. However, a higher share of carbon-negative bioenergy comes from electricity generation as opposed to liquid fuels production compared to the central scenario. As the biomass constraints are progressively relaxed while holding the lack of DACCS availability constant, negative emissions from BECCS electricity can increase by up to 2 GtCO2 yr−1 under unconstrained biomass supply. The scenarios in which large-scale DACCS is available are far less sensitive in terms of total CDR deployment to restrictions in biomass supply. Moderate sustainability-minded constraints on biomass barely affect BECCS deployment, whereas in the most restrictive biomass supply case (NZ60_Dac_LowBio), the approximately factor of two reduction in BECCS negative emissions can be made up for by increased DACCS deployment. The CDR demand-side measures in the low CDR scenario can reduce residual CO2 emissions by approximately 1 GtCO2 yr−1 with a corresponding reduction in DACCS deployment. In the low CDR scenario, BECCS deployment remains mostly unchanged with a slight increase in the net land-use sink. However, electricity emissions slightly increase relative to the central scenario due to increased electrification for transport and buildings.
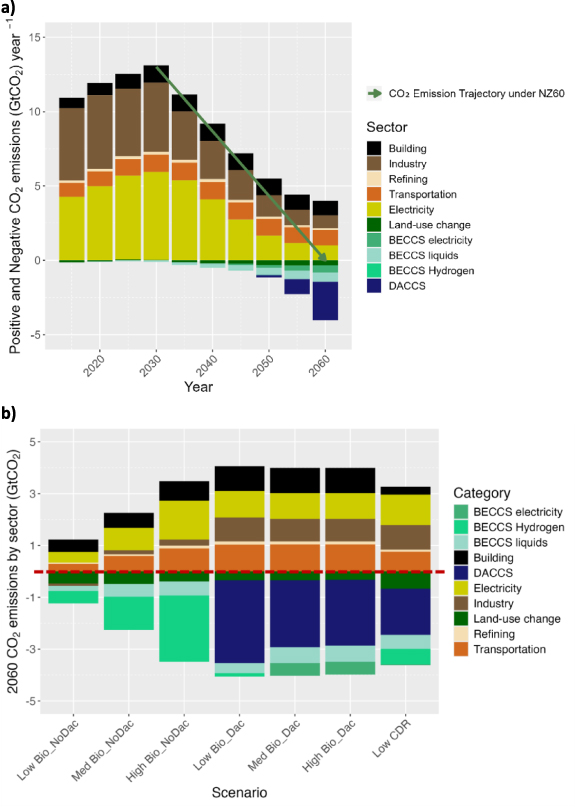
Figure 5. Positive and negative CO2 emission trajectories for China in the central NZ60_Dac_MedBio scenario (a); CO2 emissions in 2060 for all scenarios (b).
Download figure:
Standard image High-resolution image3.6. Transition cost and DACCS Investment by Net Zero scenario
Investment in DACCS may significantly reduce transition (policy) costs associated with meeting China's carbon neutrality goal, particularly if bioenergy is highly restricted (figure 6). Under the most tightest bioenergy constraint (LowBio), DACCS availability could reduce the mitigation cost to reach net-zero CO2 emissions by approximately a factor of two. This would entail DACCS investment of approximately $530 billion (NPV with 5% discount rate, $2.5 trillion undiscounted) between now and 2060. For reference China's 2023 GDP was approximately 17.5 trillion. DACCS investment is slightly reduced under a more relaxed constraint (MedBio), at the increased risk of some food and land tradeoffs. With unrestricted biomass supply (HighBio), DACCS investment requirement remains approximately the same as in the Dac_MedBio scenario, as does the cumulative policy cost. These less restrictive limits on bioenergy supply considerably reduce the policy cost without DACCS availability, but the policy cost reduction exceeds the DACCS investment irrespective of bioenergy supply restrictions. However, DACCS investment requirements, as well as mitigation policy costs may be further reduced if additional low-carbon technology adoption and behavioral change result in lower levels of residual emissions that require DACCS to offset (LowCDR scenario). The detailed calculation method for mitigation cost and DACCS investment requirements is reported in the supplementary information.
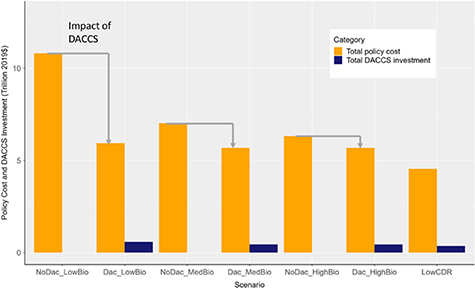
Figure 6. Cumulative (2025 ∼ 2060) Policy Cost (Orange Bar) and DACCS Investment (Blue Bar) in China by Net Zero scenario (a 5% discount rate is assumed for all scenarios; see SI 1.6 for detailed policy and investment cost calculations).
Download figure:
Standard image High-resolution image4. Discussion and conclusions
China has large potential for DACCS but its contribution and value-added under limited bioenergy supply, especially at subnational scale has remained unclear. This has, in turn, limited the ability of decisionmakers to understand which jurisdictions in China are best positioned for DACCS deployment and to proactively prepare for side-effects induced by the substantial reallocation of resources to it and other forms of CO2 removal. This work begins to address these gaps in knowledge by providing the first provincial-scale integrated assessment of DACCS technology, making use of, and further extending the large body of spatially detailed studies on BECCS in China. The results of this study may help national and regional policymakers in China plan for prospective DACCS hubs like those being envisaged in the United States, furthering the aims of the recent Glasgow Declaration and Sunnylands Statement (United States Department of State 2021b, U.S. Department of State 2023).
We find that DACCS deployment in 2060 of approximately 2 GtCO2 yr−1, led by China's northern provinces, could substantially add to China's CDR capacity while keeping bioenergy consumption within limits aimed at avoiding excessive food and land-use competition. Building out this level of DACCS capacity could require investment of $530 billion by 2060 for the capture facilities alone (i.e. excluding additional low-carbon electricity capacity to power them, which is discussed below). However, such investment could lower the cost of reaching the net-zero emissions goal by up to 50% under the most stringent constraints on biomass supply. DACCS deployment may also necessitate substantial new low-carbon generation capacity in China, potentially exceeding 50% of its current 1200 GW renewable capacity goal.
The 5 yr model timesteps used in this study are too coarse to evaluate the use of excess variable renewable generation to power DACCS. This would increase the levelized costs of DACCS by reducing its capacity factor and/or requiring dedicated energy storage. Higher temporal resolution models that model daily or hourly DACCS operation endogenously, optimizing its utilization of renewable energy, could help refine the planning of renewable capacity expansion and grid operation needed to realize the levels of DACCS deployment projected here. Furthermore, more high-resolution modeling can help evaluate tradeoffs between transmission of low carbon electricity and/or captured CO2 from DACCS and other sources over potentially long distances. Finally, we did not consider the potential use of waste heat for sorbent regeneration in low-temperature DACCS processes, which could substantially lower the energy impacts found here. Future work could characterize the availability of waste heat in China and elsewhere and evaluate how DACCS might compete with other prospective uses of this resource (e.g. district heating, point-source CO2 capture) for decarbonization.
This study also did not consider the full breadth of prospective CDR technologies such as enhanced weathering, biochar, or other methods to enhance soil carbon. These are beginning to be incorporated into global models and notably do not entail the use of subsurface CO2 storage reservoirs (Strefler et al 2021, Bergero et al 2022, Fuhrman et al 2023). Because China was revealed to have among the largest potentials to deploy several of these CDR pathways, subnational IAM and/or downscaling studies could help decision makers plan for implementation, and prepare for their unique side-effects and co-benefits for agriculture (Beerling 2017, Jeffery et al 2017, Borchard et al 2019). Reducing reliance on subsurface storage CO2 generally may become especially important as this work, like most other IAM studies, considers only cumulative geologic CO2 storage capacity and does not consider practical limits on CO2 injection rates due to lack of available data. These been suggested as a challenge to real-world deployment of CCS technologies for both emissions avoidance and CDR in China and elsewhere (Lane et al 2021). Detailed data on the rates at which prospective receiving formations can accept large volumes of CO2 will be critical to inform the large infrastructure and institutional scale-ups required to reach multi GtCO2-scale CCS, which underpins both DACCS and BECCS.
If geologic storage is highly constrained in China and elsewhere, captured CO2 from DACCS and other sources could also be used to produce synthetic fuels (Mignone et al 2024). However, their favorability relative to biofuels could be limited by the need to combine two thermodynamically expensive processes (i.e. atmospheric CO2 capture and zero-carbon hydrogen production), unless both undergo significant cost declines (Ueckerdt et al 2021, Speizer et al 2024). Additional global-scale and spatially detailed research is required to help inform optimal uses of captured CO2, as well as constrained biomass and geologic storage resources.
Efforts to reduce residual emissions that must be offset with CDR can help reduce side-effects of its deployment and enhance its long-term efficacy in drawing down CO2 concentrations (Fuhrman et al 2024). To this end we find that successful measures to reduce CO2 emissions across the buildings, transportation, and industrial sectors could reduce the DACCS required to reach net-zero CO2 emissions in China by approximately 1 GtCO2 yr−1 (50%), saving approximately $80 billion (NPV) in future DACCS investment. The cost of such measures is beyond scope of this study to evaluate fully, but will depend in turn on future developments in cost, performance, and adoption of zero-emissions technologies, which like DACCS and BECCS are highly uncertain (Wilson 2012, Lamontagne et al 2018, van Vuuren et al 2018, Giannousakis et al 2021). However, they could also come with substantial co-benefits including reduced local air pollution and perhaps equally critically, avoiding infrastructure lock-in that could drive the need for additional future CDR if the achievement of net-zero emissions is delayed as a result. Analyses conducted with alternative modeling frameworks (e.g. computable general equilibrium) can complement this study's integrated assessment approach and provide a clearer picture of these and other tradeoffs between releasing emission space for difficult-to-abate sectors, and large capital investments in non-productive projects.
The high cost of DACCS presently limits its demand in voluntary carbon markets but setting explicit targets for DACCS in future NDC submissions and valuing durable CDR in China's emissions trading system could help create such demand. Additionally, developing measurement, reporting, and verification and permanence standards for CDR, in collaboration with the international community, can help policymakers and investors evaluate the higher costs of DACCS against its benefits (Fuss et al 2018, Nemet et al 2018). Such efforts may help China position itself as an exporter of high-quality carbon removal credits while demonstrating success in scaling up DACCS, benefiting international climate objectives.
Acknowledgments
This research was supported by the ClimateWorks Foundation. C.W., R.W., J.W. and H.J. were supported by the National Natural Science Foundation of China (No. T2261129475 and No.72348001). A.F.C and P.J. were supported by the U.S. National Science Foundation award number 2215396. H.M. was supported by the National Research Foundation of Korea (BP Grant: RS-2023-00219466).
Data availability statement
The data that support the findings of this study are openly available at the following URL/DOI: https://doi.org/10.5281/zenodo.13381829.
Author contributions
H.K. led the model development, ran and analyzed the scenarios, and wrote the first draft of this manuscript, supported by J.F. and Y.Q. C.W., R.W., H.J., J.W., A.C., and P.J., co-developed the input assumptions and scenario design. S.Y., R.C., A.M., H.M., J.B., and Y.O. contributed to the modeling tools. All authors contributed to the study formulation, interpretation of results, and editing of this manuscript.
Code availability statement
The GCAM-China model code supporting the findings of this article is available in a public repository accessible at https://github.com/umd-cgs/gcam-china/tree/gcam-china-v6/input/gcamdata/R
Declaration of generative AI and AI-assisted technologies in the writing process
During the preparation of this work the author(s) used ChatGPT to correct grammatical errors and unnatural expressions. After using this tool/service, the author(s) reviewed and edited the content as needed and take(s) full responsibility for the content of the publication.
Supplementary data (3.5 MB PDF)