Abstract
Piezoelectric energy harvesting is an attractive alternative to battery powering for wireless sensor networks. However, in order for it to be a viable long term solution the fatigue life needs to be assessed. Many vibration harvesting devices employ bimorph piezoelectric bending beams as transduction elements to convert mechanical to electrical energy. This paper introduces two degradation studies performed under symmetrical and asymmetrical sinusoidal loading. It is shown that besides a loss in output power, the most dramatic effect of degradation is a shift in resonance frequency which is highly detrimental to resonant harvester designs. In addition, micro-cracking was shown to occur predominantly in piezoelectric layers under tensile stress. This opens the opportunity for increased life time through compressive operation or pre-loading of piezoceramic layers.
1. Introduction
Piezoelectric materials have become increasingly important for motion and vibration energy harvesting applications. In the quest for finding solutions to locally gather energy from surrounding sources, industrial machinery vibrations and the movement, particularly on the extremities, of people walking and exercising are prime candidates for powering wireless sensor nodes, electronics and medical implants. Traditionally, the main options for energy conversion are electromagnetic and electrostatic, where piezoelectric systems can be viewed as a sub-category of the latter. Electromagnetic systems struggle with very low voltage outputs at small scales, and micro electro mechanical systems (MEMS) electrostatic harvesters often require very high priming voltages. Piezoelectric devices promise a good balance between those two extremes [1–4].
Piezoelectric materials have successfully been used across a wide variety of applications for many years. However, the application in energy harvesting places different demands on the material. The case of electric loading is of interest for use as actuators, and consequently research on fatigue mechanisms of lead zirconate titanate (PZT) [5], aluminium nitride (AlN) [6] and the lifetime of multilayer stack actuators [7, 8] does not always take mechanical loading into consideration. Even those studies that do, e.g. [7, 8], do not consider energy harvesting applications, where materials are stressed to their limits for maximum power gain. We have identified three distinct scenarios in which piezoelectric materials are commonly used:
- (i)Sensor configuration: piezoelectric materials can generate large voltages as a response to small applied stresses. A prime example is a configuration as bending beam that can give a readable voltage for small tip deflections, and can be used for sensing motion or acceleration. In this scenario mechanical loading is applied but with small stress.
- (ii)Actuator configuration: this is the most common use case. The inverse piezoelectric effect is used to achieve deformation of a piezoelectric material as a result of applying an electric potential to it. Lifetime tests for such applications can be found in the literature, e.g. [5], and the effects are reasonably well understood. The loading is electrical and significant deflections can be achieved with a small mechanical stress depending on configuration.
- (iii)Generator configuration: in energy harvesting, the interest is in generating the maximum possible electrical power from a piezoelectric material. The principle of applying a mechanical load is similar to the sensor configuration. However, combined with the previously described size constraints, operation as a generator often results in large stress at the very limit of what the material can withstand. In addition, most harvesting devices rely on oscillating piezoelectric beams and thus cycle life becomes a major factor.
With regard to the latter use case, the question of increasing the power output from piezoelectric bending beam energy harvesters has been approached by variation of beam shapes [9–11] and by using multi-layer beams [12–14]. In the case of an impact driven piezo mechanism, fatigue evaluation has been performed in [15] and in [16], it was concluded that PZT ceramics deposited on ductile reinforcement layers can offer good reliability against fatigue.
In a more general case, without the focus on energy harvesting, multi-layer structures have also been investigated [17, 18]. Static loading is discussed in [19]. Typical mechanisms for failure and degradation of piezoelectric materials are well known, such as domain wall processes [20–22], fracture mechanisms [23, 24], and an in-depth investigation of several factors can be found in [25, 26] and in [27, 28] with a focus on thin films. Several methods for experimental determination of the properties have been proposed for the material coefficients [29], degradation in general [30, 31], fatigue testing machines [32], three point bending [33], in situ measurement [34] and the MEMS scale [35].
The influence of mechanical stresses on electromechanical properties of PZT are investigated in [36] and research has been done on time dependent [37] and temperature dependent behavior [38] of piezoelectric materials and empirical models have been developed for some cases [39]. PZT-ionomer composites are addressed in [40]. One of the most important studies on degradation can be found in [41], where one of the conclusions is that cyclic mechanical stress can indeed be more detrimental than cyclic electrical loading.
The authors have previously presented research on the degradation of piezoelectric bimorph bending beams [42]. The unique aspect of this research in comparison to other literature is the clear application to energy harvesting with its distinct operating conditions. Ultimately, the most important factors for this use are shifts in resonance frequency and changes in generated voltage. This paper will expand on previous results by comparing the effects of compression and tension on PZT ceramic layers separately. Bimorph piezoelectric beams are in many ways difficult to analyze, as certain properties such as stiffness depend not only on the piezoceramic layer but also on the center layer and the way they are bonded. However, they also lend themselves to this particular kind of study. In a symmetric bimorph bending beam under asymmetric mechanical loading, one layer can be always kept under tension while the opposite layer will experience the same stress in compression. In addition, large cycle life is clearly required in these applications—for instance, a piezoelectric beam operated at 100 Hz will undergo over 3 × 10⁹ cycles in one year of operation. The two experimental set-ups that were developed are presented and the results and their implications are discussed. The focus is on sinusoidal excitation of the beams as this is the use case both for resonant (narrow-band) devices and for the increasingly common frequency up-converting harvesters [43, 44].
2. Experimental set-up
2.1. Symmetrical mechanical loading via magnetic tip actuation
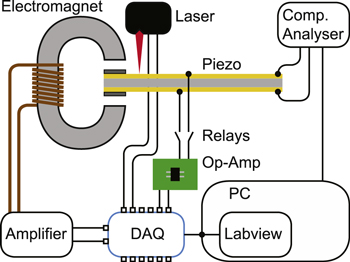
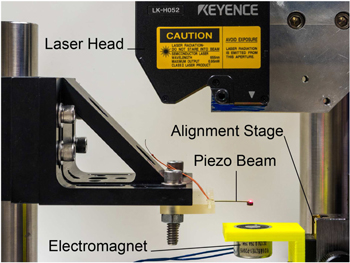
Figures 2 and 3 show an experimental set-up comprising a series connected bimorph piezoelectric bending beam that is actuated via an electromagnet and a permanent magnet at its tip. The advantage of using this actuation method over base excitation, is that it allows large tip deflections even when operated off-resonance. An Agilent E4980A precision LCR meter is used to record impedance spectra and material parameters such as capacitance and Q-factor. The system is controlled via a Labview program. Furthermore, a laser displacement sensor monitors tip deflection, and the measured output voltage of the piezoelectric beam can also be recorded after running it through a voltage attenuation op-amp circuit.
The parameters of the piezoelectric beam used in this experiment are summarized in table 1, as obtained from the supplier's data sheet, and the structure is depicted in figure 1.
Figure 1. Bimorph piezoelectric beam structure.
Download figure:
Standard image High-resolution imageTable 1. Piezo parameters for Johnson Matthey M1100 bimorph beam.
| Parameter | Value |
|---|---|
| L | 19.5 mm |
| b | 1 mm |
| tcenter | 0.15 mm |
| tpiezo | 0.11 mm |
| ttotal | 0.37 mm |
| kp | 0.70 |
| k31 | 0.42 |
| k33 | 0.71 |
| d31 | −315 × 10−12 C N–1 |
| d33 | 640 × 10−12 C N–1 |

|
4500 |

|
70.4 × 10⁹ N m–2 |
In order to achieve reliable impedance values, any additional circuitry, such as the attenuation op-amps, must be disconnected from the piezoelectric element during the measurement. This is why the measurement, as illustrated in figure 2, follows three steps. First, reed relays are used to disconnect the op-amp circuit and connect the LCR meter to the piezoelectric beam for the measurement of electrical parameters. Second, the op-amp circuit is connected, the LCR meter disconnected and a low amplitude chirp signal (5–400 Hz) is applied to the electromagnet. The resulting voltage and displacement recordings are used to determine the resonance frequency of the beams at this stage by applying an FFT to the signals. Finally, a fixed number of sinusoidal oscillations, e.g. 50 000, with a set tip deflection is applied to the beam at a driving frequency of 100 Hz (below resonance), before repeating the entire procedure for a number of iterations. The set-up would allow for a load resistor between the terminals of the piezoelectric beam, but in this case the experiments were performed in open circuit configuration.
Figure 2. Layout of the measurement set-up.
Download figure:
Standard image High-resolution imageFigure 3. Photograph of the laser head, electromagnet and piezoelectric beam.
Download figure:
Standard image High-resolution image2.2. Asymmetrical mechanical loading via direct tip actuation
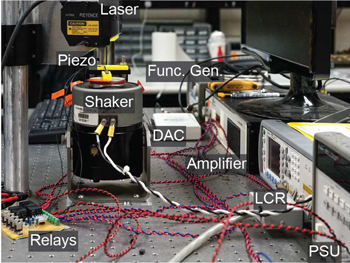
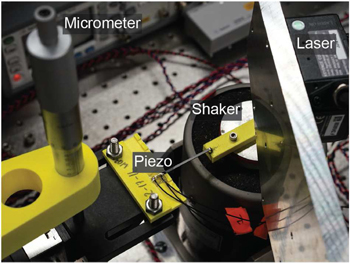
In all previous experiments, the beam tip is oscillated symmetrically about its rest position; consequently, each PZT layer spends equal time in tension and compression, so long as the layer stiffnesses stay approximately equal so that the beam's neutral axis remains at its center. In order to separate the effects of tensile and compressive loading, asymmetric experiments were conducted. In these, the beam tip is oscillated sinusoidally about an offset position such that it always remains on the same side of its rest position; consequently, although the layer stresses also oscillate in magnitude, one PZT layer remains always in compression and the other in tension. To achieve this, several changes to the original measurement set-up were necessary. It proved difficult to reach sufficient uni-lateral tip displacement via an electromagnet, so the actuation mechanism was substituted for a Labworks Inc. ET-126 shaker table instead. In combination with an Agilent 33220 A signal generator this opened further possibilities. The Keyence laser head is now monitoring the displacement of the shaker table, which can therefore be precisely controlled in a PID loop via additions to the pre-existing Labview control program. A schematic of the updated set-up is shown in figure 4 and the photograph in figure 5 shows an overview. As can be seen in figure 6, a micrometer screw is used to control the mechanical pre-load at the tip of the piezoelectric beam.
Figure 4. Layout of the modified measurement set-up.
Download figure:
Standard image High-resolution imageFigure 5. Photograph of the modified measurement set-up.
Download figure:
Standard image High-resolution imageFigure 6. Detailed photograph of the piezoelectric beam as mounted in the measurement set-up.
Download figure:
Standard image High-resolution imageIn addition, through the PID control, parameters such as capacitance, impedance and q-factors can now be measured at rest and in a deflected state. The reason for this was to investigate the hypothesis that degradation occurs due to cracks in the layer under tension. These cracks would open up in a deflected state, thus disconnecting large portions of one piezoelectric layer and so impacting the electrical parameters, whereas in the undeflected state, there might still be electrical continuity across the crack, figure 7. Accordingly, the electronics handling the relay switching between the LCR meter and the data acquisition system were altered such that both piezoelectric layers of the bimorph bending beams could be monitored individually.
Figure 7. Deflected measurements of piezoelectric properties open up developing cracks.
Download figure:
Standard image High-resolution imageThe only drawback to this system is that it is now impossible to directly measure the mechanical resonance frequency of the beam by applying a chirp signal, since the beam is in direct contact with the actuator. However, it was found that due to the electromechanical coupling inherent in piezoelectric bending beams, changes of the resonance frequency in the electrical impedance spectra are a good substitute for this kind of measurement. In addition, the vibration frequency for the extended oscillation cycles was lowered to 20 Hz due to limitations of the shaker at larger deflections. Due to the set-up being fully automated through Labview, the resulting increase in test time was however not problematic. The piezoelectric beams for this study differed from the previously used beams in that a parallel connected bimorph which provides access to the central electrode was necessary to be able to individually monitor both sides. The parameters are summarized in table 2.
Table 2. Piezo parameters for APC PZT-5X bimorph beams
| Parameter | Value |
|---|---|
| L | 37 mm |
| b | 1.8 mm |
| ttotal | 0.6 mm |
| kp | 0.72 |
| k31 | 0.40 |
| k33 | 0.78 |
| d31 | −320 × 10−12 C N–1 |
| d33 | 750 × 10−12 C N–1 |

|
4500 |

|
61 × 109 N m–2 |
3. Results
3.1. Symmetrical loading
The measurement procedure described in section 2.1 was applied to two beams separately. The only difference between the two measurements was the peak to peak tip deflection, set to 1 mm (yielding a maximum tensile beam strain of 0.073%) for beam 1, and to 0.85 mm (maximum tensile beam strain of 0.062%) for beam 2. Beam 1 snapped to the electromagnet at 1.2 million cycles due to the close proximity of the electromagnet to the beam tip required to achieve 1 mm tip deflection, which ended the experiment. The tip deflection for beam 2 was consequently lowered to prevent this from happening. In addition, the resonance frequencies and impedance spectra for the measurements on beam 2 were recorded with a higher resolution. This beam was tested for 20 million cycles. Detailed results and conclusions for these measurements can be found in [45]. However, the key findings are revisited here for the sake of completeness and to support some of the assumptions made for the additional testing under asymmetric load.
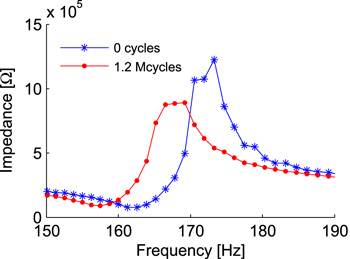
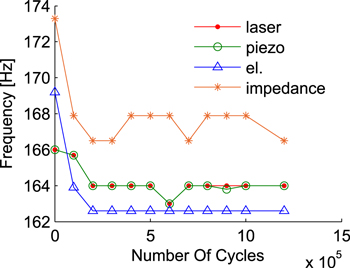
Figure 8 shows the impedance magnitude spectra for beam 1 at the start and at the end of the measurements. Some fluctuations in these measurements are caused by a low frequency resolution (approximately 1 Hz) of the measurement system. It is however clear that the impedance decreases with an increase in cycle count. The shift in resonance is also clearly seen. This is illustrated in more detail in figure 9, which shows the evolution of the resonance frequency of beam 1 during the experiment as measured in 4 different ways: through the laser signal, the piezoelectric voltage, the electrical resonance frequencies from the impedance spectra and the frequencies of the impedance maxima. These graphs show that a drop in resonance frequency is a major effect of degradation. In the case of resonant harvester designs such effects can be highly detrimental to system performance. Due to the narrow bandwidth slight changes can cause substantial power losses. In addition, these graphs also demonstrate that the four resonance frequencies only show minor differences between each other, and that they shift at approximately the same rate. Accordingly, it is not necessary to directly measure the mechanical resonance of the beam in order to detect these changes, as mentioned above in section 2.2.
Figure 8. Impedance magnitude spectra (beam 1).
Download figure:
Standard image High-resolution imageFigure 9. Resonance frequencies and frequencies of the impedance maxima versus number of cycles (beam 1).
Download figure:
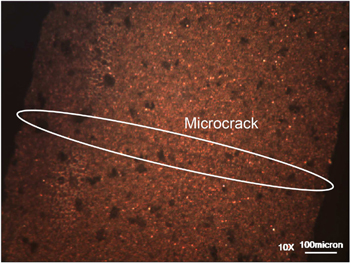
Standard image High-resolution imageThese shifts can be caused by micro-cracking of the piezoelectric layers, as observed under magnification on a damaged sample of a piezoelectric beam, see figure 10. Such fractures provide an explanation for a stiffness reduction that causes the resonance frequency to decrease.
Figure 10. Ten times magnified image of a hairline crack on a damaged piezoelectric beam.
Download figure:
Standard image High-resolution image3.2. Asymmetrical loading
As described in 2.2, additional experiments were carried out under asymmetric loading. The goal of these measurements was to investigate differences between piezoelectric layers under tension and under compression and to assess the validity of micro cracking being a mechanism for degradation. In total, four beams were tested under these conditions. Results are shown below for one of these four beams, representative for these measurements. Common observations and discrepancies between all four samples will be discussed.
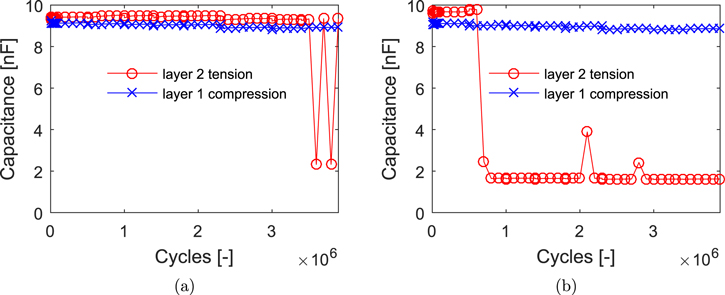
Figure 11 shows the capacitance values of the two layers of the piezoelectric beam individually as a function of cycles. The experiment was stopped after a total 4 million cycles. The cycling was interrupted every 100 000 cycles to obtain the capacitance values at rest, first for each layer when the beam was in its undeflected neutral position, i.e. the actuation arm from the shaker table was retracted and not touching the beam (a). After that, the beams were subjected to a static deflection of 4 mm and the static capacitance measurement was repeated in this deflected state (b). The differences between these states are immediately apparent and quite striking. For both layers, capacitance in an undeflected state remains constant over almost the entire duration of the experiment apart from two measurements towards the end. Whereas, in the deflected state, the layer under tension shows a sudden and significant drop in capacitance at around 0.7 million cycles. This behavior strongly supports the hypothesis that the formation of a crack in the layer under tension causes degradation. A crack develops quickly in the brittle piezoceramic layer in the area of largest stress, which is at the base of the beam. When this crack is opened up during the deflected measurement, the largest part of active material is disconnected from the measurement system (the wires are soldered on inside the clamped area of the beam). It is interesting to observe that this effect can not be demonstrated in the undeflected measurement. Since the beam is of uniform width and thickness, the capacitance is simply proportional to the length of that portion still connected to the external circuit. Thus the drop of about 80% in capacitance corresponds to formation of a crack at a position about 7 mm from the root of the 37 mm beam.
Figure 11. Capacitance values in relation to cycle count for each layer, measured in an undeflected resting state (a) and a deflected state (b).
Download figure:
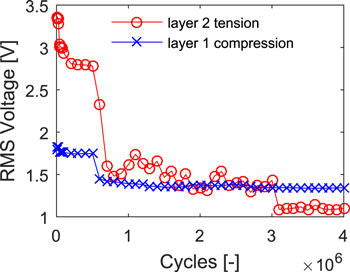
Standard image High-resolution imageThe most important consequence can be seen in figure 12. The rms voltage of each layer was continuously monitored throughout the cycling and shows a significant drop on the tensile layer that matches the observed drop in capacitance. The layer under compression shows neither drop in capacitance nor rms voltage. This suggests that operating piezoceramics under compression, for example by pre-loading, might be beneficial for longevity in energy harvesting applications. Note that because the strain in the deflected beam drops linearly from the root, loss of the outer 80% of the piezoelectric would not cause an 80% drop in voltage. The anticipated drop would be close to 64% (0.82 ), which agrees reasonably well with the observed value.
Figure 12. Rms voltage output in relation to cycle count for each layer.
Download figure:
Standard image High-resolution imageIn addition, figure 12 shows that the rms voltage for the tensile layer is higher at the start than that of the compressed layer. This phenomenon is not fully understood by the authors. Both layers, by the nature of this experiment, are experiencing equal and opposite amounts of stress. The expectation is that this should lead to equal voltage generation. Nevertheless, this phenomenon was observed across all samples.
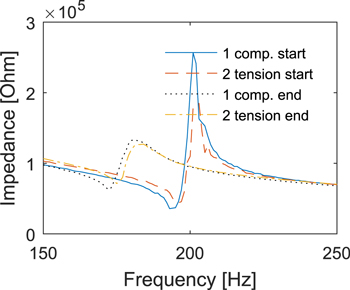
Finally, the impedance spectra for each layer are shown in figure 13 at the beginning and at the end of cycling the beam. The behavior is consistent with figure 8 for the case of symmetric loading. As degradation occurs, the resonance frequency of the beam is dramatically reduced. Unlike the output voltages, the impedance shifts for the two layers match each other very closely. This is caused by the mechanical coupling between the layers and the fact that at these low frequencies mechanical effects dominate—it is impossible for one of the layers to oscillate without actuating the other layer and it is therefore impossible to discern shifts for each individual layer.
Figure 13. Impedance spectra of each layer of the beam before and after 4 million cycles.
Download figure:
Standard image High-resolution imageThe equations governing vibration of piezoelectric bimorph beams were outlined in [43]. From this, the undamped natural frequency of the rth vibration mode in short-circuit conditions is known to be:

where the eigenvalues  are the solutions to the general equation outlined in [43] and mp the mass per unite length. The overall bending stiffness term is a function of the elastic stiffness
  of the piezoelectric layers, the Young's modulus of the substructure layer
  and geometric properties:

This equation can be rewritten to account for the fact that the elastic stiffness  for layer 1 and
  for layer 2 might be different after degradation:


As an example, when substituting the values for tpiezo and tcenter from table 2 this results in:

As one would expect, for materials with stiffnesses in the same order of magnitude, the contribution of the center layer is negligible and one can approximate:

Under these assumptions the proportionate effect  on the resonance frequency caused by a small stiffness change
  in one of the two layers can be approximated:

The last step here uses the approximation  for small values of ε. Of course this approximation might not be valid any longer for larger variations in stiffness as they have been observed in some of the experiments. However, it serves to illustrate the relationship between degradation of a single piezoelectric layer in a bimorph structure and the resonance frequency of the entire beam.
Following this first set of measurements, the procedure was followed for a second experiment in which the beam holder was flipped. Since the arrangement of the set-up is such that the vibration shaker actuates the beam via a push pin without any clamping at the tip of the beam, it is now possible to reverse the stresses in the layers. The layer that was previously under constant tensile stress is now under compression and vice versa.
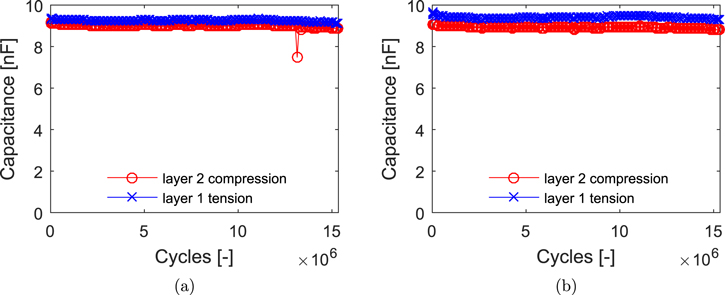
Figure 14 shows the resulting capacitance values as a function of cycles. Note that the cycle counter has been reset to zero. It is interesting to see that in both deflected and undeflected state, the capacitance is now back up to the same values as it was at the beginning of the first round of testing. Again, a likely explanation is that the degradation was caused by a crack in the layer originally under tension. Now that this layer is under compression the initial crack remains closed and does not grow any further. On the other hand, it was expected that in this configuration, the second layer that is now under tension would start to degrade and match the properties of the other layer. This is, however, not the case and the capacitance shows very little change despite the fact that the cycling was carried out up to 16 million cycles in an attempt to provoke failure. This behavior was also mostly consistent across all tested beams. It is not well understood but a potential explanation is that the reduced stiffness of the previously tensile layer, caused by the crack, has shifted the neutral axis so that the same deflection results in a lower peak stress in the now tensile layer.
Figure 14. Capacitance values in relation to cycle count for each layer, measured in an undeflected resting state (a) and a deflected state (b), after flipping the beam to experience opposite stresses following initial degradation.
Download figure:
Standard image High-resolution imageDespite the fact that the capacitance does not show much variation, the rms voltage in figure 15 shows a decrease for the previously cracked layer. This is highly interesting as it suggests that the degradation actually continues on this layer. At the beginning, the crack is closed due to the compression of the layer and the rms voltage is at a higher level than it was at the end of the first experiment. As the degradation worsens, the crack still remains closed at the maximum deflection but starts opening up at the smallest deflections when the beam is almost back in its neutral position. This is supported by the previous capacitance graph that does not show the same trend because capacitance in this case is always measured at maximum deflection when the crack is closed.
Figure 15. Rms voltage output in relation to cycle count for each layer, after flipping the beam to experience opposite stresses following initial degradation.
Download figure:
Standard image High-resolution imageLastly, the impedance curves in figure 16 remain at a similar level as they were at the end of the first experiment. This is expected since the impedance measurements are taken in a resting position without deflection that is identical to the position from the previous experiment. There are no further shifts in resonance frequency, which suggests that there are no new cracks that are forming nearer the base of the beam after the initial degradation.
Figure 16. Impedance spectra of each layer of the beam before and after 16 million cycles, after flipping the beam to experience opposite stresses following initial degradation.
Download figure:
Standard image High-resolution image4. Conclusions
Previously it has been shown that the performance of piezoelectric vibrating energy harvesters degrades with time. To characterize this phenomenon, and to seek possible preventive measures, we have conducted controlled tests over large oscillation counts. Furthermore, we have investigated the possibility that micro-crack formation in the piezo layers when under tension is a key mechanism of degradation, by performing tests on bi-layer harvesters that maintain the two layers entirely in tension or in compression. The results clearly show degradation to happen primarily within the tensile layer, and support the proposition that micro-cracking is responsible. This indicates that a possible solution could be to fabricate harvesters where the piezo layers are pre-stressed in compression. This has been successfully exploited in piezo actuator products [46].
Some experimental observations have yet to be fully understood, particularly the higher initial voltages seen consistently in the tensile layers. Understanding of all these phenomena will be essential to achieving reliable piezoelectric vibrating energy harvesters that provide consistently high output power over the very large numbers of cycles that applications will require.
Acknowledgments
The present project is supported by the National Research Fund, Luxembourg.

