Reorder point
•Download as PPTX, PDF•
24 likes•46,605 views
This presentation explains about the Operations Management concept Reorder point, different cases with examples, fixed order interval model, single period model etc.


Reorder point
- 2. Reorder Point (ROP) Definition: • The Reorder Point (ROP) is the level of inventory which triggers an action to replenish that particular inventory stock. • It is normally calculated as the forecast usage during the replenishment lead time plus safety stock. • In the EOQ (Economic Order Quantity)model, it was assumed that there is no time lag between ordering and procuring of materials. Therefore the reorder point for replenishing the stocks occurs at that level when the inventory level drops to zero and because instant delivery by suppliers, the stock level bounce back. • Reorder point is a technique to determine when to order; it does not address how much to order when an order is made. 2
- 3. Cont.… • In real life situations one never encounters a zero lead time. There is always a time lag from the date of placing an order for material and the date on which materials are received. As a result the reorder point is always higher than zero, and if the firm places the order when the inventory reaches the reorder point, the new goods will arrive before the firm runs out of goods to sell. The decision on how much stock to hold is generally referred to as the order point problem. 3
- 4. General Expression • The two factors that determine the appropriate order point are the delivery time stock which is the Inventory needed during the lead time (i.e., the difference between the order date and the receipt of the inventory ordered) and the safety stock which is the minimum level of inventory that is held as a protection against shortages due to fluctuations in demand. Reorder Point (R) = Normal consumption during lead-time + Safety Stock 4
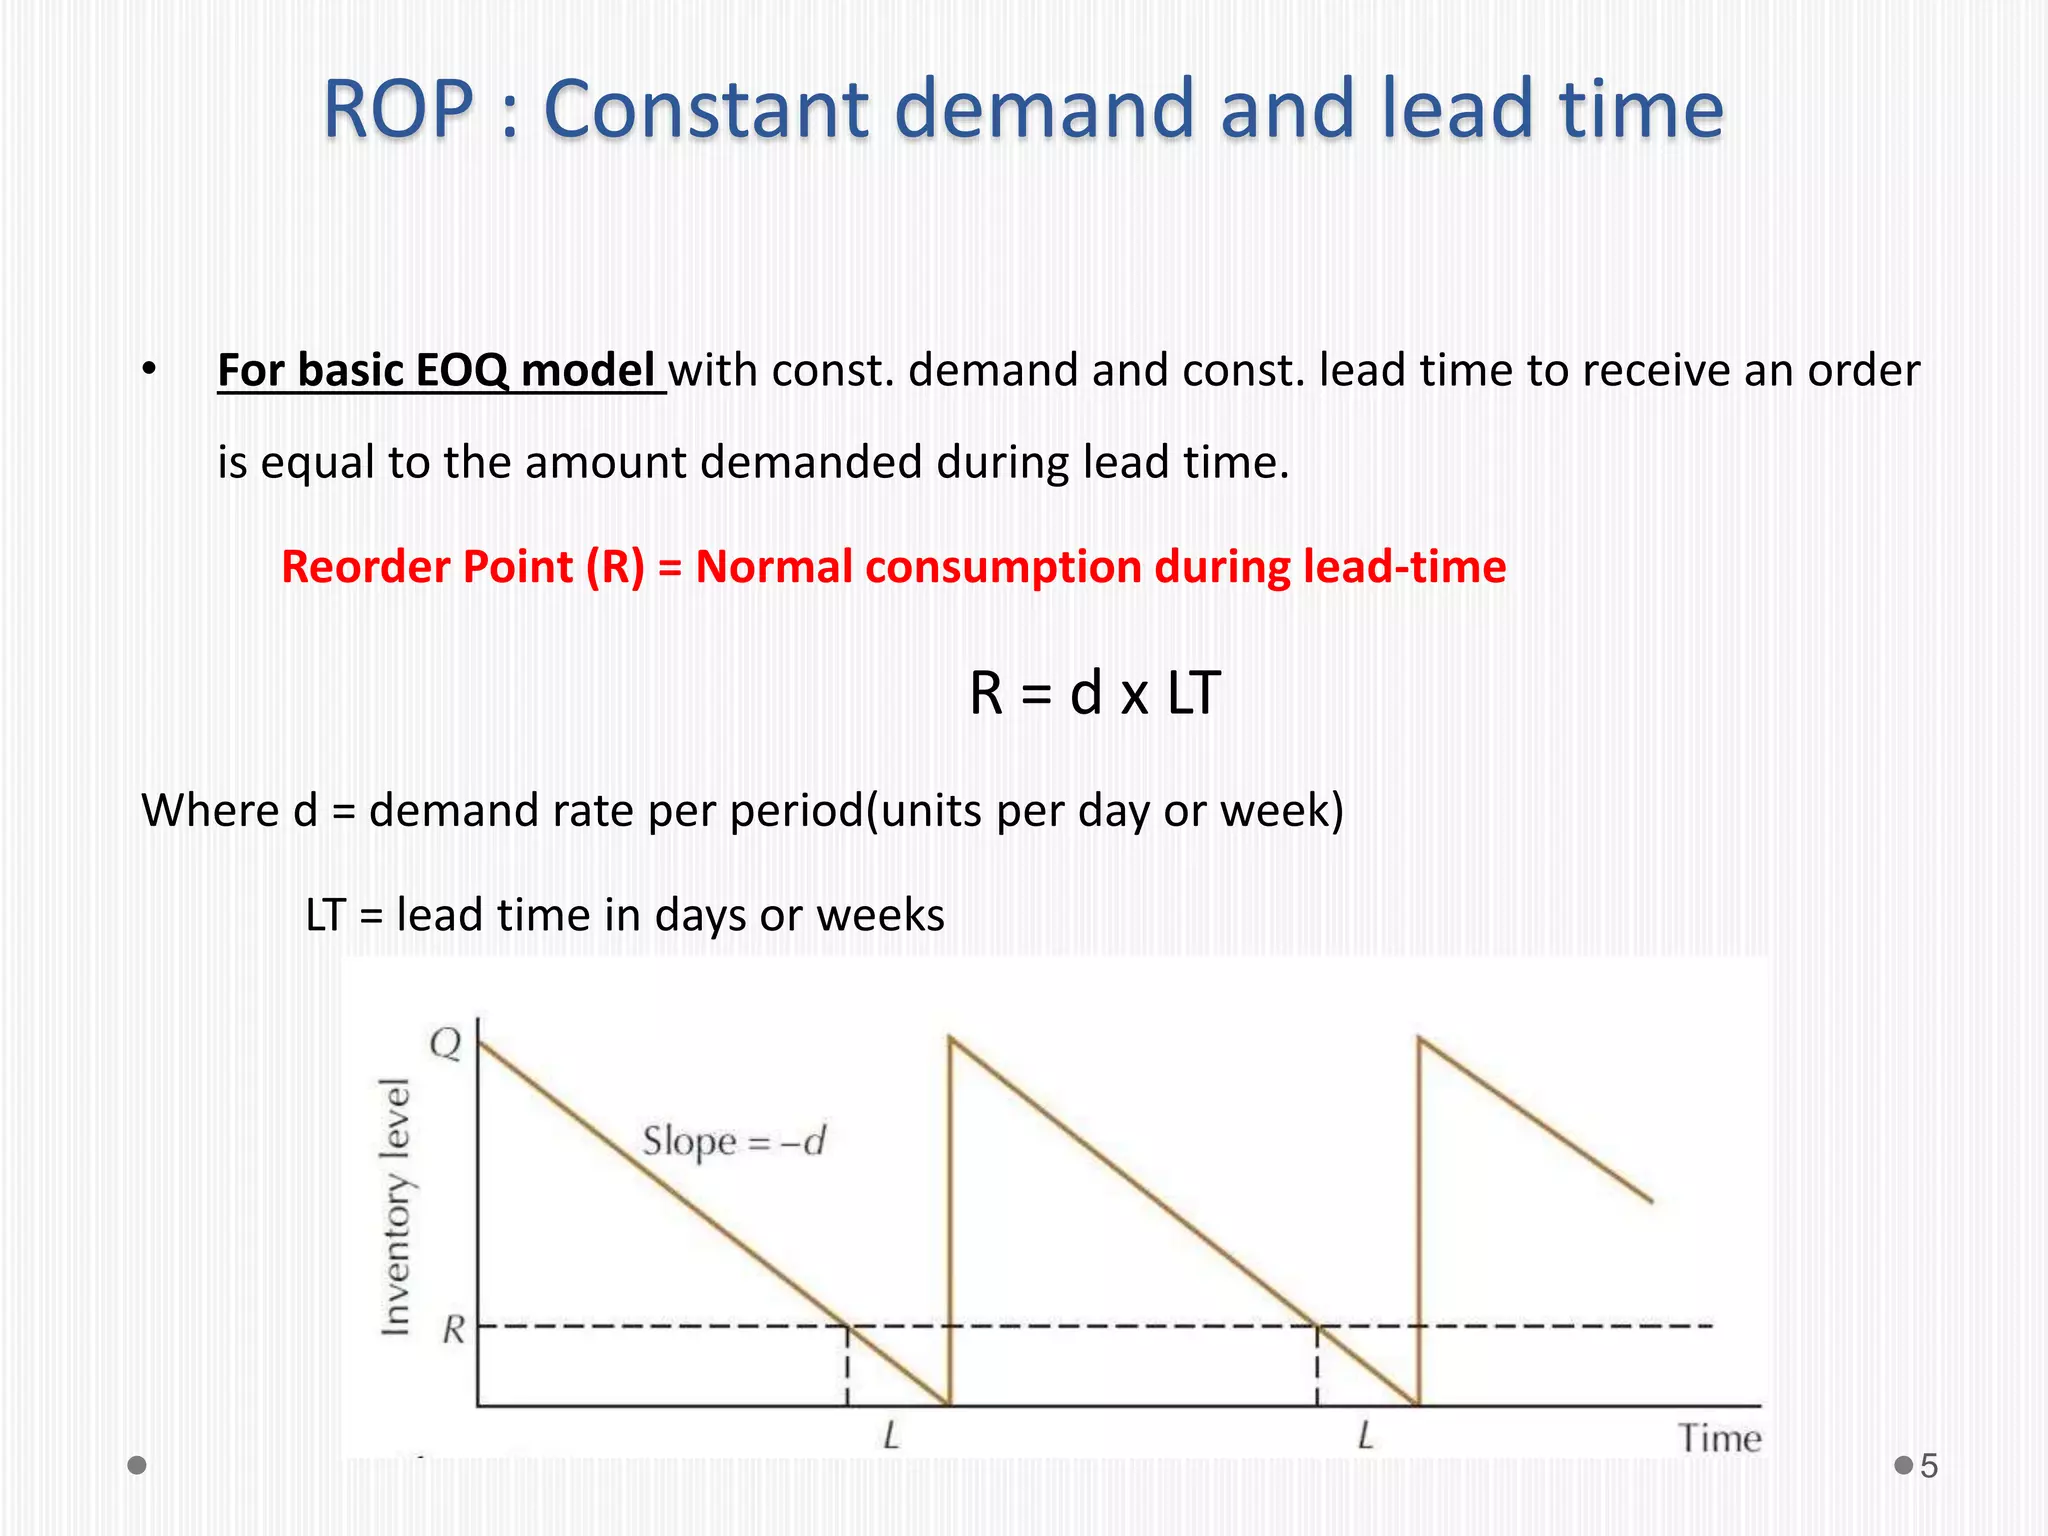
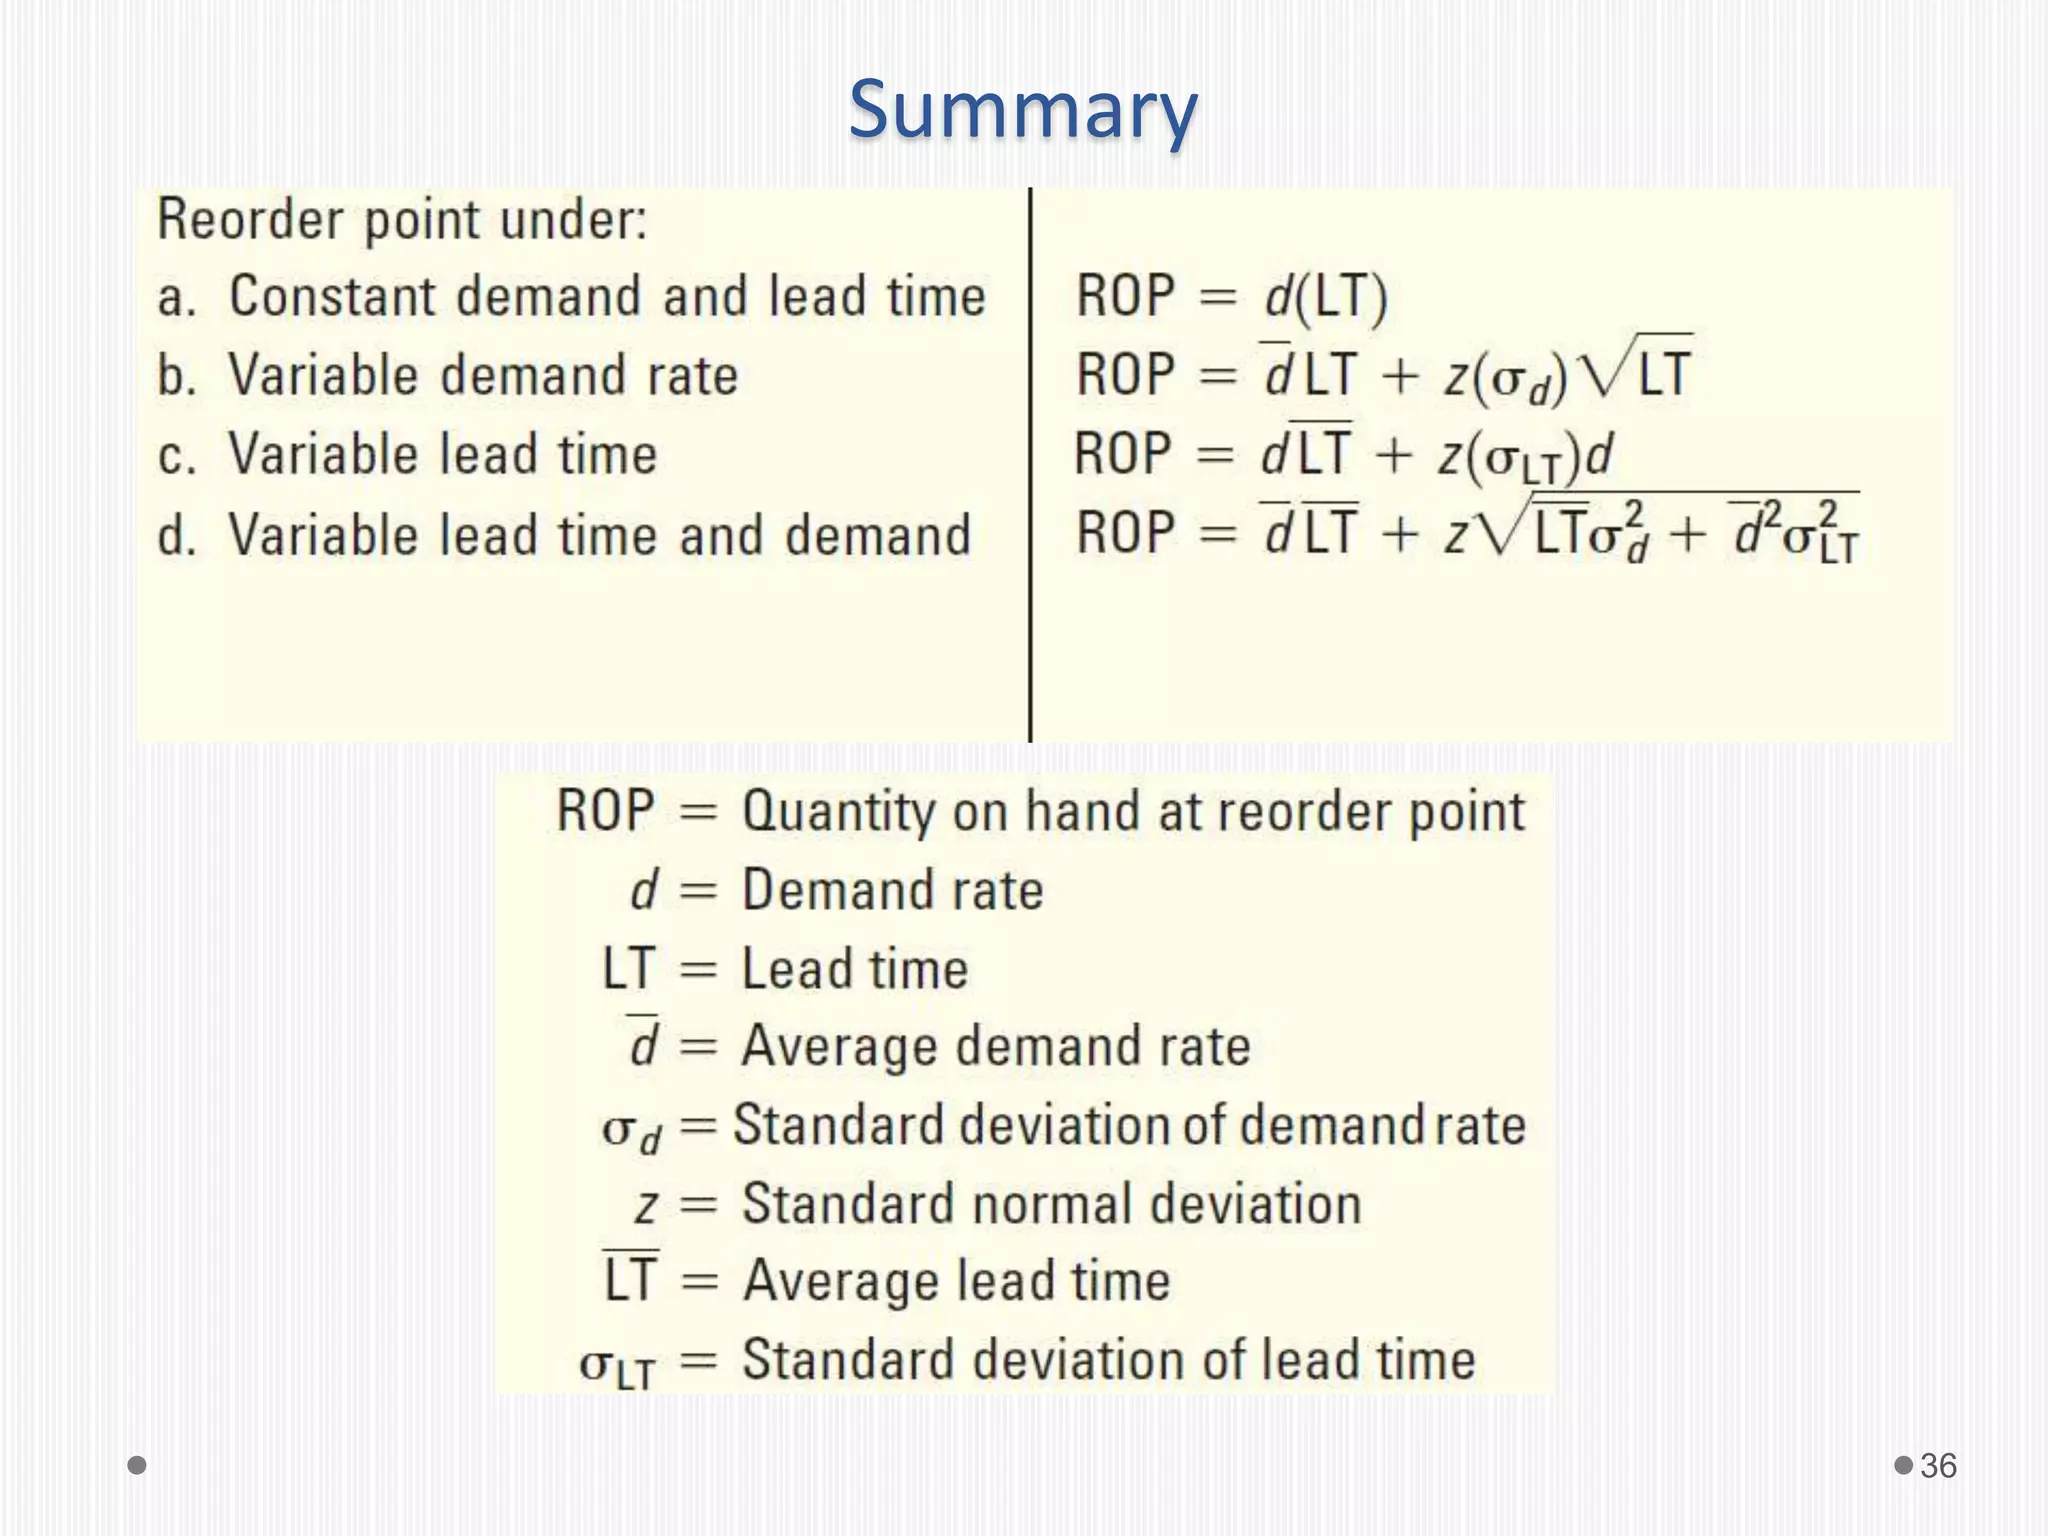
- 5. ROP : Constant demand and lead time • For basic EOQ model with const. demand and const. lead time to receive an order is equal to the amount demanded during lead time. Reorder Point (R) = Normal consumption during lead-time R = d x LT Where d = demand rate per period(units per day or week) LT = lead time in days or weeks 5
- 6. Problem 1 An ePaint Internet store is open 311 days per year. If annual demand is 10,000 gallons of Ironcoat paint and the lead time to receive an order is 10 days, determine the reorder point for paint. 6
- 7. Solution Demand (d) = 10,000 gallons/year Store open 311 days/year Daily demand = 10,000 / 311 = 32.154 gallons/day Lead time = LT = 10 days R = d x LT = (32.154)(10) = 321.54 gallons 7
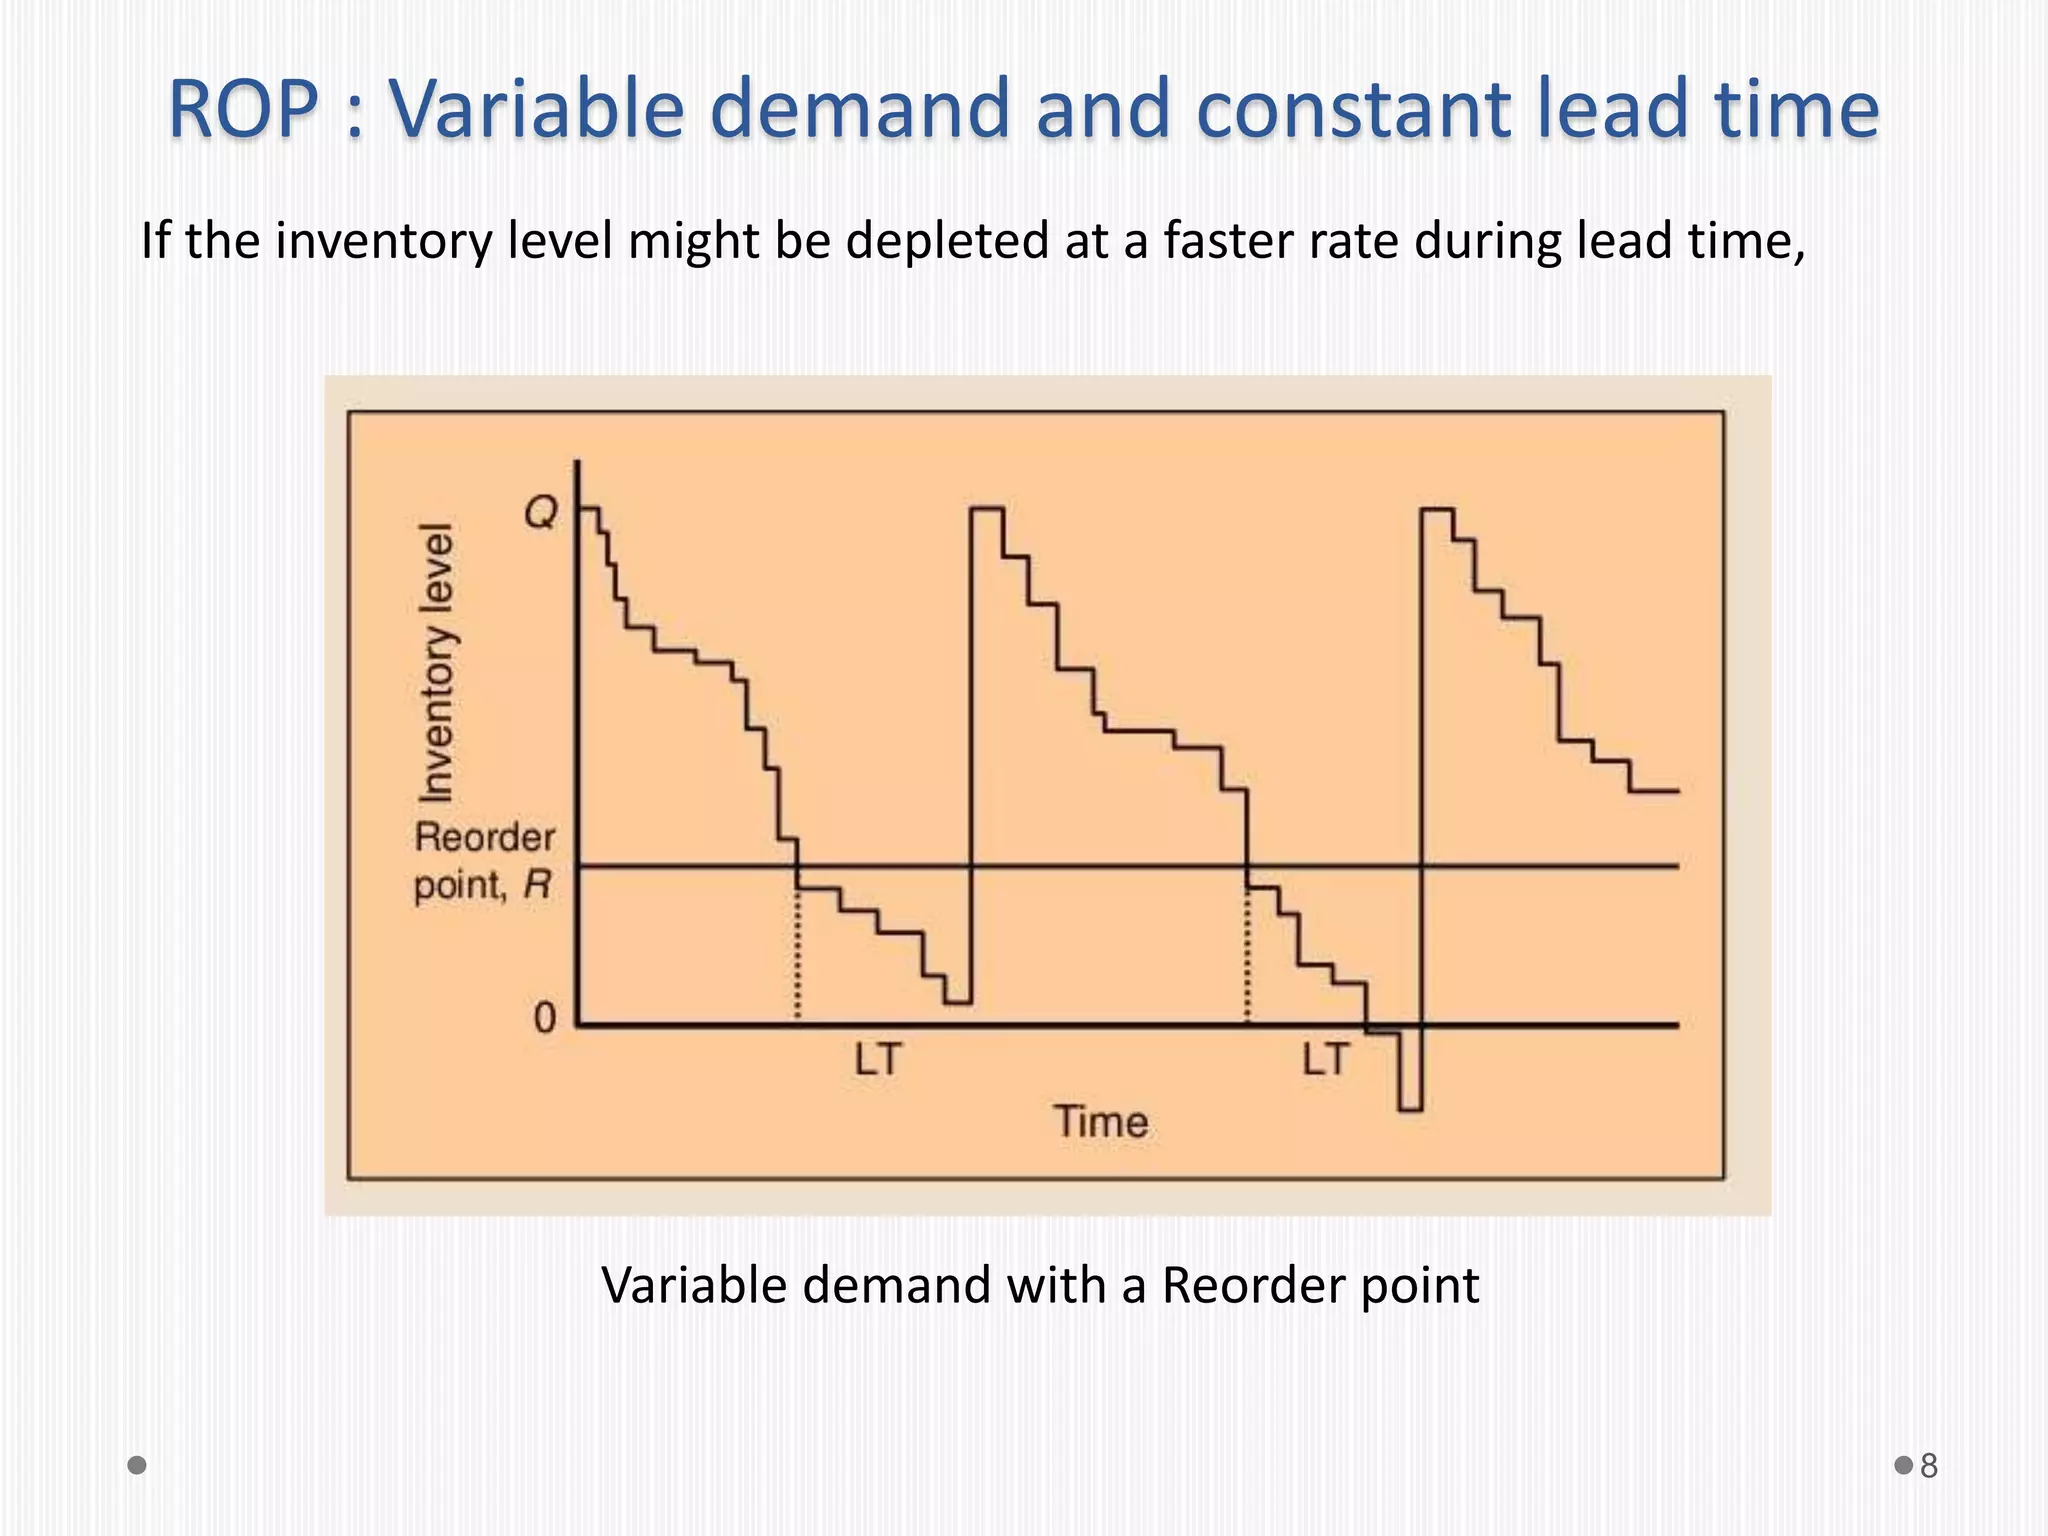
- 8. ROP : Variable demand and constant lead time If the inventory level might be depleted at a faster rate during lead time, Variable demand with a Reorder point 8
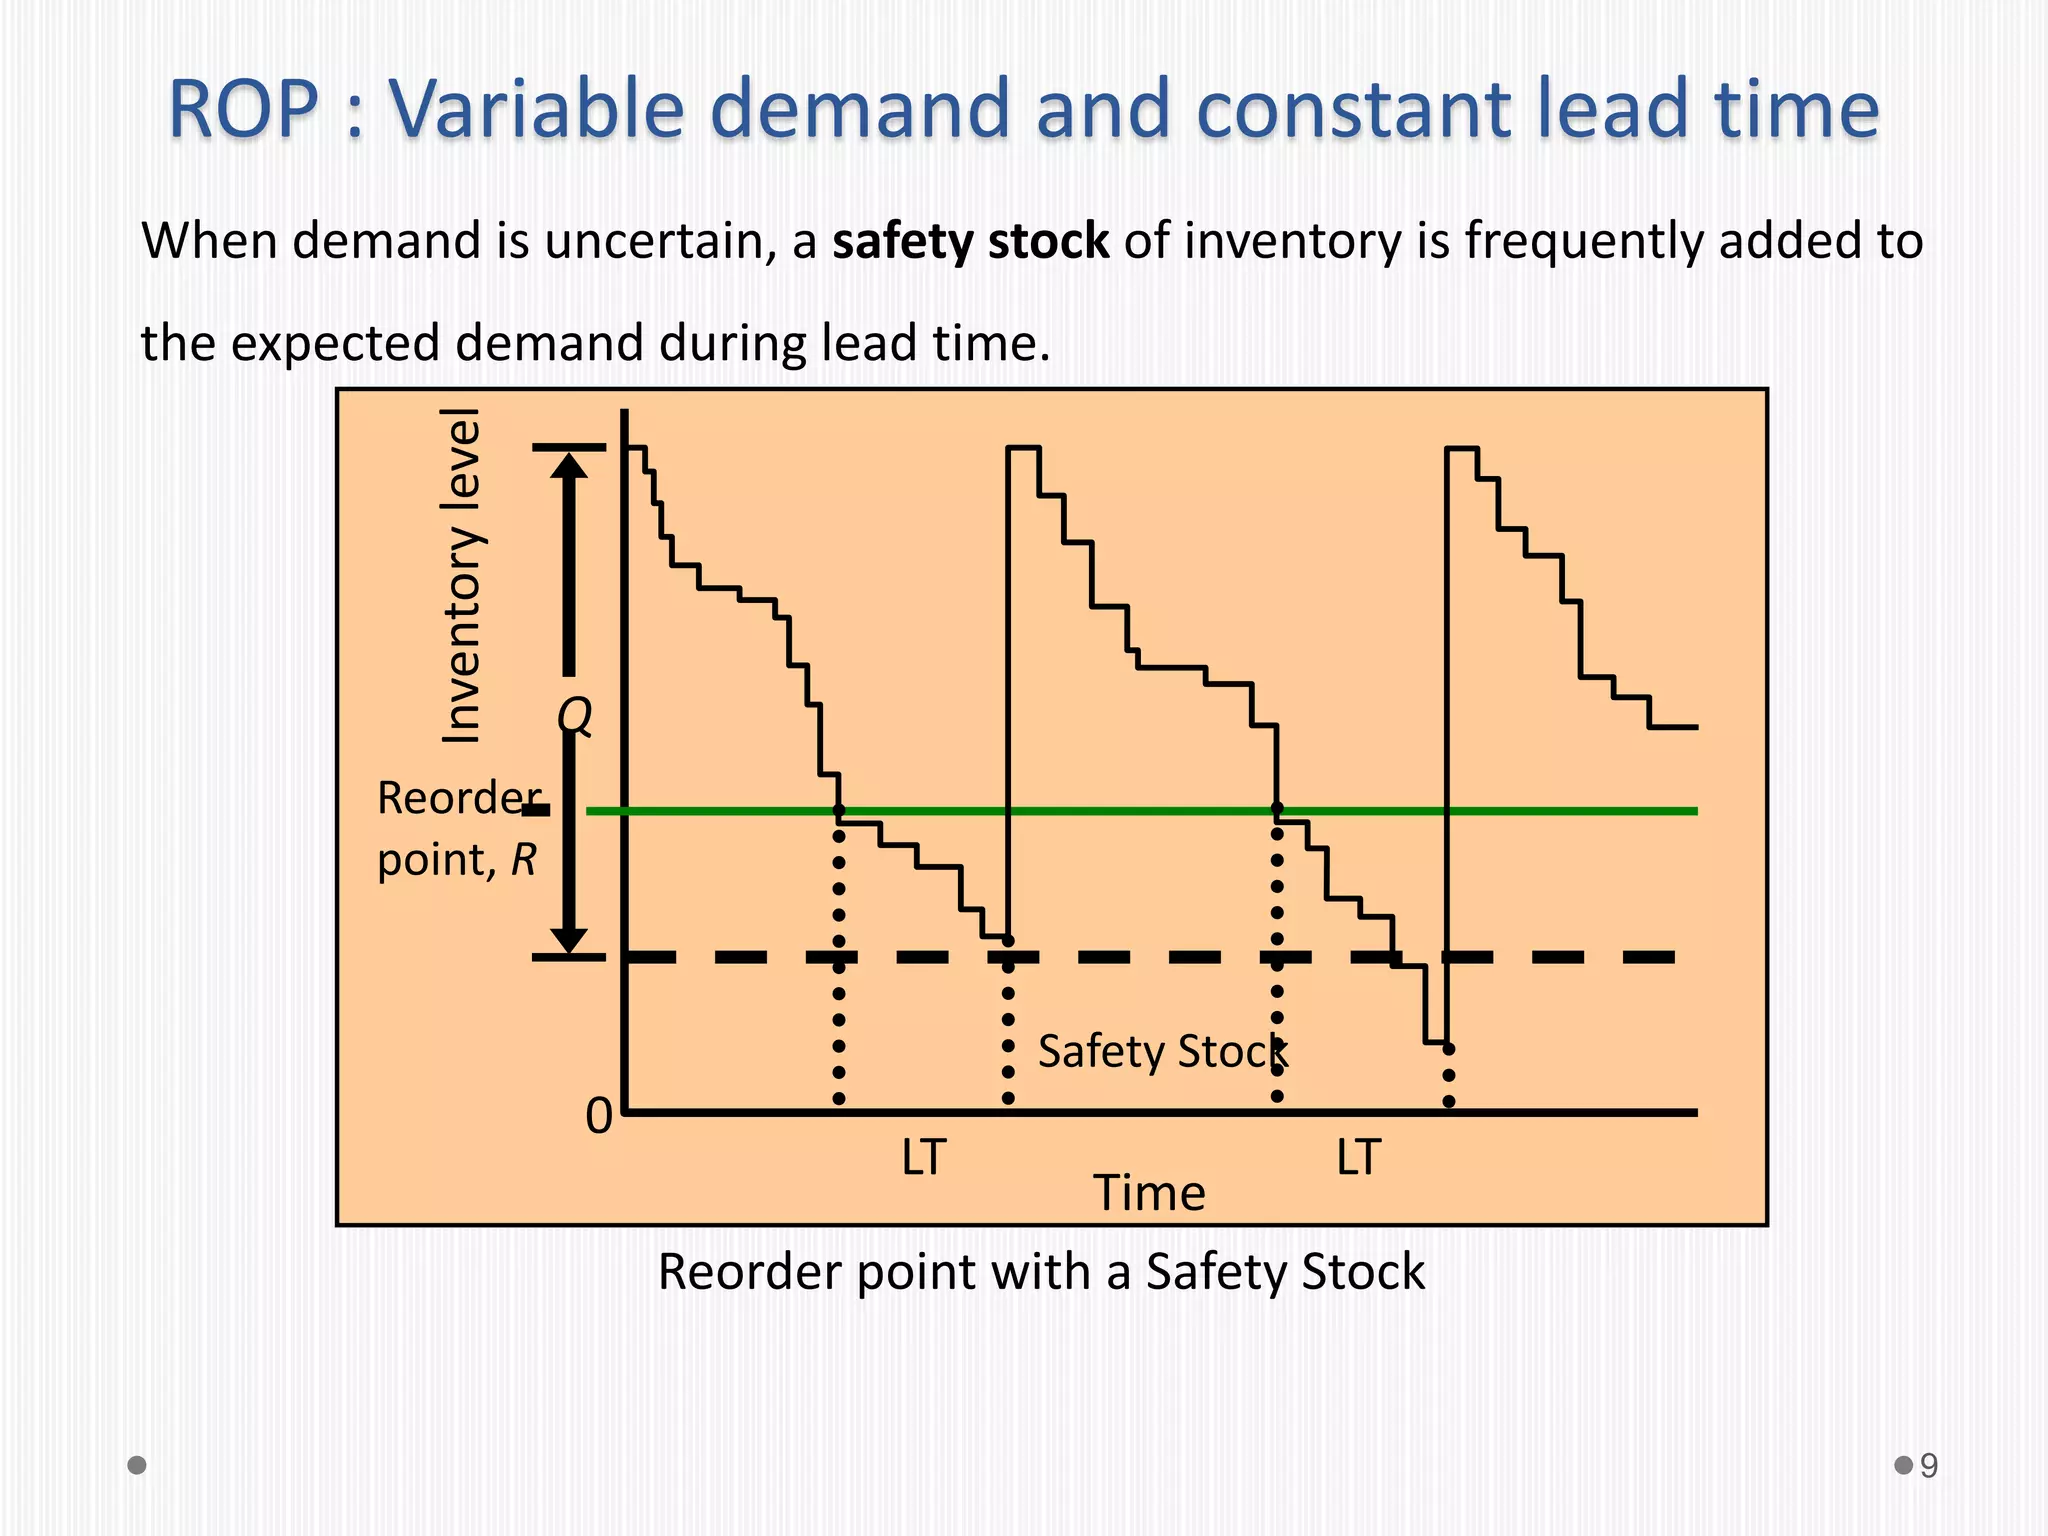
- 9. ROP : Variable demand and constant lead time When demand is uncertain, a safety stock of inventory is frequently added to the expected demand during lead time. Reorder point with a Safety Stock 9 Reorder point, R Q LT Time LT Inventorylevel 0 Safety Stock
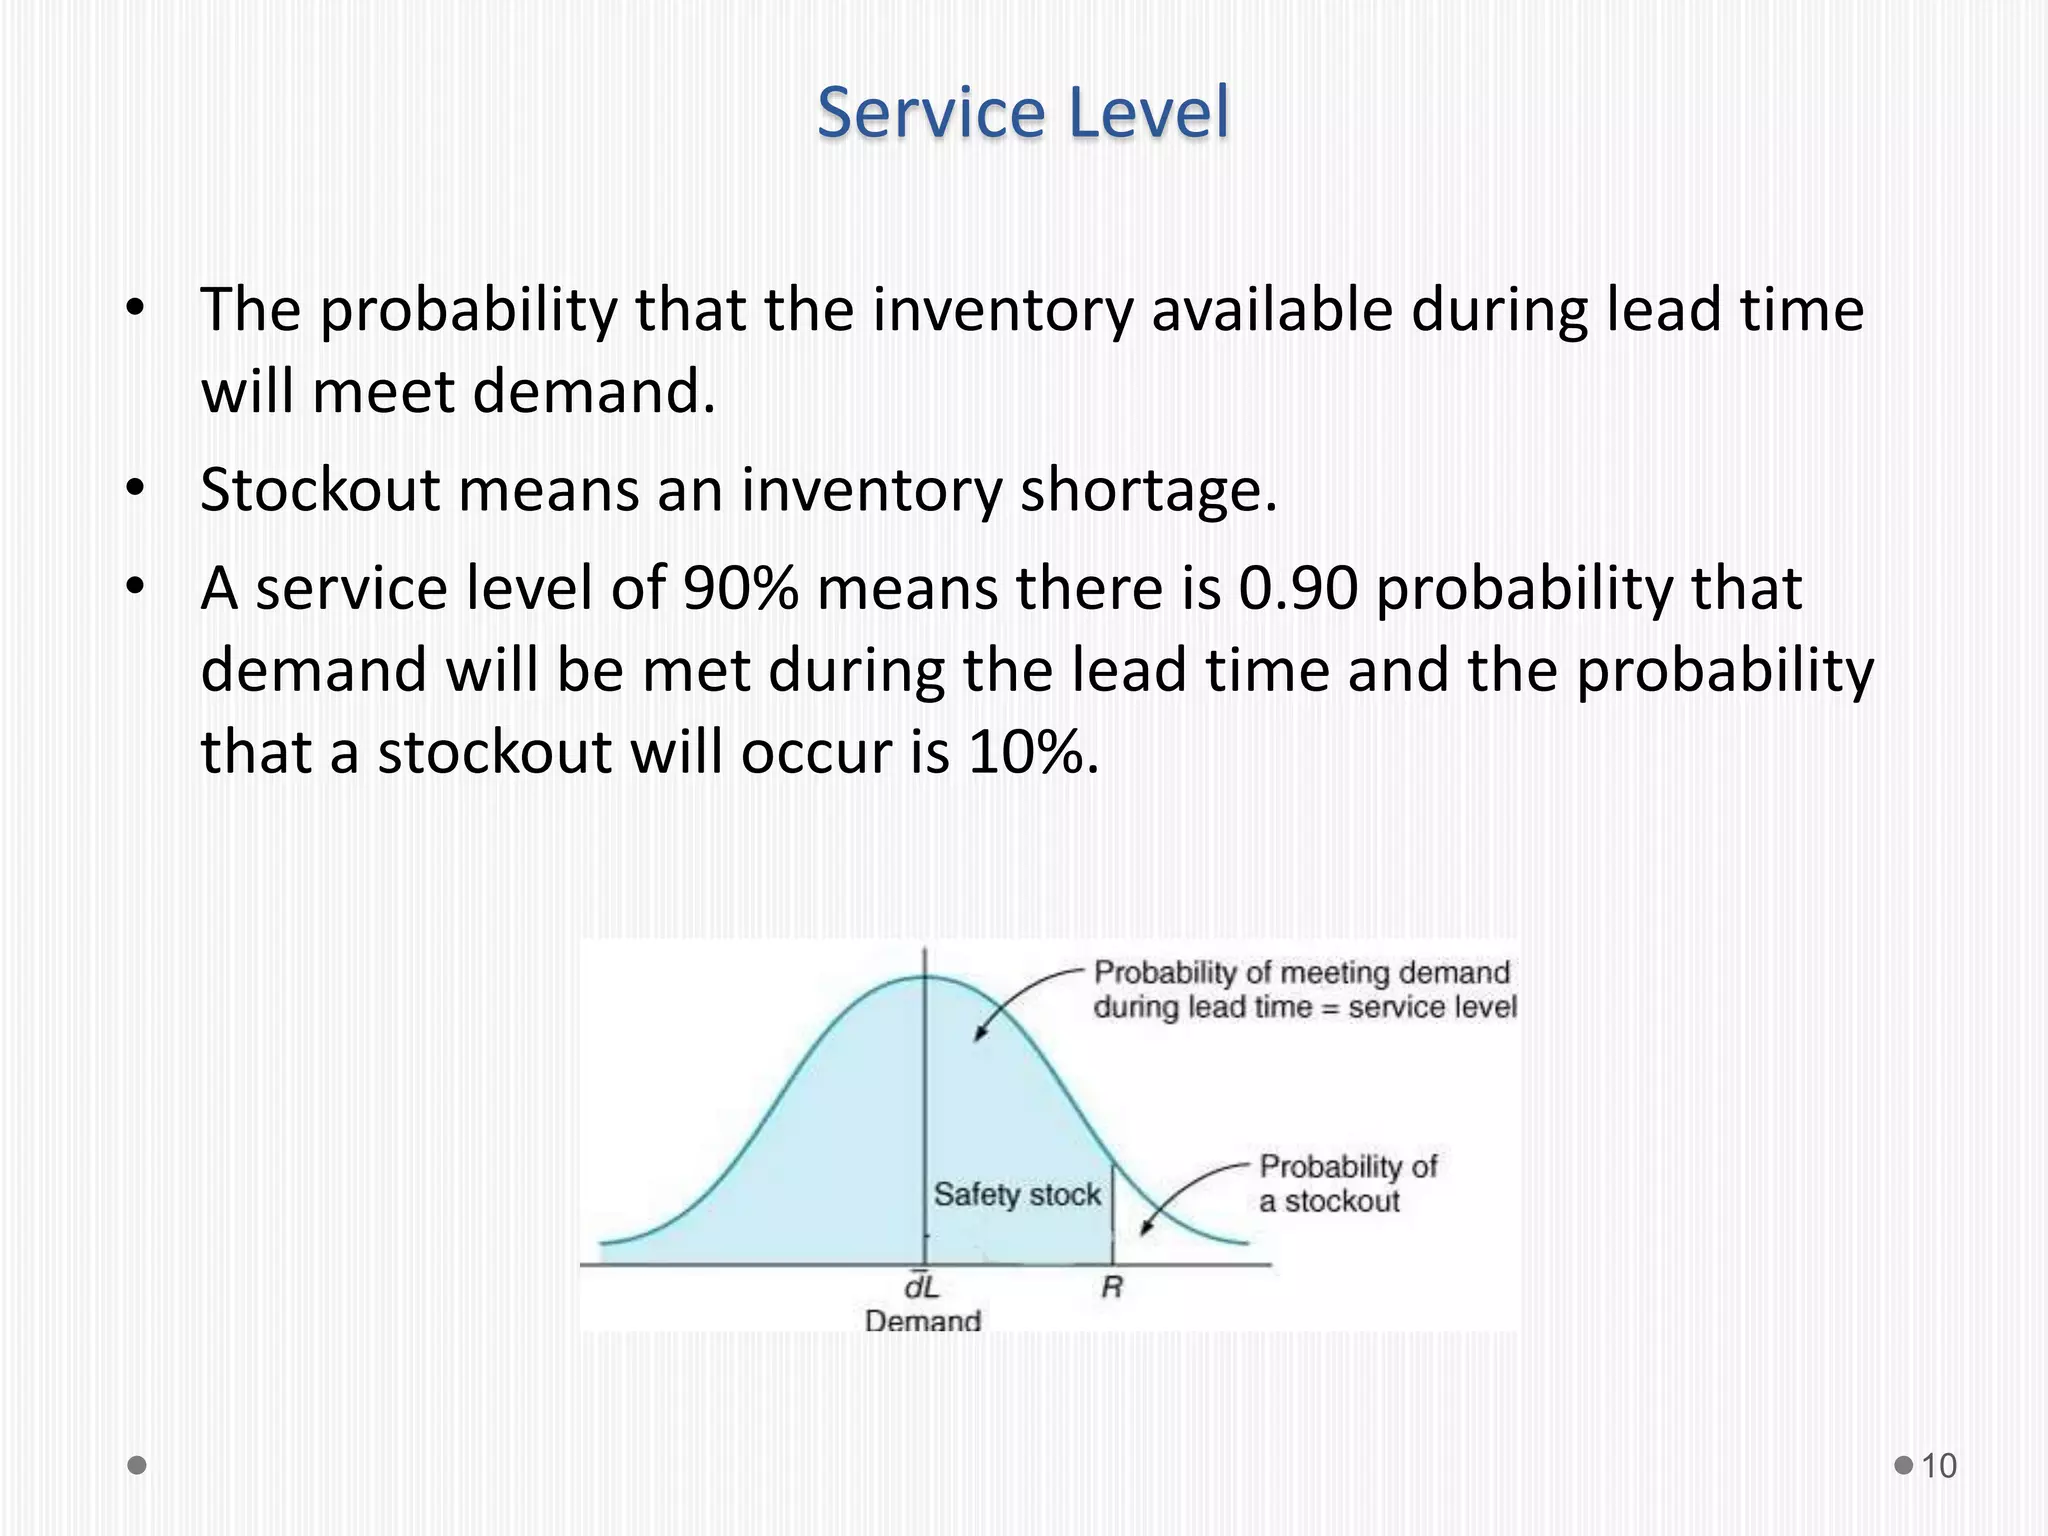
- 10. Service Level 10 • The probability that the inventory available during lead time will meet demand. • Stockout means an inventory shortage. • A service level of 90% means there is 0.90 probability that demand will be met during the lead time and the probability that a stockout will occur is 10%.
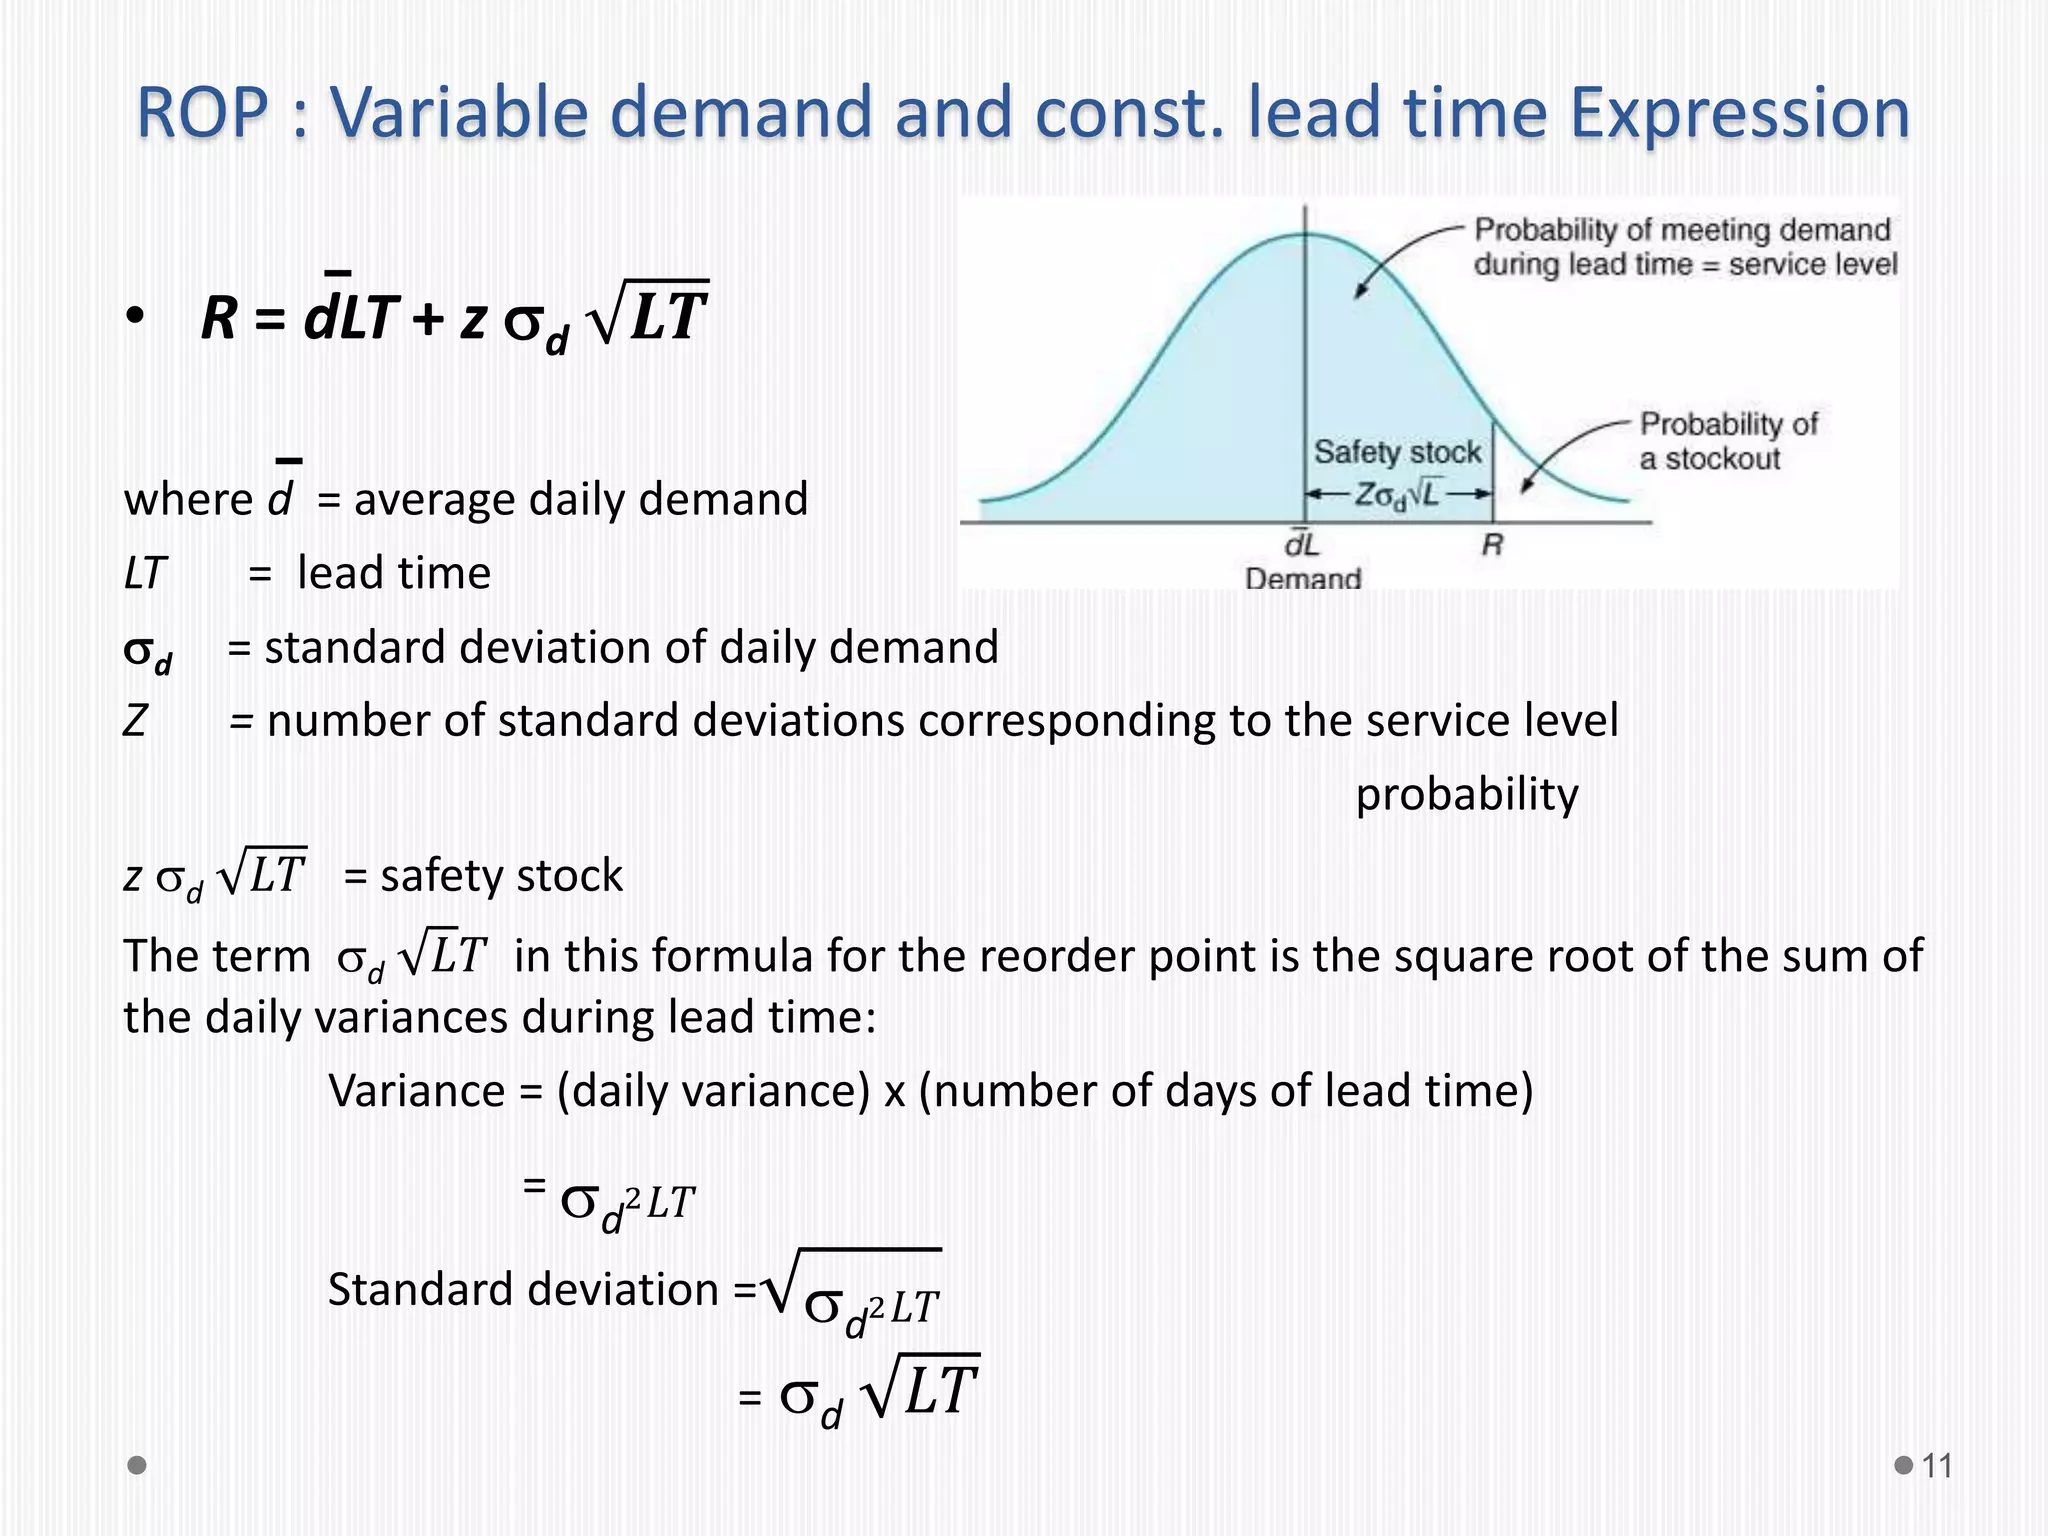
- 11. ROP : Variable demand and const. lead time Expression 11 • R = dLT + z d 𝑳𝑻 where d = average daily demand LT = lead time d = standard deviation of daily demand Z = number of standard deviations corresponding to the service level probability z d 𝐿𝑇 = safety stock The term d 𝐿𝑇 in this formula for the reorder point is the square root of the sum of the daily variances during lead time: Variance = (daily variance) x (number of days of lead time) = d 2 𝐿𝑇 Standard deviation = d2 𝐿𝑇 = d 𝐿𝑇
- 12. Problem 2 For ePaint internet store, assume that daily demand for Ironcoat paint is normally distributed with an average daily demand of 30 gallons and a standard deviation of 5 gallons of paint per day. The lead time for receiving a new order of paint is 10 days. Determine the reorder point and safety stock if the store wants a service level of 95% with the probability of a stock out equal to 5%. 12
- 13. Solution 13 d = 30 gallons per day LT = 10 days d = 5 gallons per day For a 95% service level, z = +1.65(from table Area under the standardized normal curve) Safety stock= z d 𝐿𝑇 = (1.65)(5)( 10 ) = 26.1 gallons R= dLT + z d 𝐿𝑇 = 30(10) + 26.1 = 326.1 gallons
- 14. ROP : Const. demand and Variable lead time Expression 14 If only lead time is variable, then dLT = dLT • R = dLT + zdLT where d = demand rate LT = average lead time LT = standard deviation of lead time Z = number of standard deviations corresponding to the service level probability
- 15. Problem 3 A motel uses approximately 600 bars of soap each day and this tends to be fairly constant. Lead time for soap delivery is normally distributed with a mean of six days and a standard deviation of two days. A service level of 90 percent is desire. a) Find the ROP. b) How many days of supply are on hand at the ROP? 15
- 16. Solution d = 600 bars per day SL = 90%, so z = 1.28 (from table Area under the standardized normal curve) LT = 6 days LT = 2 days a) R = dLT + zdLT = 600x(6) + 1.28x(600)x(2) = 5136 bars of soap b) No of Days = R/d =5136/600 = 8.56 days 16
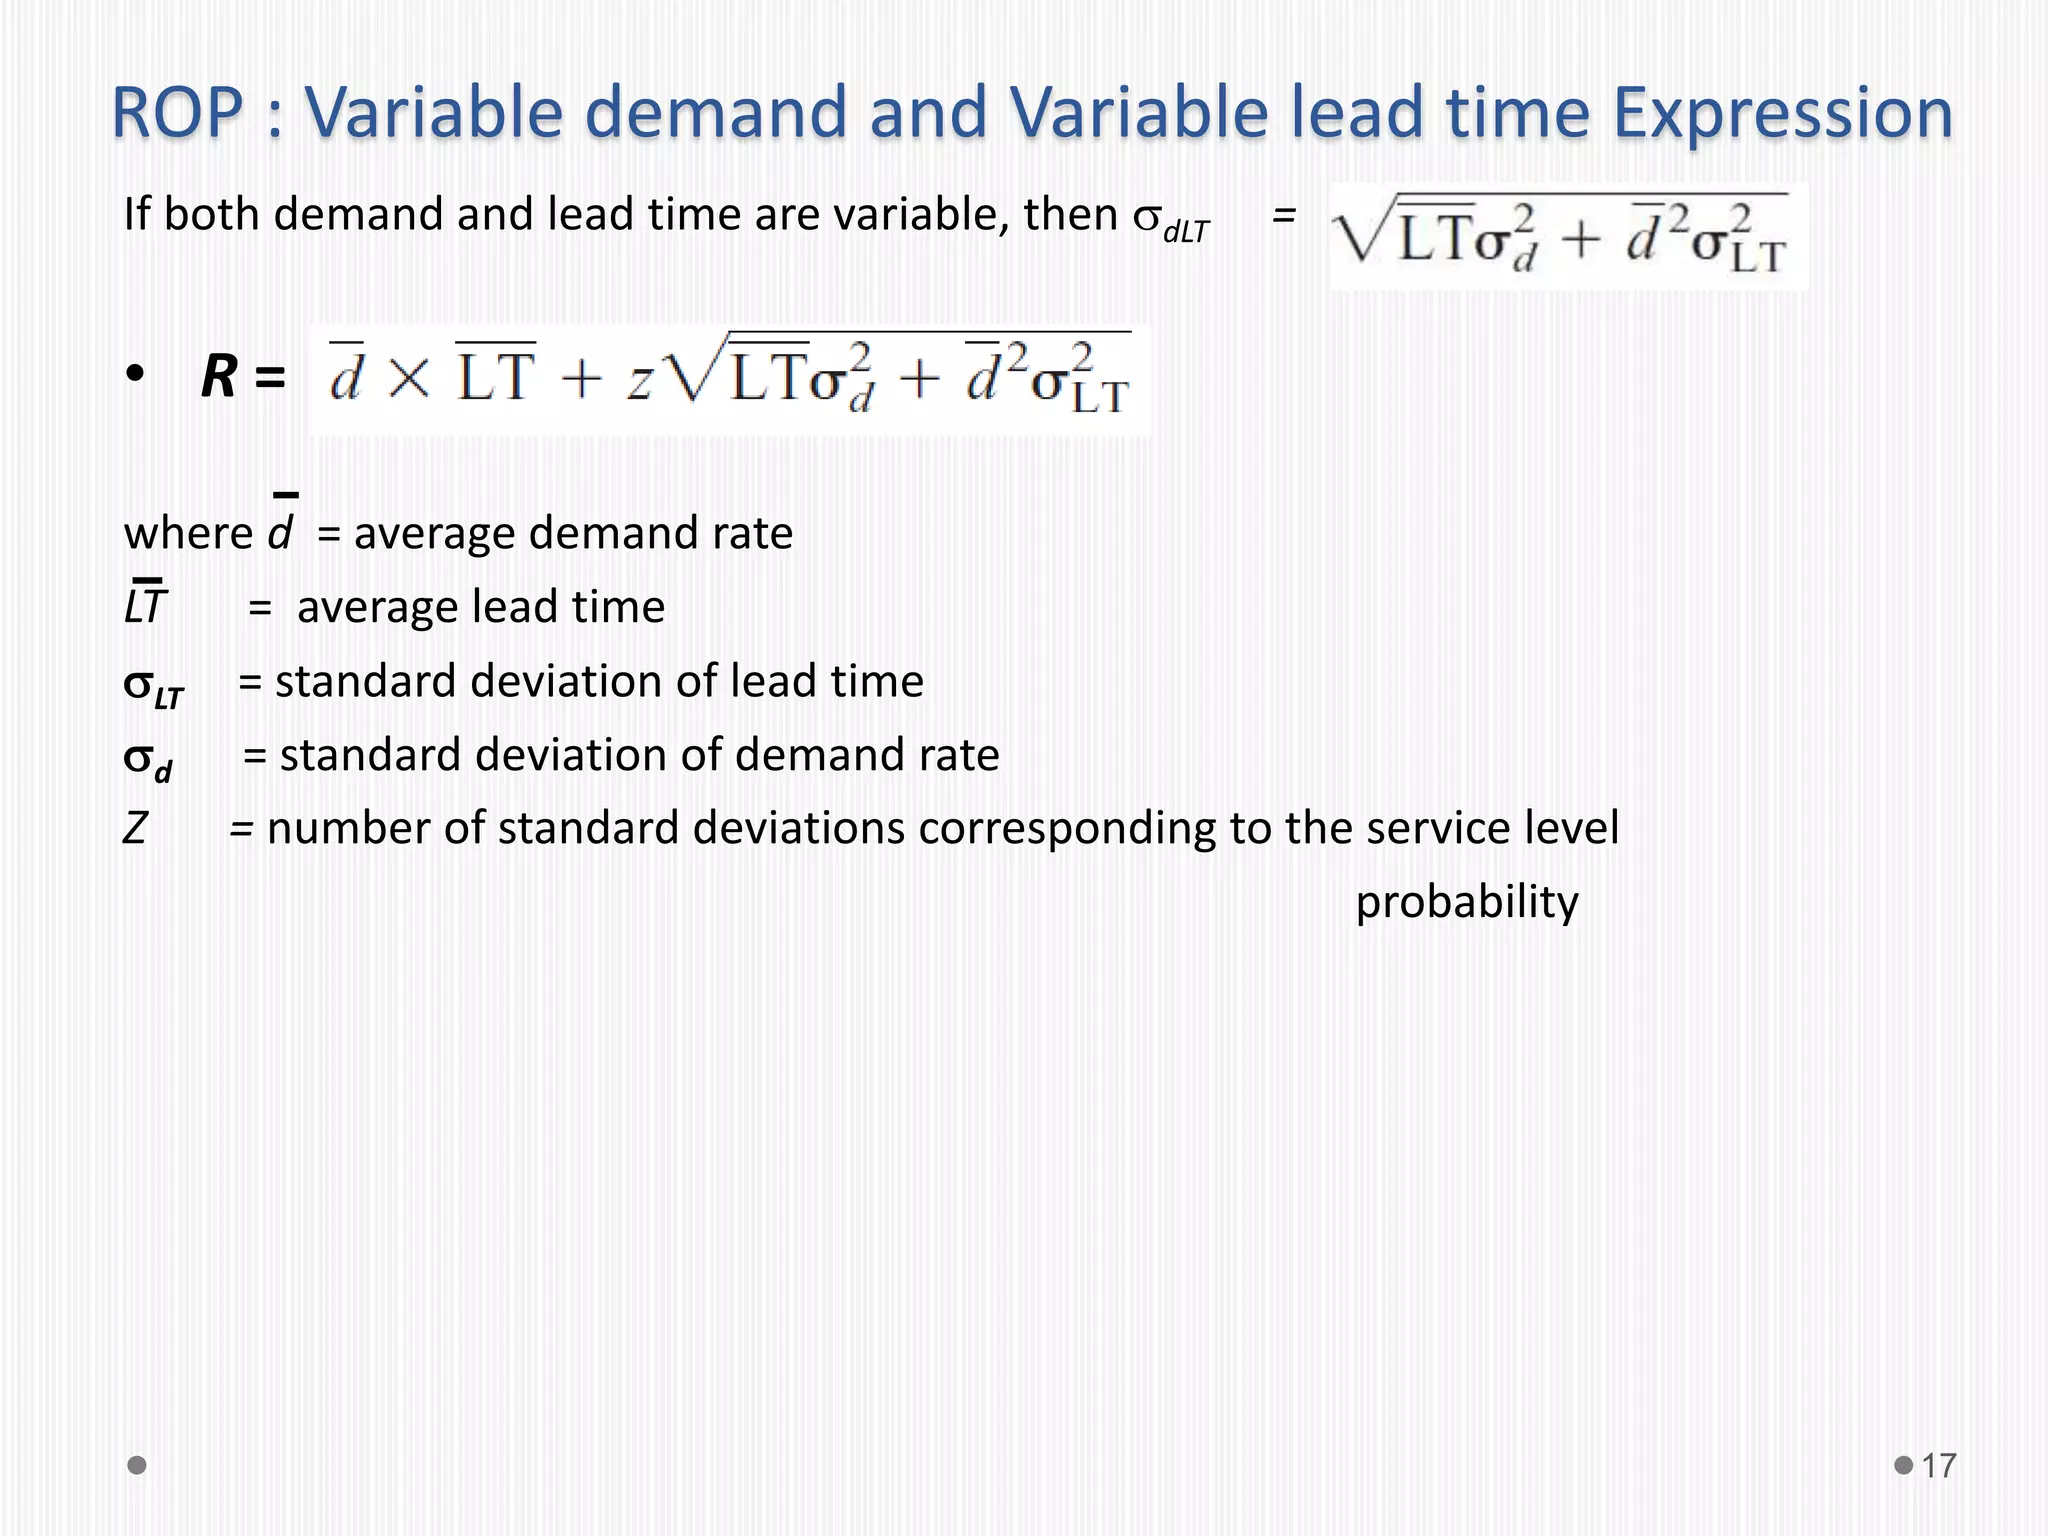
- 17. ROP : Variable demand and Variable lead time Expression 17 If both demand and lead time are variable, then dLT = • R = where d = average demand rate LT = average lead time LT = standard deviation of lead time d = standard deviation of demand rate Z = number of standard deviations corresponding to the service level probability
- 18. Problem 4 The motel replaces broken glasses at a rate of 25 per day. In the past, this quantity has tended to vary normally and have a standard deviation of 3 glasses per day. Glasses are ordered from a Cleveland supplier. Lead time is normally distributed with an average of 10 days and a standard deviation of 2 days. What ROP should be used to achieve a service level of 95 percent ? 18
- 19. Solution d = 25 glasses per day SL = 95%, so z = +1.65 (from table Area under the standardized normal curve) LT = 10 days LT = 2 days d = 3 glasses per day R = = 25(10) + 1.6 10 32 + (252)(22) = 334 glasses 19
- 20. Problem 5 A restaurant uses an average of 50 jars of a special sauce each week. Weekly usage of sauce has a standard deviation of 3 jars. The manager is willing to accept no more than a 10 percent risk of stockout during lead time, which is two weeks. Assume the distribution of usage is normal. a. Which of the above formulas is appropriate for this situation? Why? b. Determine the value of z. c. Determine the ROP. 20
- 21. Solution 21 d = 50 jars per week LT = 2 weeks d = 3 jars per week Acceptable risk = 10 percent, so service level is 0.90 a. Because only demand is variable(i.e has a standard deviation), formula R= dLT + z d 𝐿𝑇 is appropriate b. From table for service level 0.9000, z = +1.28 c. R = dLT + z d 𝐿𝑇 = 50(2) + 1.28(3) 2 = 105.43
- 22. How much to order: Fixed-order-interval model • Orders are placed at fixed time intervals • If demand is variable, the order size will tend to vary from cycle to cycle Two types : Fixed-quantity ordering Fixed-interval ordering 22
- 23. Determining the amount to order • If both the demand rate and lead time are constant, the fixed-interval model and the fixed-quantity model function identically. 23
- 24. Fixed-order-interval model : Expression OI = Order interval (length of time between orders) A = Amount on hand at reorder time 24
- 25. Problem 6 Given the following information, determine the amount to order. d = 30 units per day Desired service level = 99 percent d = 3 units per day Amount on hand at reorder time = 71 units LT = 2 days OI = 7 days 25
- 26. Solution z = 2.33 for 99 percent service level Amount to order = d(OI + LT) + z d 𝑂𝐼 + 𝐿𝑇 - A =30(7+2) + 2.33(3) 7 + 2 - 71 = 220 units 26
- 27. Problem 7 Given the following information, determine the amount to order. d = 10 units per day d = 2 units per day A = 43 units Q = 171 units LT = 4 days OI = 12 days • Determine the risk of a stockout at a. The end of the initial lead time. b. The end of the second lead time. 27
- 28. Solution a. R= dLT + z d 𝐿𝑇 43 =10x4 + z(2)(2) z =0.75 So from the table service level is 0.7734 The risk = 1-0.7734 = 0.2266, which is fairly high. b. Amount to order = d(OI + LT) + z d 𝑂𝐼 + 𝐿𝑇 - A 171=10(4+12) + z x (2) 12 + 4 - 43 Solving z = +6.75 This value is way out in the right tail of the normal distribution, making the service level virtually 100 percent and thus, the risk of a stockout at this point is essentially equal to zero. 28
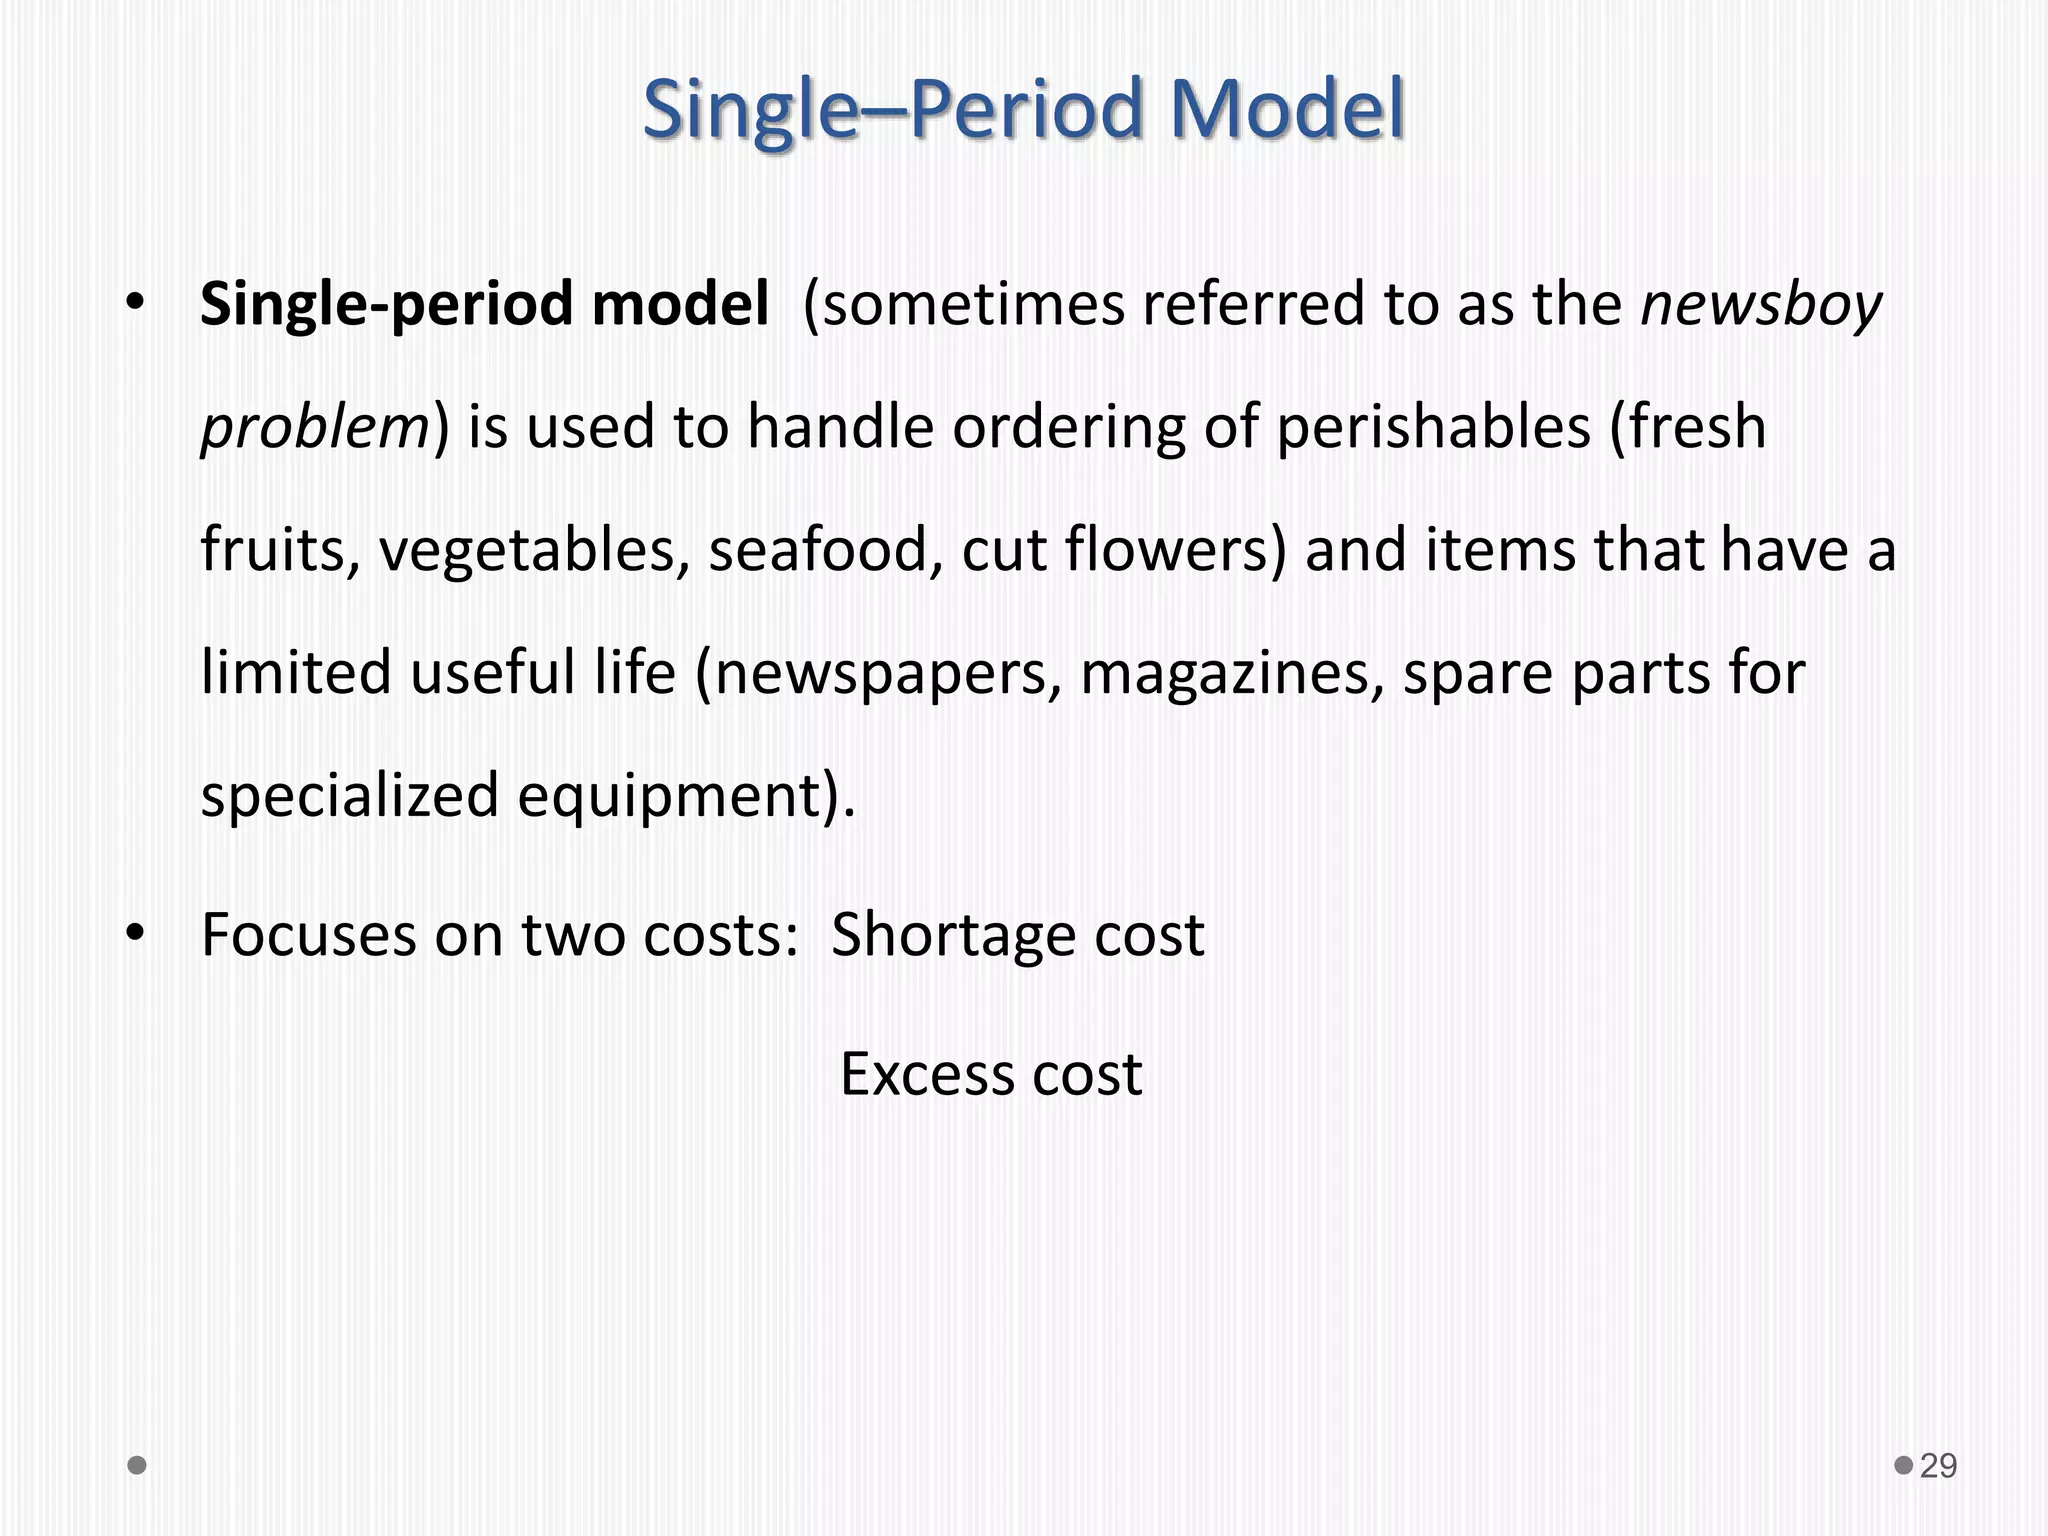
- 29. Single–Period Model • Single-period model (sometimes referred to as the newsboy problem) is used to handle ordering of perishables (fresh fruits, vegetables, seafood, cut flowers) and items that have a limited useful life (newspapers, magazines, spare parts for specialized equipment). • Focuses on two costs: Shortage cost Excess cost 29
- 30. Cont.… • Shortage cost may include a charge for loss of customer goodwill as well as the opportunity cost of lost sales. Generally, shortage cost is simply unrealized profit per unit. C shortage (Cs) = Revenue per unit - Cost per unit • Excess cost pertains to items left over at the end of the period. In effect, excess cost is the difference between purchase cost and salvage value. C excess (Ce) = Original cost per unit - Salvage value per unit 30
- 31. Continuous stocking levels • The stocking level equalizes the cost weights. • The service level is the probability that demand will not exceed the stocking level, and computation of the service level is the key to determining the optimal stocking level(So). Service level (SL)= Cs / ( Cs + Ce) Where Cs = shortage cost per unit Ce = excess cost per unit 31
- 32. Problem 8 Sweet cider is delivered weekly to Cindy’s Cider Bar. Demand varies uniformly between 300 liters and 500 liters per week. Cindy pays 20 cents per liter for the cider and charges 80 cents per liter for it. Unsold cider has no salvage value and cannot be carried over into the next week due to spoilage. Find the optimal stocking level and its stockout risk for that quantity. 32
- 33. Solution Ce = Cost per unit - Salvage value per unit =$0.20 - $0 =$0.20 per unit Cs = Revenue per – Cost per unit =$0.80 - $0.20 =$0.60 per unit SL = Cs / ( Cs + Ce) = 0.60/ ( 0.60 + 0.20) = 0.75 Thus, the optimal stocking level must satisfy demand 75 percent of the time. For the uniform distribution, this will be at a point equal to the minimum demand plus 75 percent of the difference between maximum and minimum demands So = 300 + .75(500 - 300) = 450 liters The stockout risk = 1-0.75 = 0.25 33
- 34. Problem 9 Cindy’s Cider Bar also sells a blend of cherry juice and apple cider. Demand for the blend is approximately normal, with a mean of 200 liters per week and a standard deviation of 10 liters per week. Cs= 60 cents per liter and Ce= 20 cents per liter. Find the optimal stocking level for the apple-cherry blend. 34
- 35. Solution SL = Cs / ( Cs + Ce) = 0.60/ ( 0.60 + 0.20) = 0.75 This indicates that 75 percent of the area under the normal curve must be to the left of the stocking level. The value of z is between 0.67 and 0.68, say, +0.675, will satisfy this. The optimal stocking level is So = mean + z So = 200 liters+ 0.675(10 liters) = 206.75 liters 35
- 36. Summary 36
- 37. 37