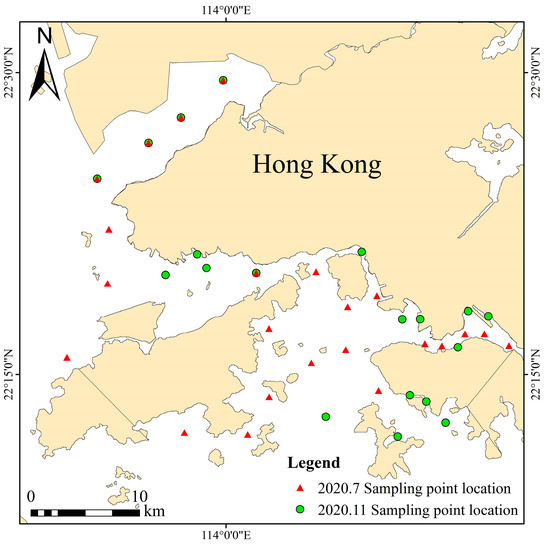
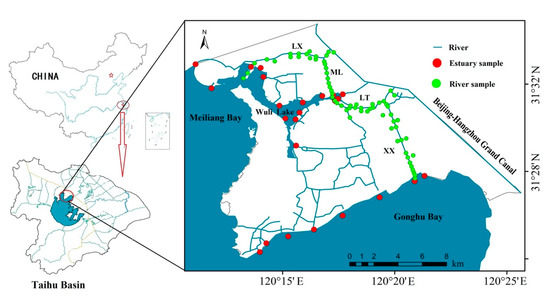
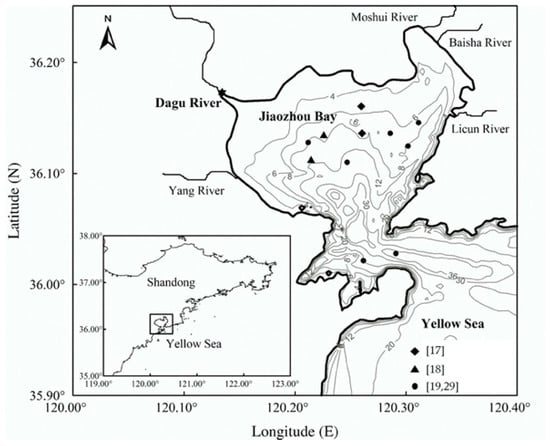
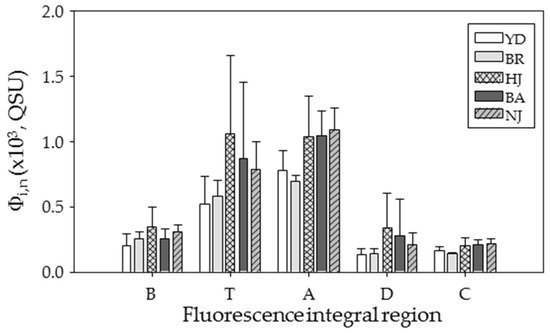
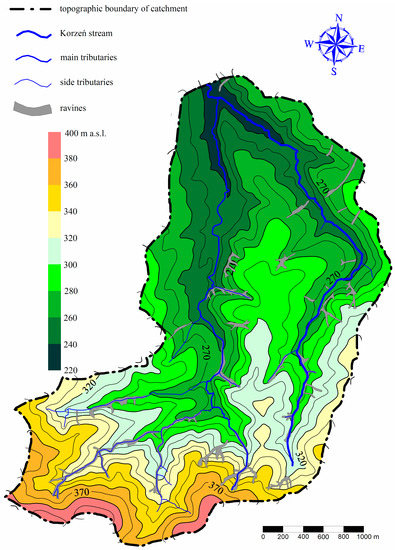
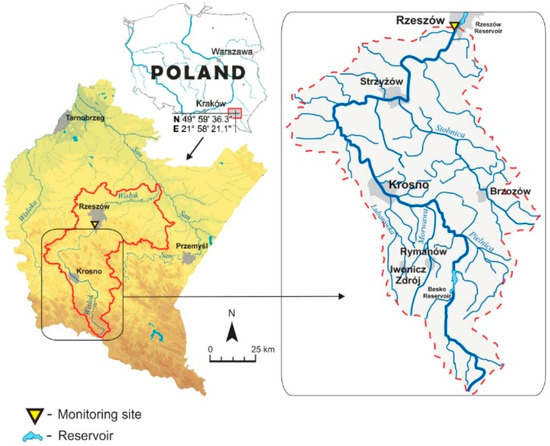
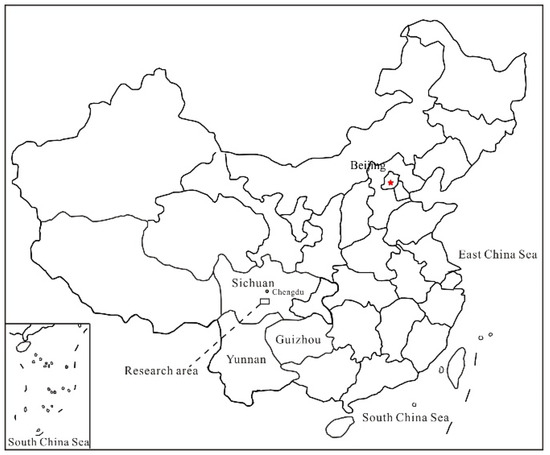
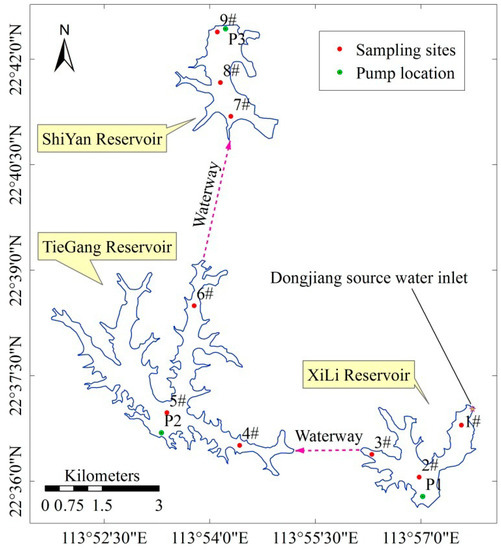
<p>Distribution of Sampling Points in the Study Area.</p> Full article ">Figure 2
<p>Chlorophyll-a Concentration at the Sampling Points.</p> Full article ">Figure 3
<p>Spectral Curves (<b>a</b>) Before and (<b>b</b>) After Radiometric Calibration.</p> Full article ">Figure 4
<p>Spectral Curves (<b>a</b>) Before and (<b>b</b>) After Atmospheric Correction.</p> Full article ">Figure 5
<p>Single-band Correlation Coefficient.</p> Full article ">Figure 6
<p>BP Neural Network Architecture Diagram.</p> Full article ">Figure 7
<p>Distribution of the R<sup>2</sup>, MSE, and ARV of All Models.</p> Full article ">Figure 8
<p>Neural Network Interpretation of Model 12.</p> Full article ">Figure 9
<p>Garson Diagram of Model 12.</p> Full article ">Figure 10
<p>Retrieval Results of the BP Neural Network Model and the Measured Values.</p> Full article ">Figure 11
<p>Chlorophyll-a Concentration Inversion Map of the Western Waters Near Hong Kong: (<b>a</b>) Chl-a Retrieval Concentration Distribution Map Obtained for July 2020 and (<b>b</b>) Chl-a Retrieval Concentration Distribution Map Obtained for November 2020.</p> Full article ">
