Materials 2024, 17(20), 4973; https://doi.org/10.3390/ma17204973 - 11 Oct 2024
Viewed by 883
Abstract
►
Show Figures
Leveraging the liquid-phase immiscibility effect and phase diagram calculations, a sequence of alloy powders with varying Fe content was designed and fabricated utilizing the gas atomization method. Microstructural characterizations, employing SEM, EDS, and XRD analyses, revealed the successful formation of an incomplete shell
[...] Read more.
Leveraging the liquid-phase immiscibility effect and phase diagram calculations, a sequence of alloy powders with varying Fe content was designed and fabricated utilizing the gas atomization method. Microstructural characterizations, employing SEM, EDS, and XRD analyses, revealed the successful formation of an incomplete shell on the surfaces of Al-Bi-Fe powders, obviating the need for Sn doping. This study systematically investigated the microstructure, hydrolysis performance, and hydrolysis process of these alloys in deionized water. Notably, Al-10Bi-7Fe exhibited the highest hydrogen production, reaching 961.0 NmL/g, while Al-10Bi-10Fe demonstrated the peak conversion rate at 92.99%. The hydrolysis activation energy of each Al-Bi-Fe alloy powder was calculated using the Arrhenius equation, indicating that a reduction in activation energy was achieved through Fe doping.
Full article

Figure 1
Figure 1
<p>The schematic experimental setup for the hydrolysis test.</p> Full article ">Figure 2
<p>(<b>a</b>) Calculated vertical phase diagrams of Al-10Bi-Fe (wt.%); (<b>b</b>–<b>d</b>) calculated phase fractions diagrams of Al-10Bi-(3, 7, 10) Fe (wt.%).</p> Full article ">Figure 3
<p>SEM images at various magnifications of as-atomized Al-Bi-Fe alloy powders: (<b>a</b>–<b>a<sub>2</sub></b>) Al-10Bi-3Fe (wt.%); (<b>b</b>–<b>b<sub>2</sub></b>) Al-10Bi-7Fe (wt.%); and (<b>c</b>–<b>c<sub>2</sub></b>) Al-10Bi-10Fe (wt.%).</p> Full article ">Figure 4
<p>EDS analysis of the cross-section of the Al-Bi-Fe alloy powders: (<b>a</b>) Al-10Bi-3Fe, with element distributions: (<b>a<sub>1</sub></b>) Al; (<b>a<sub>2</sub></b>) Bi; (<b>a<sub>3</sub></b>) Fe; (<b>b</b>) Al-10Bi-7Fe (wt.%), with element distributions: (<b>b<sub>1</sub></b>) Al; (<b>b<sub>2</sub></b>) Bi; (<b>b<sub>3</sub></b>) Fe; (<b>c</b>) Al-10Bi-10Fe (wt.%), with element distributions: (<b>c<sub>1</sub></b>) Al; (<b>c<sub>2</sub></b>) Bi; (<b>c<sub>3</sub></b>) Fe.</p> Full article ">Figure 5
<p>XRD patterns of the as-atomized Al-Bi-Fe alloy powders (<b>a</b>) separated XRD patterns; (<b>b</b>) stacked patterns focusing on the Al (111) peak.</p> Full article ">Figure 6
<p>Charts of the hydrolysis of Al-Bi-Fe variations using deionized water at different reaction temperatures ranging from 30 to 50 °C: (<b>a</b>) the hydrogen yield vs. time curve; (<b>b</b>) the conversion rate.</p> Full article ">Figure 7
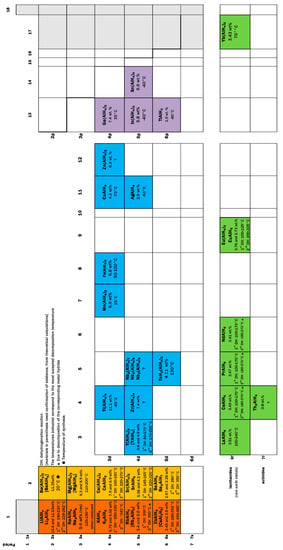
<p>Cost and hydrolysis performance for various active Al alloys: (1) red area indicates Ga, In, Sn doping alloys; (2) yellow area indicates Ga, In-free alloys; and (3) green area indicates Sn-free alloys. The data are drawn from references [<a href="#B23-materials-17-04973" class="html-bibr">23</a>,<a href="#B24-materials-17-04973" class="html-bibr">24</a>,<a href="#B26-materials-17-04973" class="html-bibr">26</a>,<a href="#B27-materials-17-04973" class="html-bibr">27</a>,<a href="#B29-materials-17-04973" class="html-bibr">29</a>,<a href="#B30-materials-17-04973" class="html-bibr">30</a>].</p> Full article ">Figure 8
<p>Plots of the hydrolysis of the Al-Bi-Fe variations using deionized water at different reaction temperatures ranging from 30 to 50 °C (<b>a</b>) hydrogen yield rates vs. time curves, (<b>b</b>) the Arrhenius plots.</p> Full article ">Figure 9
<p>SEM images of the hydrolysis products of Al-Bi-Fe variations using deionized water at different reaction temperatures ranging from 30 to 50 °C.</p> Full article ">Figure 10
<p>The morphological changes on the surface of Al-Bi-Fe alloy powders at different stages of the hydrolysis process, along with a schematic representation of the reaction mechanism.</p> Full article ">
<p>The schematic experimental setup for the hydrolysis test.</p> Full article ">Figure 2
<p>(<b>a</b>) Calculated vertical phase diagrams of Al-10Bi-Fe (wt.%); (<b>b</b>–<b>d</b>) calculated phase fractions diagrams of Al-10Bi-(3, 7, 10) Fe (wt.%).</p> Full article ">Figure 3
<p>SEM images at various magnifications of as-atomized Al-Bi-Fe alloy powders: (<b>a</b>–<b>a<sub>2</sub></b>) Al-10Bi-3Fe (wt.%); (<b>b</b>–<b>b<sub>2</sub></b>) Al-10Bi-7Fe (wt.%); and (<b>c</b>–<b>c<sub>2</sub></b>) Al-10Bi-10Fe (wt.%).</p> Full article ">Figure 4
<p>EDS analysis of the cross-section of the Al-Bi-Fe alloy powders: (<b>a</b>) Al-10Bi-3Fe, with element distributions: (<b>a<sub>1</sub></b>) Al; (<b>a<sub>2</sub></b>) Bi; (<b>a<sub>3</sub></b>) Fe; (<b>b</b>) Al-10Bi-7Fe (wt.%), with element distributions: (<b>b<sub>1</sub></b>) Al; (<b>b<sub>2</sub></b>) Bi; (<b>b<sub>3</sub></b>) Fe; (<b>c</b>) Al-10Bi-10Fe (wt.%), with element distributions: (<b>c<sub>1</sub></b>) Al; (<b>c<sub>2</sub></b>) Bi; (<b>c<sub>3</sub></b>) Fe.</p> Full article ">Figure 5
<p>XRD patterns of the as-atomized Al-Bi-Fe alloy powders (<b>a</b>) separated XRD patterns; (<b>b</b>) stacked patterns focusing on the Al (111) peak.</p> Full article ">Figure 6
<p>Charts of the hydrolysis of Al-Bi-Fe variations using deionized water at different reaction temperatures ranging from 30 to 50 °C: (<b>a</b>) the hydrogen yield vs. time curve; (<b>b</b>) the conversion rate.</p> Full article ">Figure 7
<p>Cost and hydrolysis performance for various active Al alloys: (1) red area indicates Ga, In, Sn doping alloys; (2) yellow area indicates Ga, In-free alloys; and (3) green area indicates Sn-free alloys. The data are drawn from references [<a href="#B23-materials-17-04973" class="html-bibr">23</a>,<a href="#B24-materials-17-04973" class="html-bibr">24</a>,<a href="#B26-materials-17-04973" class="html-bibr">26</a>,<a href="#B27-materials-17-04973" class="html-bibr">27</a>,<a href="#B29-materials-17-04973" class="html-bibr">29</a>,<a href="#B30-materials-17-04973" class="html-bibr">30</a>].</p> Full article ">Figure 8
<p>Plots of the hydrolysis of the Al-Bi-Fe variations using deionized water at different reaction temperatures ranging from 30 to 50 °C (<b>a</b>) hydrogen yield rates vs. time curves, (<b>b</b>) the Arrhenius plots.</p> Full article ">Figure 9
<p>SEM images of the hydrolysis products of Al-Bi-Fe variations using deionized water at different reaction temperatures ranging from 30 to 50 °C.</p> Full article ">Figure 10
<p>The morphological changes on the surface of Al-Bi-Fe alloy powders at different stages of the hydrolysis process, along with a schematic representation of the reaction mechanism.</p> Full article ">