Nothing Special   »   [go: up one dir, main page]

You seem to have javascript disabled. Please note that many of the page functionalities won't work as expected without javascript enabled.
 
 
ijerph-logo

Journal Browser

Journal Browser

Sports Medicine and Physical Fitness (Closed)

Printed Edition Available!
A printed edition of this Special Issue is available here.

Editors


E-Mail Website
Collection Editor
Department of Psychology, Educational Science and Human Movement, University of Palermo, Palermo, Italy
Interests: physical activity; injury prevention; human movement; resistance training; stretching, osteopathy.
Special Issues, Collections and Topics in MDPI journals

E-Mail Website
Collection Editor
Department of Human Sciences and Promotion of the Quality of Life, San Raffaele Open University, Rome, Italy
Interests: physical activity; injury prevention; human movement; training; health promotion; quality of life

E-Mail Website
Collection Editor
Research Group in Prevention and Health in Exercise and Sport (PHES), Department of Physical Education and Sports, University of Valencia, 46010 Valencia, Spain
Interests: pediatric exercise science; blood flow restriction; resistance training; clinical exercise
Special Issues, Collections and Topics in MDPI journals

Topical Collection Information

Dear Colleagues,

A growing body of literature demonstrates that human movement, structured exercise, and sport play an important role in maintaining and improving health as a preventive factor in a large number of diseases. The benefits of physical activity have been noted across the lifespan with effects that go beyond the musculoskeletal and cardiovascular system for sport and athletic performance. These pleiotropic effects can either be preventive, such as those applied to chronic metabolic conditions (i.e., diabetes mellitus, metabolic syndrome), or applied to prevent the occurrence of injuries in sports performance. Human movement programs are also applied to improve one’s strength, endurance, and mobility to improve independence in older adults, leading to athletic development, increased physical fitness, and a reduction in a wide variety of aging hallmarks, including those that reduce the fragility phenotype.

This Topical Collection seeks papers with novel, current, original work, in any subject related to sports medicine, physical fitness, and human movement. Different populations (i.e., age groups, fitness level, and pathologies) will be considered. A special emphasis will be placed on articles that analyze the effects of movement for health improvement or injury prevention. The keywords listed below provide an outline of some of the possible areas of interest. All manuscripts will be peer-reviewed by experts in the field and held to the highest level of academic and scientific integrity.

Dr. Ewan Thomas
Prof. Dr. Elvira Padua
Prof. Dr. Ivan Chulvi-Medrano
Collection Editors

Manuscript Submission Information

Manuscripts should be submitted online at www.mdpi.com by registering and logging in to this website. Once you are registered, click here to go to the submission form. Manuscripts can be submitted until the deadline. All submissions that pass pre-check are peer-reviewed. Accepted papers will be published continuously in the journal (as soon as accepted) and will be listed together on the collection website. Research articles, review articles as well as short communications are invited. For planned papers, a title and short abstract (about 100 words) can be sent to the Editorial Office for announcement on this website.

Submitted manuscripts should not have been published previously, nor be under consideration for publication elsewhere (except conference proceedings papers). All manuscripts are thoroughly refereed through a single-blind peer-review process. A guide for authors and other relevant information for submission of manuscripts is available on the Instructions for Authors page. International Journal of Environmental Research and Public Health is an international peer-reviewed open access monthly journal published by MDPI.

Please visit the Instructions for Authors page before submitting a manuscript. The Article Processing Charge (APC) for publication in this open access journal is 2500 CHF (Swiss Francs). Submitted papers should be well formatted and use good English. Authors may use MDPI's English editing service prior to publication or during author revisions.

Keywords

  • Sports medicine
  • Physical fitness
  • Human movement
  • Physical activity and health
  • Health promotion
  • Injury prevention
  • Quality of life
  • Exercise prescription
  • Clinical populations

Published Papers (28 papers)

2022

Jump to: 2021, 2020

8 pages, 617 KiB  
Article
COVID-19 as a Potential Cause of Muscle Injuries in Professional Italian Serie A Soccer Players: A Retrospective Observational Study
by Giuseppe Annino, Vincenzo Manzi, Anas Radi Alashram, Cristian Romagnoli, Mattia Coniglio, Niloofar Lamouchideli, Marco Alfonso Perrone, Dolores Limongi and Elvira Padua
Int. J. Environ. Res. Public Health 2022, 19(17), 11117; https://doi.org/10.3390/ijerph191711117 - 5 Sep 2022
Cited by 7 | Viewed by 2824
Abstract
The COVID-19 pandemic has shocked the entire planet. The soccer world has also suffered major upheavals, and many professional soccer players have been infected with the virus. The aim of this study was to evaluate the incidence of injuries in Italian Serie A [...] Read more.
The COVID-19 pandemic has shocked the entire planet. The soccer world has also suffered major upheavals, and many professional soccer players have been infected with the virus. The aim of this study was to evaluate the incidence of injuries in Italian Serie A professional soccer players before and during the COVID-19 pandemic. Methods: We evaluated the incidence of muscle injuries between four competitive seasons of the Italian Serie A (2016–2017, 2017–2018, and 2018–2019 pre-COVID-19 vs. 2020/2021 post-COVID-19) in professional soccer players. Results: Significant differences were found in muscular injuries between the post-COVID-19 season and the previous seasons (p < 0.001). The median split of the players’ positivity duration was of 15 days. The players’ long positivity (PLP) group showed a significant number of muscular injuries compared to the players’ short positivity (PSP) group (p < 0.0014, ES = 0.81, Large). The total teams’ days of positivity were significantly related to the total team number of muscular injuries (r = 0.86; CI 95% 0.66 to 0.94; p < 0.0001). In conclusion, this data showed that the competitive season post-COVID-19 lockdown has a higher incidence of muscle injuries in Italian Serie A soccer players compared to the pre-pandemic competitive season. Full article
Show Figures

Figure 1

Figure 1
<p>Relationship between teams’ total days of positivity and teams’ total number of injuries (r = 0.86; CI 95% 0.66 to 0.94; <italic>p</italic> &lt; 0.0001).</p>
Full article ">
3 pages, 289 KiB  
Editorial
Physical Exercise for Health and Performance Post-Pandemic COVID-19 Era, a Renewed Emphasis on Public Health
by Iván Chulvi-Medrano, Ewan Thomas and Elvira Padua
Int. J. Environ. Res. Public Health 2022, 19(11), 6475; https://doi.org/10.3390/ijerph19116475 - 26 May 2022
Cited by 4 | Viewed by 1907
Abstract
After the period of forced quarantine due to the COVID-19 epidemic, the physiological principle of detraining became more evident than ever [...] Full article
14 pages, 1351 KiB  
Article
Full-Face Mask Use during SCUBA Diving Counters Related Oxidative Stress and Endothelial Dysfunction
by Morgan Levenez, Kate Lambrechts, Simona Mrakic-Sposta, Alessandra Vezzoli, Peter Germonpré, Hadrien Pique, Fabio Virgili, Gerardo Bosco, Pierre Lafère and Costantino Balestra
Int. J. Environ. Res. Public Health 2022, 19(2), 965; https://doi.org/10.3390/ijerph19020965 - 15 Jan 2022
Cited by 8 | Viewed by 3917
Abstract
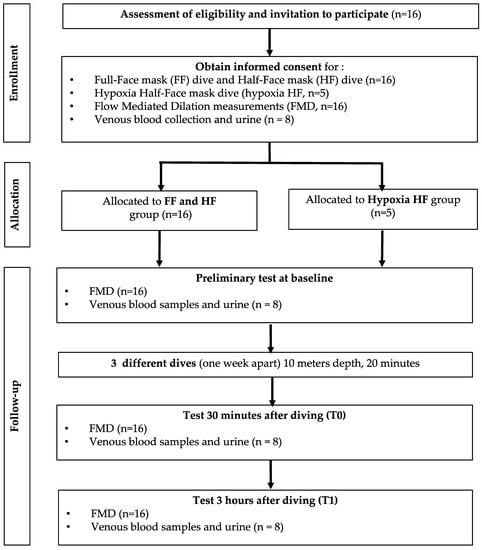
Impaired flow mediated dilation (FMD), an index of vascular stress, is known after SCUBA diving. This is related to a dysfunction of nitric oxide (NO) availability and a disturbance of the redox status, possibly induced by hyperoxic/hyperbaric gas breathing. SCUBA diving is usually [...] Read more.
Impaired flow mediated dilation (FMD), an index of vascular stress, is known after SCUBA diving. This is related to a dysfunction of nitric oxide (NO) availability and a disturbance of the redox status, possibly induced by hyperoxic/hyperbaric gas breathing. SCUBA diving is usually performed with a mask only covering “half face” (HF) and therefore forcing oral breathing. Nasal NO production is involved in vascular homeostasis and, as consequence, can significantly reduce NO possibly promoting vascular dysfunction. More recently, the utilization of “full-face” (FF) mask, allowing nasal breathing, became more frequent, but no reports are available describing their effects on vascular functions in comparison with HF masks. In this study we assessed and compared the effects of a standard shallow dive (20 min at 10 m) wearing either FF or a HF mask on different markers of vascular function (FMD), oxidative stress (ROS, 8-iso-PGF2α) and NO availability and metabolism (NO2, NOx and 3-NT and iNOS expression). Data from a dive breathing a hypoxic (16% O2 at depth) gas mixture with HF mask are shown allowing hyperoxic/hypoxic exposure. Our data suggest that nasal breathing might significantly reduce the occurrence of vascular dysfunction possibly due to better maintenance of NO production and bioavailability, resulting in a better ability to counter reactive oxygen and nitrogen species. Besides the obvious outcomes in terms of SCUBA diving safety, our data permit a better understanding of the effects of oxygen concentrations, either in normal conditions or as a strategy to induce selected responses in health and disease. Full article
Show Figures

Figure 1

Figure 1
<p>Flowchart of the experimental protocol.</p>
Full article ">Figure 2
<p>Flow mediated dilation (FMD) changes after a dive (10 m for 20 min) either wearing a full-face mask or a classical “half-face” diving mask (<span class="html-italic">n</span> = 16). In hypoxic dives (<span class="html-italic">n</span> = 5), subjects were breathing a gas mixture providing 0.16 ATA of PO<sub>2</sub> at depth. FMD changes are expressed as % of predive values, every diver acting as his own control. Results are expressed as percentage (mean ± SD); NS = nonsignificant.</p>
Full article ">Figure 3
<p>Panels show the histogram plot (mean ± SD) of (<b>A</b>) ROS production (EPR), and (<b>B</b>) 8-iso PGF2-α concentration (ELISA). * <span class="html-italic">p</span> &lt; 0.05, ** <span class="html-italic">p</span> &lt; 0.01, *** <span class="html-italic">p</span> &lt; 0.001 significant difference.</p>
Full article ">Figure 4
<p>Panels show the histogram plot (mean ± SD) of (<b>A</b>) NO metabolites (NOx) (ELISA), (<b>B</b>) nitrite (NO<sub>2</sub>) (ELISA), (<b>C</b>) nitrotyrosine (3-NT) (ELISA) and (<b>D</b>) inducible nitric oxide synthase (iNOS) (ELISA). * <span class="html-italic">p</span> &lt; 0.05, ** <span class="html-italic">p</span> &lt; 0.01 significant difference.</p>
Full article ">

2021

Jump to: 2022, 2020

11 pages, 928 KiB  
Article
Effect of High-Intensity Interval Training on Quality of Life, Sleep Quality, Exercise Motivation and Enjoyment in Sedentary People with Type 1 Diabetes Mellitus
by Jesús Alarcón-Gómez, Iván Chulvi-Medrano, Fernando Martin-Rivera and Joaquín Calatayud
Int. J. Environ. Res. Public Health 2021, 18(23), 12612; https://doi.org/10.3390/ijerph182312612 - 30 Nov 2021
Cited by 20 | Viewed by 8212
Abstract
(1) Background: Type 1 diabetes mellitus (T1DM) people’s health-related quality of life (HRQoL) is affected by glycemic control. Regular exercise is strongly recommended to these patients due to its cardiovascular and metabolic benefits. However, a large percentage of patients with T1DM people present [...] Read more.
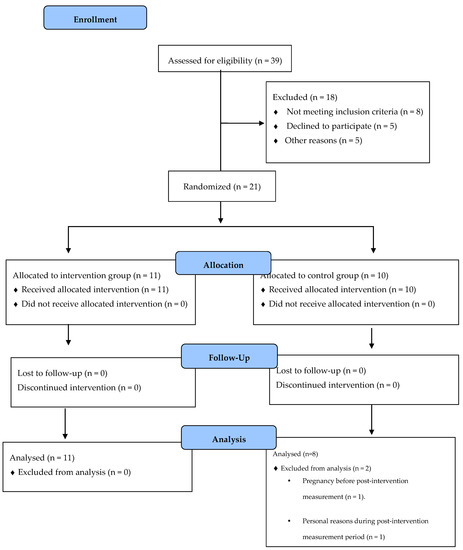
(1) Background: Type 1 diabetes mellitus (T1DM) people’s health-related quality of life (HRQoL) is affected by glycemic control. Regular exercise is strongly recommended to these patients due to its cardiovascular and metabolic benefits. However, a large percentage of patients with T1DM people present a sedentary behavior because of the fear of a post-exercise hypoglycemia event, lack of time, lack of motivation and the complicated management of exercise, glycemic and insulin dose interaction. High-intensity interval training (HIIT) is an efficient and safe methodology since it prevents hypoglycemia and does not require much time, which are the main barriers for this population to doing exercise and increasing physical conditioning. (2) Methods: Nineteen sedentary adults (37 ± 6.5 years) with T1DM, were randomly assigned to 6 weeks of either HIIT (12-16-20 × 30-s intervals interspersed with 1-min rest periods) performed thrice weekly, or to the control group, which did not train. HRQoL, sleep quality, exercise motivation and enjoyment were measured as psychological variables. (4) Results: HRQoL improved in physical and social domains, PF (1.9%); PR (80.3%); GH (16.6); SF (34.1%). Sleep quality improved in the HIIT group by 21.4%. Enjoyment improved by 7% and intrinsic motivation was increased by 13%. (5) Conclusions: We suggest that the 6-week HIIT program used in the present study is safe, since no severe hypoglycemia were reported, and an effective strategy in improving HRQoL, sleep quality, exercise motivation and enjoyment which are important psychological well-being factors in T1DM people. Full article
Show Figures

Figure 1

Figure 1
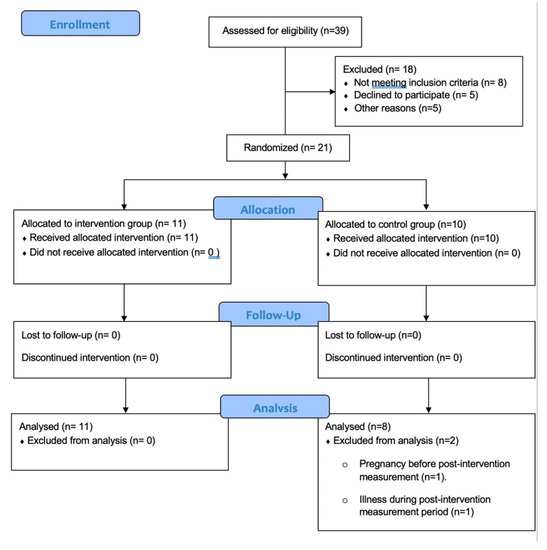
<p>Shows the recruitment process.</p>
Full article ">Figure 2
<p>Represents the study timeline.</p>
Full article ">
20 pages, 7066 KiB  
Systematic Review
Resistance Training with Blood Flow Restriction Compared to Traditional Resistance Training on Strength and Muscle Mass in Non-Active Older Adults: A Systematic Review and Meta-Analysis
by Darío Rodrigo-Mallorca, Andrés Felipe Loaiza-Betancur, Pablo Monteagudo, Cristina Blasco-Lafarga and Iván Chulvi-Medrano
Int. J. Environ. Res. Public Health 2021, 18(21), 11441; https://doi.org/10.3390/ijerph182111441 - 30 Oct 2021
Cited by 23 | Viewed by 8466
Abstract
Low-intensity training with blood flow restriction (LI-BFR) has been suggested as an alternative to high-intensity resistance training for the improvement of strength and muscle mass, becoming advisable for individuals who cannot assume such a load. The systematic review aimed to determine the effectiveness [...] Read more.
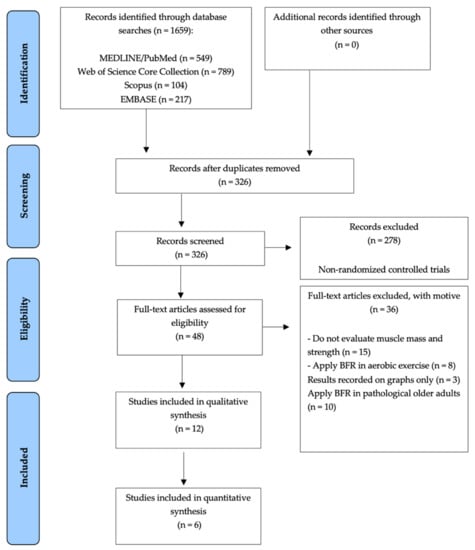
Low-intensity training with blood flow restriction (LI-BFR) has been suggested as an alternative to high-intensity resistance training for the improvement of strength and muscle mass, becoming advisable for individuals who cannot assume such a load. The systematic review aimed to determine the effectiveness of the LI-BFR compared to dynamic high-intensity resistance training on strength and muscle mass in non-active older adults. A systematic review was conducted according to the Cochrane Handbook and reportedly followed the PRISMA statement. MEDLINE, EMBASE, Web of Science Core Collection, and Scopus databases were searched between September and October 2020. Two reviewers independently selected the studies, extracted data, assessed the risk of bias and the quality of evidence using the GRADE approach. Twelve studies were included in the qualitative synthesis. Meta-analysis pointed out significant differences in maximal voluntary contraction (MVC): SMD 0.61, 95% CI [0.10, 1.11], p = 0.02, I2 71% p < 0.0001; but not in the repetition maximum (RM): SMD 0.07, 95% CI [−0.25, 0.40], p = 0.66, I2 0% p < 0.53; neither in the muscle mass: SMD 0.62, 95% CI [−0.09, 1.34], p = 0.09, I2 59% p = 0.05. Despite important limitations such as scarce literature regarding LI-BFR in older adults, the small sample size in most studies, the still differences in methodology and poor quality in many of them, this systematic review and meta-analysis revealed a positive benefit in non-active older adults. LI- BFR may induce increased muscular strength and muscle mass, at least at a similar extent to that in the traditional high-intensity resistance training. Full article
Show Figures

Figure 1

Figure 1
<p>Preferred reporting items for systematic reviews and meta-analyses (PRISMA) flow-chart of the study selection.</p>
Full article ">Figure 2
<p>Risk of bias summary: review authors’ judgments about each risk of bias item for muscular strength outcome.</p>
Full article ">Figure 3
<p>Risk of bias summary: review authors’ judgments about each risk of bias item for muscular strength outcome.</p>
Full article ">Figure 4
<p>Risk of bias summary: review authors’ judgments about each risk of bias item for muscle mass outcome.</p>
Full article ">Figure 5
<p>LI-BFR versus RT on muscular strength (RM test), standard means difference (SMD).</p>
Full article ">Figure 6
<p>LI-BFR versus RT on muscular strength (MVC test), standard means difference (SMD).</p>
Full article ">Figure 7
<p>LI-BFR versus RT on muscle mass, standard means difference (SMD).</p>
Full article ">
12 pages, 1956 KiB  
Article
The Anaerobic Power Assessment in CrossFit® Athletes: An Agreement Study
by Tomás Ponce-García, Javier Benítez-Porres, Jerónimo Carmelo García-Romero, Alejandro Castillo-Domínguez and José Ramón Alvero-Cruz
Int. J. Environ. Res. Public Health 2021, 18(16), 8878; https://doi.org/10.3390/ijerph18168878 - 23 Aug 2021
Cited by 3 | Viewed by 3999
Abstract
Anaerobic power and capacity are considered determinants of performance and are usually assessed in athletes as a part of their physical capacities’ evaluation along the season. For that purpose, many field tests have been created. The main objective of this study was to [...] Read more.
Anaerobic power and capacity are considered determinants of performance and are usually assessed in athletes as a part of their physical capacities’ evaluation along the season. For that purpose, many field tests have been created. The main objective of this study was to analyze the agreement between four field tests and a laboratory test. Nineteen CrossFit® (CF) athletes were recruited for this study (28.63 ± 6.62 years) who had been practicing CF for at least one year. Tests performed were: (1) Anaerobic Squat Test at 60% of bodyweight (AST60); (2) Anaerobic Squat Test at 70% of bodyweight (AST70); (3) Repeated Jump Test (RJT); (4) Assault Bike Test (ABT); and (5) Wingate Anaerobic Test on a cycle ergometer (WG). All tests consisted of 30 s of max effort. The differences among methods were tested using a repeated-measures analysis of variance (ANOVA) and effect size. Agreement between methods was performed using Bland–Altman analysis. Analysis of agreement showed systematic bias in all field test PP values, which varied between −110.05 (AST60PP—WGPP) and 463.58 (ABTPP—WGPP), and a significant proportional error in ABTPP by rank correlation (p < 0.001). Repeated-measures ANOVA showed significant differences among PP values (F(1.76,31.59) = 130.61, p =< 0.001). In conclusion, since to our knowledge, this is the first study to analyze the agreement between various methods to estimate anaerobic power in CF athletes. Apart from ABT, all tests showed good agreement and can be used interchangeably in CF athletes. Our results suggest that AST and RJT are good alternatives for measuring the anaerobic power in CF athletes when access to a laboratory is not possible. Full article
Show Figures

Figure 1

Figure 1
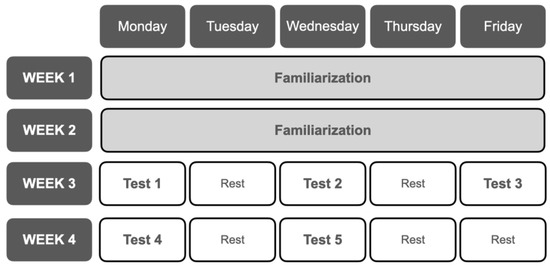
<p>The chronology of the tests.</p>
Full article ">Figure 2
<p>Full squat movement requirements. (<b>A</b>): start position; (<b>B</b>): lowest position; (<b>C</b>): final position.</p>
Full article ">Figure 3
<p>Beast sensor placement on the athlete’s at right wrist.</p>
Full article ">Figure 4
<p>Assault Bike<sup>®</sup> Classic.</p>
Full article ">Figure 5
<p>Bland–Altman’s plots representing differences (Y axes) and mean (X axes) of measurements between: (<b>a</b>) AST60 and WG; (<b>b</b>) AST70 and WG; (<b>c</b>) RJT and WG; (<b>d</b>) ABT and WG.</p>
Full article ">
9 pages, 313 KiB  
Article
Anthropometric Characteristics and Vertical Jump Abilities by Player Position and Performance Level of Junior Female Volleyball Players
by Suncica Pocek, Zoran Milosevic, Nemanja Lakicevic, Kristina Pantelic-Babic, Milka Imbronjev, Ewan Thomas, Antonino Bianco and Patrik Drid
Int. J. Environ. Res. Public Health 2021, 18(16), 8377; https://doi.org/10.3390/ijerph18168377 - 7 Aug 2021
Cited by 12 | Viewed by 4268
Abstract
Although absolute jump heights should be considered an important factor in judging the performance requirements of volleyball players, limited data is available on age-appropriate categories. The purpose of this study is to determine the differences in specific anthropometric characteristics and jumping performance variables [...] Read more.
Although absolute jump heights should be considered an important factor in judging the performance requirements of volleyball players, limited data is available on age-appropriate categories. The purpose of this study is to determine the differences in specific anthropometric characteristics and jumping performance variables in under−19 female volleyball players in relation to playing position and performance level. The sample of subjects consisted of 354 players who prepared for the U19 Women’s Volleyball European Championship 2020 (17.4 ± 0.8 years, 1.81 ± 0.07 m, 67.5 ± 7.1 kg). Playing positions analyzed were setters (n = 55), opposites (n = 37), middle blockers (n = 82), outside hitters (n = 137), and liberos (n = 43). The results showed player position differences in every performance level group in variables of body height, spike, and block jump. Observed differences are a consequence of highly specific tasks of different positions in the composition of the team. Players of different performance levels are significantly different, with athletes of higher-ranked teams achieving better results. The acquired data could be useful for the selection and profiling of young volleyball players. Full article
14 pages, 1903 KiB  
Article
Recovery and Fatigue Behavior of Forearm Muscles during a Repetitive Power Grip Gesture in Racing Motorcycle Riders
by Michel Marina, Priscila Torrado and Raul Bescós
Int. J. Environ. Res. Public Health 2021, 18(15), 7926; https://doi.org/10.3390/ijerph18157926 - 27 Jul 2021
Cited by 1 | Viewed by 3038
Abstract
Despite a reduction in the maximal voluntary isometric contraction (MVCisom) observed systematically in intermittent fatigue protocols (IFP), decrements of the median frequency, assessed by surface electromyography (sEMG), has not been consistently verified. This study aimed to determine whether recovery periods of [...] Read more.
Despite a reduction in the maximal voluntary isometric contraction (MVCisom) observed systematically in intermittent fatigue protocols (IFP), decrements of the median frequency, assessed by surface electromyography (sEMG), has not been consistently verified. This study aimed to determine whether recovery periods of 60 s were too long to induce a reduction in the normalized median frequency (MFEMG) of the flexor digitorum superficialis and carpi radialis muscles. Twenty-one road racing motorcycle riders performed an IFP that simulated the posture and braking gesture on a motorcycle. The MVCisom was reduced by 53% (p < 0.001). A positive and significant relationship (p < 0.005) was found between MFEMG and duration of the fatiguing task when 5 s contractions at 30% MVCisom were interspersed by 5 s recovery in both muscles. In contrast, no relationship was found (p > 0.133) when 10 s contractions at 50% MVC were interspersed by 1 min recovery. Comparative analysis of variance (ANOVA) confirmed a decrement of MFEMG in the IFP at 30% MVCisom including short recovery periods with a duty cycle of 100% (5 s/5 s = 1), whereas no differences were observed in the IFP at 50% MVCisom and longer recovery periods, with a duty cycle of 16%. These findings show that recovery periods during IFP are more relevant than the intensity of MVCisom. Thus, we recommend the use of short recovery periods between 5 and 10 s after submaximal muscle contractions for specific forearm muscle training and testing purposes in motorcycle riders. Full article
Show Figures

Figure 1

Figure 1
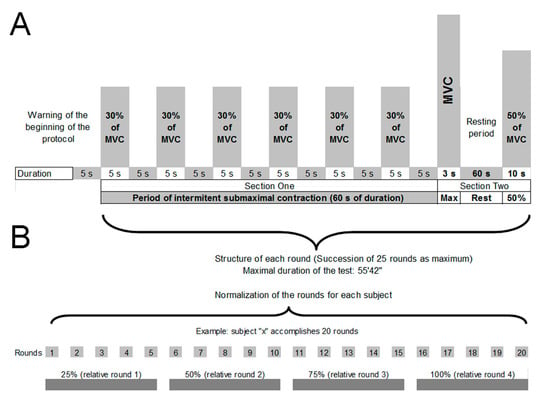
<p>(<b>A</b>): Description of the sequence and structure of the intermittent protocol. Auditory feedback was provided to ensure the exact duration of each contraction and resting period. (<b>B</b>): Represents an illustration of a subject who performed 20 rounds, which means that each one of the four successive relative rounds is composed of five rounds.</p>
Full article ">Figure 2
<p>Simulation of the overall position of a rider above a motorcycle race from 600 cc to 1000 cc. A static structure was built to preserve the distances between seat, stirrups, and particularly the combined system of shanks, forks, handlebar, brake and clutch levers, and gas.</p>
Full article ">Figure 3
<p>Example of a comparative regression analysis of an individual. Regression of the carpi radialis (CR) and flexor superficialis digitorum (FS) at the two intensities: (<b>A</b>) is 30% of MVC<sub>isom</sub>, and (<b>B</b>) is 50% of MVC<sub>isom</sub>; both used in the intermittent protocol.</p>
Full article ">
17 pages, 5302 KiB  
Review
The Effects of Interval Training and Continuous Training on Cardiopulmonary Fitness and Exercise Tolerance of Patients with Heart Failure—A Systematic Review and Meta-Analysis
by Daxin Li, Ping Chen and Junying Zhu
Int. J. Environ. Res. Public Health 2021, 18(13), 6761; https://doi.org/10.3390/ijerph18136761 - 23 Jun 2021
Cited by 13 | Viewed by 4126
Abstract
Purpose: To investigate the effects of interval training (IT) as compared with continuous training (CT) on cardiorespiratory fitness and exercise tolerance of patients with heart failure (HF), with the aim to provide reasonable exercise prescriptions for patients with HF. Methods: Through searching electronic [...] Read more.
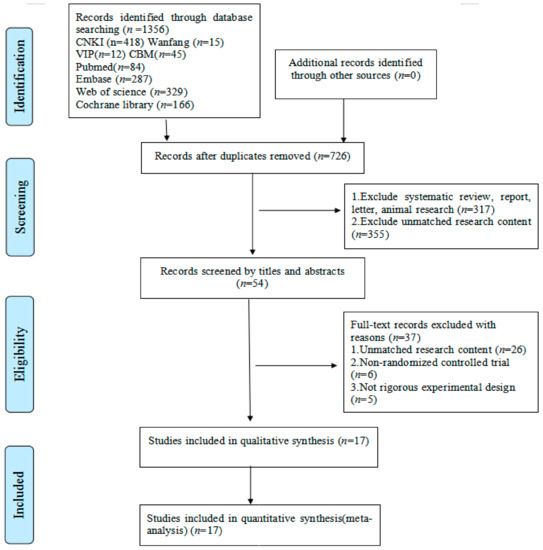
Purpose: To investigate the effects of interval training (IT) as compared with continuous training (CT) on cardiorespiratory fitness and exercise tolerance of patients with heart failure (HF), with the aim to provide reasonable exercise prescriptions for patients with HF. Methods: Through searching electronic databases, randomized controlled studies were collected. The included studies were evaluated for methodological quality using the Cochrane risk of bias assessment tool, and statistical analyses were carried out using Review Manager 5.3 and Stata MP 15.1 software. Results: A total of seventeen randomized controlled trials (i.e., studies) with 617 patients were included. The meta-analysis showed that IT can improve a patient’s peak oxygen uptake (VO2peak) (MD = 2.08, 95% CI 1.16 to 2.99, p < 0.00001), left ventricular ejection fraction (LVEF) (MD =1.32, 95% CI 0.60 to 2.03, p = 0.0003), and 6-minute walk distance (6MWD) (MD = 25.67, 95% CI 12.87 to 38.47, p < 0.0001) as compared with CT. However, for respiratory exchange ratio (RER) (MD = 0.00, 95% CI −0.02 to 0.03, p = 0.81), CO2 ventilation equivalent slope (VE/VCO2 slope) (SMD = 0.04, 95% CI −0.23 to 0.31, p = 0.75), and resting heart rate (HRrest) (MD = 0.15, 95% CI −3.00 to 3.29, p = 0.93) there were no statistical significance. Conclusions: The evidence shows that IT is better than CT for improving the cardiorespiratory fitness and exercise tolerance of patients with HF. Moreover, an intensity of 60–80% peak heart rate of IT is the optimal choice for patients. It is hoped that, in the future, more well-designed studies would further expand the meta-analysis results. Full article
Show Figures

Figure 1

Figure 1
<p>Flow diagram of literature selection.</p>
Full article ">Figure 2
<p>Analysis of the risk of bias in accordance with the Cochrane collaboration guidelines.</p>
Full article ">Figure 3
<p>Forest plot: Effects of VO2peak.</p>
Full article ">Figure 4
<p>Forest plot: Effects of the RER.</p>
Full article ">Figure 5
<p>Forest plot: Effects of VE/VCO2 slope.</p>
Full article ">Figure 6
<p>Forest plot: Effects of LVEF.</p>
Full article ">Figure 7
<p>Forest plot: Effects of HRrest.</p>
Full article ">Figure 8
<p>Forest plot: Effects of 6MWD.</p>
Full article ">Figure 9
<p>O: previous studies; <b>□</b>: filled studies. A funnel plot with trim and fill for the effect size of LVEF.</p>
Full article ">
10 pages, 324 KiB  
Article
Strength and Power Characteristics in National Amateur Rugby Players
by Diego Alexandre Alonso-Aubin, Moisés Picón-Martínez and Iván Chulvi-Medrano
Int. J. Environ. Res. Public Health 2021, 18(11), 5615; https://doi.org/10.3390/ijerph18115615 - 24 May 2021
Cited by 2 | Viewed by 4213
Abstract
Rugby players need muscular strength and power to meet the demands of the sport; therefore, a proper assessment of the performance in rugby players should include both variables. The purpose of this study was to examine the strength and power characteristics (SPC) during [...] Read more.
Rugby players need muscular strength and power to meet the demands of the sport; therefore, a proper assessment of the performance in rugby players should include both variables. The purpose of this study was to examine the strength and power characteristics (SPC) during the squat (SQ) and bench press (BP) in national amateur rugby players and to analyze gender- and position-related differences. A total of 47 players (30 males and 17 females; age: 25.56 ± 1.14 and 23.16 ± 1.38 years, respectively) participated in the study. The one repetition-maximum (1-RM) and SPC in SQ and BP were obtained using a Smith Machine. Then, subjects performed one set of five repetitions on the SQ and BP against six relative loads (30–40–50–60–70–80% 1-RM) using a linear transducer. Differences between genders were found in 1-RM for maximal power, kilograms lifted at maximal power, maximal power, maximal strength and maximal speed in BP (p < 0.00) and 1-RM, kilograms lifted at maximal power, maximal power, maximal strength and maximal speed in SQ (p < 0.00). Comparisons between variables in SQ and BP present a significant relationship (p < 0.01) in SQ and BP 1-RM with kilograms lifted at maximal power (r = 0.86 and r = 0.84), maximal strength (r = 0.53 and r = 0.92) and maximal power (r = 0.76 and r = 0.93). This study confirms the importance of the SPC assessment for training prescription in rugby amateur players. Full article
16 pages, 623 KiB  
Article
The Biomechanical Characterization of the Turning Phase during a 180° Change of Direction
by Enrico Santoro, Antonio Tessitore, Chiang Liu, Chi-Hsien Chen, Chutimon Khemtong, Mauro Mandorino, Yi-Hua Lee and Giancarlo Condello
Int. J. Environ. Res. Public Health 2021, 18(11), 5519; https://doi.org/10.3390/ijerph18115519 - 21 May 2021
Cited by 4 | Viewed by 3183
Abstract
The aim of this study was to characterize the turning phase during a modified 505 test. Forty collegiate basketball students, divided into faster and slower performers and high-playing-level and low-playing-level groups, were evaluated for the force-time characteristics (braking and/or propulsive phase) of the [...] Read more.
The aim of this study was to characterize the turning phase during a modified 505 test. Forty collegiate basketball students, divided into faster and slower performers and high-playing-level and low-playing-level groups, were evaluated for the force-time characteristics (braking and/or propulsive phase) of the penultimate foot contact (PFC), final foot contact (FFC), and first accelerating foot contact (AFC), and for completion time and approach velocity. Based on the composition of the AFC, trials were classified as braking/propulsive or only propulsive. Regression analysis for the prediction of completion time was performed. The AFC contributed to reacceleration through shorter contact times and step length, and lower braking force production (p < 0.05). Faster performers and the high-playing-level group demonstrated (p < 0.05): lower completion times, higher approach velocities, longer steps length in the PFC and FFC, greater braking forces and impulses in the PFC; greater braking and propulsive forces, braking impulses, lower contact times in the FFC; greater braking and propulsive horizontal forces, horizontal impulses, lower contact times and vertical impulses in the AFC. Kinetic variables from only the FFC and AFC and approach velocity predicted 75% (braking/propulsive trials) and 76.2% (only-propulsive trials) of completion times. The characterization of the turning phase demonstrated the specific contribution of each foot contact and the possible implications for training prescription. Full article
Show Figures

Figure 1

Figure 1
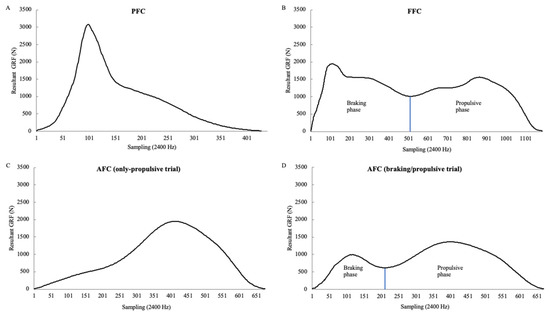
<p>Example of vertical ground reaction force (GRF) profiles for (<b>A</b>) penultimate foot contact (PFC), (<b>B</b>) final foot contact (FFC), and first accelerating foot contact (AFC) in case of (<b>C</b>) only-propulsive trials and (<b>D</b>) braking/propulsive trials, used for the identification of the braking and propulsive phases.</p>
Full article ">
9 pages, 329 KiB  
Article
Musculoskeletal Pain in Gymnasts: A Retrospective Analysis on a Cohort of Professional Athletes
by Giacomo Farì, Francesco Fischetti, Alessandra Zonno, Francesco Marra, Alessia Maglie, Francesco Paolo Bianchi, Giuseppe Messina, Maurizio Ranieri and Marisa Megna
Int. J. Environ. Res. Public Health 2021, 18(10), 5460; https://doi.org/10.3390/ijerph18105460 - 20 May 2021
Cited by 28 | Viewed by 4187
Abstract
Gymnastics athletes are exposed to a high risk of injury, but also of developing musculoskeletal pain. These data are still little investigated in the available scientific literature. An online survey was distributed to 79 professional athletes who practiced artistic and rhythmic gymnastics. The [...] Read more.
Gymnastics athletes are exposed to a high risk of injury, but also of developing musculoskeletal pain. These data are still little investigated in the available scientific literature. An online survey was distributed to 79 professional athletes who practiced artistic and rhythmic gymnastics. The survey collected demographic and anthropometric data, information about the sport practice, the training sessions, the prevalence of musculoskeletal pain gymnastics-related, and lifestyle habits. Musculoskeletal pain had a high prevalence, involving 65 of 79 athletes (82.3%). A significant correlation was found between musculoskeletal pain and the duration of sports practice, both for general pain (p = 0.041) and for specific districts: right wrist pain (p = 0.031), left wrist pain (p = 0.028), right shoulder (p = 0.039), left hip (p = 0.031), right thigh (p = 0.031), and left knee (p = 0.005). Another statistical association was found between right wrist pain and BMI (p = 0.001), and hip pain and BMI (p = 0.030). Hours spent in a sitting position were also correlated with the incidence of pain (p = 0.045). Wrist pain and right shoulder pain had a statistically significant association with the age of the athletes (right wrist pain: p = 0.038; left wrist pain: p = 0.004; right shoulder pain: p = 0.035). The more the gymnasts practice this sport, the more likely they are to develop musculoskeletal pain. Increased age and a higher BMI, as well as daily prolonged sitting position, seem to be potential risk factors for the onset of musculoskeletal pain. Future studies could plan training strategies aimed at preventing musculoskeletal pain associated with gymnastics, in order to promote its further spread. Full article
10 pages, 334 KiB  
Article
Hypovitaminosis D in Young Basketball Players: Association with Jumping and Hopping Performance Considering Gender
by Borja Ricart, Pablo Monteagudo and Cristina Blasco-Lafarga
Int. J. Environ. Res. Public Health 2021, 18(10), 5446; https://doi.org/10.3390/ijerph18105446 - 19 May 2021
Cited by 1 | Viewed by 2609
Abstract
This study aimed to verify whether a group of young well-trained basketball players presented deficiencies in vitamin D concentration, and to analyze whether there was an association between vitamin D concentration and jumping and hopping performance. Gender differences were considered. Twenty-seven players from [...] Read more.
This study aimed to verify whether a group of young well-trained basketball players presented deficiencies in vitamin D concentration, and to analyze whether there was an association between vitamin D concentration and jumping and hopping performance. Gender differences were considered. Twenty-seven players from an international high-level basketball club (14 female, 16.00 ± 0.55 years; 13 male, 15.54 ± 0.52 years) participated in this cross-sectional study. Rate of force development was evaluated by means of the Abalakov test (bilateral: AbB; right leg: AbR; left leg: AbL); and the triple hop test (right leg: THR; left leg: THL). Blood samples were collected for the determination of serum 25-hydroxyvitamin D and nutritional status. Vitamin D insufficiency was found in both women (29.14 ± 6.08 ng/mL) and men (28.92 ± 6.40 ng/mL), with no gender differences regarding nutritional scores. Jumping and hopping performance was confirmed to be significantly larger in males (AbL, THR, and THL p < 0.005), whose CV% were always smaller. A positive correlation was found between AbB and vitamin D (r = 0.703) in males, whereas this correlation was negative (−0.611) for females, who also presented a negative correlation (r = −0.666) between THR and vitamin D. A prevalence of hypovitaminosis D was confirmed in young elite athletes training indoors. Nutritional (i.e., calciferol) controls should be conducted throughout the season. Furthermore, whilst performance seems to be affected by low levels of this vitamin in men, these deficiencies appear to have a different association with jumping and hopping in women, pointing to different performance mechanisms. Further studies accounting for differences in training and other factors might delve into these gender differences. Full article
10 pages, 765 KiB  
Article
Predicting the Unknown and the Unknowable. Are Anthropometric Measures and Fitness Profile Associated with the Outcome of a Simulated CrossFit® Competition?
by Javier Peña, Daniel Moreno-Doutres, Iván Peña, Iván Chulvi-Medrano, Alberto Ortegón, Joan Aguilera-Castells and Bernat Buscà
Int. J. Environ. Res. Public Health 2021, 18(7), 3692; https://doi.org/10.3390/ijerph18073692 - 1 Apr 2021
Cited by 8 | Viewed by 3499
Abstract
The main objective of this research was to find associations between the outcome of a simulated CrossFit® competition, anthropometric measures, and standardized fitness tests. Ten experienced male CrossFit® athletes (age 28.8 ± 3.5 years; height 175 ± 10.0 cm; weight 80.3 [...] Read more.
The main objective of this research was to find associations between the outcome of a simulated CrossFit® competition, anthropometric measures, and standardized fitness tests. Ten experienced male CrossFit® athletes (age 28.8 ± 3.5 years; height 175 ± 10.0 cm; weight 80.3 ± 12.5 kg) participated in a simulated CrossFit® competition with three benchmark workouts (“Fran”, “Isabel”, and “Kelly”) and underwent fitness tests. Participants were tested for anthropometric measures, sit and reach, squat jump (SJ), countermovement jump (CMJ), and Reactive Strength Index (RSI), and the load (LOAD) corresponding to the highest mean power value (POWER) in the snatch, bench press, and back squat exercises was determined using incremental tests. A bivariate correlation test and k-means cluster analysis to group individuals as either high-performance (HI) or low performance (LO) via Principal Component Analysis (PCA) were carried out. Pearson’s correlation coefficient two-tailed test showed that the only variable correlated with the final score was the snatch LOAD (p < 0.05). Six performance variables (SJ, CMJ, RSI, snatch LOAD, bench press LOAD, and back squat LOAD) explained 74.72% of the variance in a k = 2 means cluster model. When CrossFit® performance groups HI and LO were compared to each other, t-test revealed no difference at a p ≤ 0.05 level. Snatch maximum power LOAD and the combination of six physical fitness tests partially explained the outcome of a simulated CrossFit competition. Coaches and practitioners can use these findings to achieve a better fit of the practices and workouts designed for their athletes. Full article
Show Figures

Figure 1

Figure 1
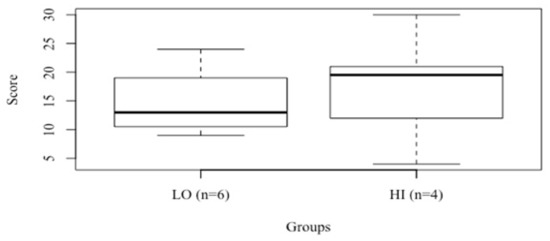
<p>Boxplot visualization of the k-means cluster analysis grouping individuals as either high-performance (HI) or low performance (LO) and showing the minimum score, first quartile, median, third quartile, and maximum score achieved in the simulated competition by every group.</p>
Full article ">Figure 2
<p>Principal Component Analysis with concentration and confidence ellipses around each group, including the six performance measures. Each main component is obtained by linear combination of the original six variables, and every dot inside the ellipses represents one individual in the HI (<span class="html-italic">n</span> = 6) and LO (<span class="html-italic">n</span> = 4) groups. These two components explain 74.72% of the point variability.</p>
Full article ">
14 pages, 2225 KiB  
Systematic Review
Subjective versus Objective Measure of Physical Activity: A Systematic Review and Meta-Analysis of the Convergent Validity of the Physical Activity Questionnaire for Children (PAQ-C)
by Danilo Marasso, Corrado Lupo, Simone Collura, Alberto Rainoldi and Paolo Riccardo Brustio
Int. J. Environ. Res. Public Health 2021, 18(7), 3413; https://doi.org/10.3390/ijerph18073413 - 25 Mar 2021
Cited by 43 | Viewed by 6839
Abstract
This study aimed to highlight the relationship between moderate-to-vigorous physical activity (MVPA) as assessed by accelerometer devices and the Physical Activity Questionnaire for Children (PAQ-C) to estimate the convergent validity of the questionnaire. A systematic review and a meta-analysis were applied by collecting [...] Read more.
This study aimed to highlight the relationship between moderate-to-vigorous physical activity (MVPA) as assessed by accelerometer devices and the Physical Activity Questionnaire for Children (PAQ-C) to estimate the convergent validity of the questionnaire. A systematic review and a meta-analysis were applied by collecting pertinent studies (PubMed, Web of Science, PsycINFO, and SCOPUS) from 1997 until November 2020. The relationship between PAQ-C and MVPA scores was estimated considering correlation coefficients such as the effect size. Fisher’s transformation was used to convert each correlation coefficient into an approximately normal distribution. The pooled correlations between PAQ-C and MVPA scores were measured by r values after converting the Fisher’s z values back into correlation coefficients for presentation. A total of 13 studies were included in the meta-analysis, and a random effects model was adopted. The pooled correlation between PAQ-C and MVPA scores was significant but with a moderate effect size (r = 0.34 [0.29, 0.39], Z = 15.00, p < 0.001). No heterogeneity among the studies was observed (I2 < 25%). In conclusion, the results highlighted a moderate relationship (around 0.30–0.40) between PAQ-C and accelerometer measurements. These results suggested to concurrently administer both tools to reach a more comprehensive description of children’s PA, in terms of quality and quantity. Full article
Show Figures

Figure 1

Figure 1
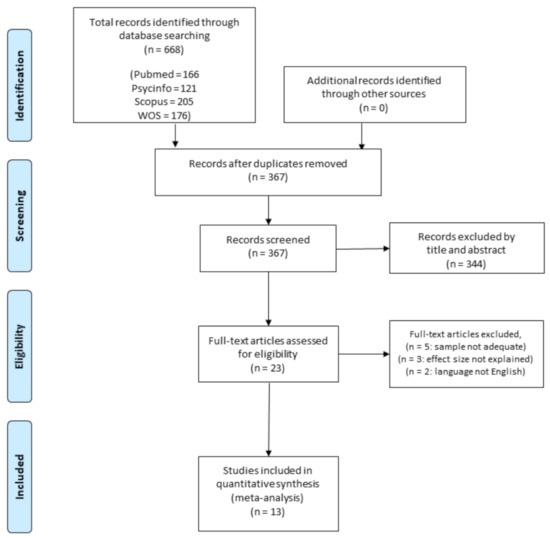
<p>Flow diagram for screening and selection of studies.</p>
Full article ">Figure 2
<p>Forest plot showing the relative and pooled correlations between PAQ-C and MVPA scores of the included studies.</p>
Full article ">
10 pages, 6518 KiB  
Article
The Impact of Fluid Loss and Carbohydrate Consumption during Exercise, on Young Cyclists’ Fatigue Perception in Relation to Training Load Level
by Leonardo Cesanelli, Berta Ylaitė, Giuseppe Messina, Daniele Zangla, Stefania Cataldi, Antonio Palma and Angelo Iovane
Int. J. Environ. Res. Public Health 2021, 18(6), 3282; https://doi.org/10.3390/ijerph18063282 - 22 Mar 2021
Cited by 7 | Viewed by 3310
Abstract
High-level young athletes need to face a wide spectrum of stressors on their journey to élite categories. The aims of the present study are (i) to evaluate session rate of perceived exertion (sRPE) at different training impulse (TRIMP) categories and the correlations between [...] Read more.
High-level young athletes need to face a wide spectrum of stressors on their journey to élite categories. The aims of the present study are (i) to evaluate session rate of perceived exertion (sRPE) at different training impulse (TRIMP) categories and the correlations between these two variables and, (ii) evaluate the correlations between sRPE, fluid loss, and carbohydrate consumption during exercise. Data on Edward’s TRIMP, sRPE, body mass loss pre- and post- exercise (∆), and carbohydrate consumption (CHO/h) during exercise have been acquired from eight male junior cyclists during a competitive season. One-way ANOVA and correlation analysis with linear regression have been performed on acquired data. sRPE resulted in a significant difference in the three TRIMP categories (p < 0.001). sRPE resulted in being very largely positively associated with TRIMP values (p < 0.001; R = 0.71). ∆ as well as CHO/h was largely negatively related with sRPE in all TRIMP categories (p < 0.001). The results confirmed the role of fluid balance and carbohydrate consumption on the perception of fatigue and fatigue accumulation dynamics independently from the training load. Young athletes’ training load monitoring and nutritional-hydration support represent important aspects in athlete’s exercise-induced fatigue management. Full article
Show Figures

Figure 1

Figure 1
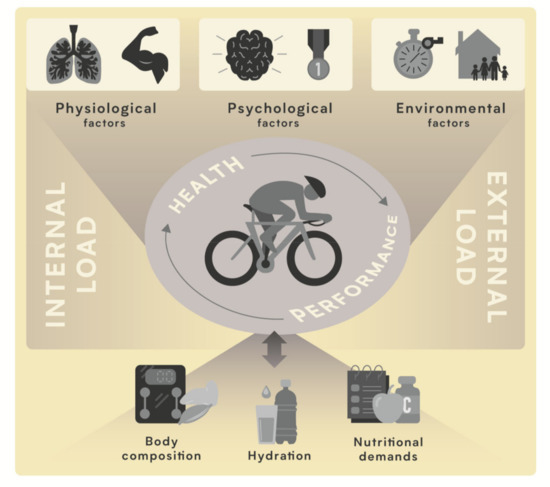
<p>Graphical summary of the main performance and health determining factors of young competitive cyclists.</p>
Full article ">Figure 2
<p>Linear regression between TRIMP (AU) and sRPE (AU).</p>
Full article ">Figure 3
<p>Linear regression between sRPE (AU) and pre- and post-training ∆ (kg) variations of training sessions displaying &lt;100 TRIMP points (<b>a</b>); 100–200 TRIMP points (<b>b</b>) and &gt;200 TRIMP points (<b>c</b>).</p>
Full article ">Figure 4
<p>Linear regression between sRPE (AU) and training session carbohydrates consumption (gCHO/h) of training sessions displaying &lt;100 TRIMP points (<b>a</b>); 100–200 TRIMP points (<b>b</b>) and &gt;200 TRIMP points (<b>c</b>).</p>
Full article ">Figure 5
<p>Graphical representation of the inter-relationships between training load markers, fluid balance and carbohydrate supply during exercise. Increased fluid loss (negative ∆) as well as lower or no carbohydrate consumption is related to an increased fatigue perception (sRPE) independently from training load category (TRIMP).</p>
Full article ">
25 pages, 1060 KiB  
Systematic Review
Load Measures in Training/Match Monitoring in Soccer: A Systematic Review
by Mauro Miguel, Rafael Oliveira, Nuno Loureiro, Javier García-Rubio and Sergio J. Ibáñez
Int. J. Environ. Res. Public Health 2021, 18(5), 2721; https://doi.org/10.3390/ijerph18052721 - 8 Mar 2021
Cited by 80 | Viewed by 9865
Abstract
In soccer, the assessment of the load imposed by training and a match is recognized as a fundamental task at any competitive level. The objective of this study is to carry out a systematic review on internal and external load monitoring during training [...] Read more.
In soccer, the assessment of the load imposed by training and a match is recognized as a fundamental task at any competitive level. The objective of this study is to carry out a systematic review on internal and external load monitoring during training and/or a match, identifying the measures used. In addition, we wish to make recommendations that make it possible to standardize the classification and use of the different measures. The systematic review was carried out according to the Preferred Reporting Items for Systematic Reviews and Meta-Analyses (PRISMA) guidelines. The search was conducted through the electronic database Web of Science, using the keywords “soccer” and “football”, each one with the terms “internal load”, “external load”, and “workload”. Of the 1223 studies initially identified, 82 were thoroughly analyzed and are part of this systematic review. Of these, 25 articles only report internal load data, 20 report only external load data, and 37 studies report both internal and external load measures. There is a huge number of load measures, which requires that soccer coaches select and focus their attention on the most useful and specific measures. Standardizing the classification of the different measures is vital in the organization of this task, as well as when it is intended to compare the results obtained in different investigations. Full article
Show Figures

Figure 1

Figure 1
<p>Article selection process flowchart.</p>
Full article ">Figure 2
<p>Load measures groups: quantities and relationships.</p>
Full article ">
13 pages, 1914 KiB  
Article
Kinematic Analysis of Water Polo Player in the Vertical Thrust Performance to Determine the Force-Velocity and Power-Velocity Relationships in Water: A Preliminary Study
by Giuseppe Annino, Cristian Romagnoli, Andrea Zanela, Giovanni Melchiorri, Valerio Viero, Elvira Padua and Vincenzo Bonaiuto
Int. J. Environ. Res. Public Health 2021, 18(5), 2587; https://doi.org/10.3390/ijerph18052587 - 5 Mar 2021
Cited by 10 | Viewed by 3257
Abstract
Background: To date, studies on muscle force and power-velocity (F-v and P-v) relationships performed in water are absent. Aim: The goal of this study is to derive the F-v and P-v regression models of water polo players in water vertical thrust performance at [...] Read more.
Background: To date, studies on muscle force and power-velocity (F-v and P-v) relationships performed in water are absent. Aim: The goal of this study is to derive the F-v and P-v regression models of water polo players in water vertical thrust performance at increasing load. Methods: After use of a control object for direct linear transformation, displacement over the water and elapsed time was measured, by using a high-speed 2D-videoanalysis system, on 14 players involved in the study. Results: Intra-operator and player’s performance interclass correlation coefficient (ICC) reliability showed an excellent level of reproducibility for all kinematic and dynamic measurements considered in this study with a coefficient of variation (CV) of less than 4.5%. Results of this study have shown that an exponential force-velocity relationship seems to explain better the propulsive force exerted in the water in lifting increasing loads compared to the linear one, while the power and velocity have been shown to follow a second-order polynomial regression model. Conclusion: Given the accuracy of the video analysis, the high reliability and the specificity of the results, it is pointed out that video analysis can be a valid method to determine force-velocity and power-velocity curves in a specific environment to evaluate the neuromuscular profile of each water polo player. Full article
Show Figures

Figure 1

Figure 1
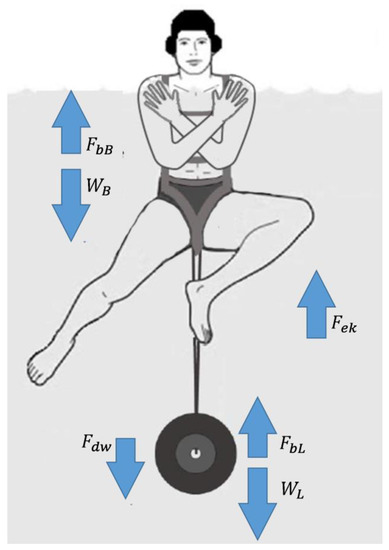
<p>Frontal view of water polo overload test (WOT) conditions and acting forces. Buoyancy force of the subject (<span class="html-italic">F<sub>bB</sub></span>), Body weight of the subject (<span class="html-italic">W<sub>B</sub></span>), eggbeater kick force (<span class="html-italic">F<sub>ek</sub></span>), buoyancy force of the load (<span class="html-italic">F<sub>bL</sub></span>), weight of the load (<span class="html-italic">W<sub>L</sub></span>), force relative to power that is wasted to accelerate water downwards (<span class="html-italic">F<sub>dw</sub></span>).</p>
Full article ">Figure 2
<p>Median correlation coefficients and their ranges obtained comparing the vertical thrust’s height free load with individual <span class="html-italic">F<sub>bk</sub></span>, <span class="html-italic">P<sub>bk</sub></span> and <span class="html-italic">v</span> at 5–25 kg.</p>
Full article ">Figure 3
<p>Linear F-v (grey line and squares) and second-order polynomial regression P-v (black line and dots) with the relative regression equations building on vertical thrust performed at incremental loads (from 5 to 25 kg). Both curves are depicted according the average and SD of velocity, force and power at different load as shown in <a href="#ijerph-18-02587-t001" class="html-table">Table 1</a>.</p>
Full article ">Figure 4
<p>Exponential F-v with the relative regression equations building on vertical thrust performed at incremental loads (from 5 to 25 kg). The curve is depicted according to the average and SD of velocity and force with the different loads as shown in <a href="#ijerph-18-02587-t001" class="html-table">Table 1</a>.</p>
Full article ">
9 pages, 957 KiB  
Article
Effects of Ballroom Dance on Physical Fitness and Reaction Time in Experienced Middle-Aged Adults of Both Genders
by Valerio Bonavolontà, Francesca Greco, Umberto Sabatini, Francisco J. Saavedra, Francesco Fischetti, Carlo Baldari, Laura Guidetti, Maria Grazia Vaccaro and Gian Pietro Emerenziani
Int. J. Environ. Res. Public Health 2021, 18(4), 2036; https://doi.org/10.3390/ijerph18042036 - 19 Feb 2021
Cited by 7 | Viewed by 4817
Abstract
Ballroom dance practice might play a pivotal role for successful aging, but its effects could differ depending on dancers’ experience level. The aim of this study was to investigate the effects of six months of ballroom dance (three times/w) on physical fitness and [...] Read more.
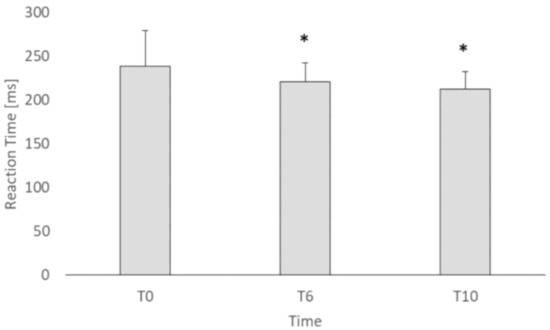
Ballroom dance practice might play a pivotal role for successful aging, but its effects could differ depending on dancers’ experience level. The aim of this study was to investigate the effects of six months of ballroom dance (three times/w) on physical fitness and reaction time (RT) in 24 middle-aged adults who are experienced dancers (age: 59.4 ± 11.6 years). Body composition, handgrip test (HG), standing long-jump test (SLJ), step test (ST), one-legged stance balance test (OLSB), and RT were assessed before (T0) and after six months (T6) of dance practice. RT was re-evaluated four months later (T10). RT was significantly (p < 0.05) lower at T6 (221.2 ± 20.3 ms) and T10 (212.0 ± 21.9 ms) than T0 (239.1 ± 40,7 ms); no significant differences were found between T6 and T10. No significant differences were observed for all the other parameters between T0 and T6: weight and muscle mass were significantly lower (p < 0.01) in females than in males, and percentage of fat mass was significantly higher (p < 0.01) in females than in males. HG was significantly higher in males than females (p < 0.01). Results suggest that in experienced middle-aged adults of both genders, ballroom dance may positively influence RT, and this result could be maintained for four months. Full article
Show Figures

Figure 1

Figure 1
<p>Subjects’ reaction time (ms) pre (T<sub>0</sub>) and post (T<sub>6</sub>) dance intervention and after summer season (T<sub>10</sub>). * <span class="html-italic">p</span> &lt; 0.05 vs T<sub>0</sub>.</p>
Full article ">
14 pages, 1385 KiB  
Article
Summated Hazard Score as a Powerful Predictor of Fatigue in Relation to Pacing Strategy
by Sylvia Binkley, Carl Foster, Cristina Cortis, Jos J. de Koning, Christopher Dodge, Scott T. Doberstein, Andrea Fusco, Salvador J. Jaime and John P. Porcari
Int. J. Environ. Res. Public Health 2021, 18(4), 1984; https://doi.org/10.3390/ijerph18041984 - 18 Feb 2021
Cited by 5 | Viewed by 3138
Abstract
During competitive events, the pacing strategy depends upon how an athlete feels at a specific moment and the distance remaining. It may be expressed as the Hazard Score (HS) with momentary HS being shown to provide a measure of the likelihood of changing [...] Read more.
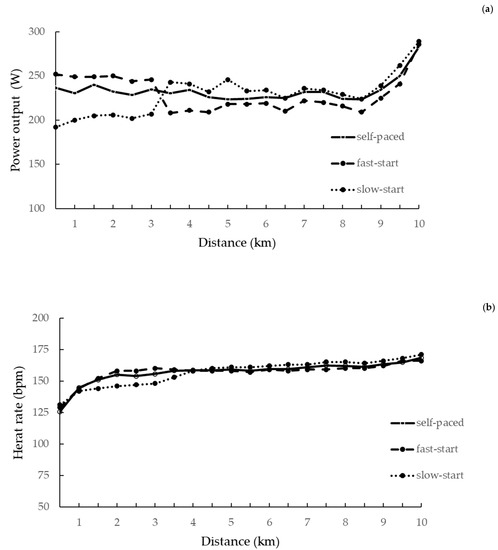
During competitive events, the pacing strategy depends upon how an athlete feels at a specific moment and the distance remaining. It may be expressed as the Hazard Score (HS) with momentary HS being shown to provide a measure of the likelihood of changing power output (PO) within an event and summated HS as a marker of how difficult an event is likely to be perceived to be. This study aimed to manipulate time trial (TT) starting strategies to establish whether the summated HS, as opposed to momentary HS, will improve understanding of performance during a simulated cycling competition. Seven subjects (peak PO: 286 ± 49.7 W) performed two practice 10-km cycling TTs followed by three 10-km TTs with imposed PO (±5% of mean PO achieved during second practice TT and a self-paced TT). PO, rating of perceived exertion (RPE), lactate, heart rate (HR), HS, summated HS, session RPE (sRPE) were collected. Finishing time and mean PO for self-paced (time: 17.51 ± 1.41 min; PO: 234 ± 62.6 W), fast-start (time: 17.72 ± 1.87 min; PO: 230 ± 62.0 W), and slow-start (time: 17.77 ± 1.74 min; PO: 230 ± 62.7) TT were not different. There was a significant interaction between each secondary outcome variable (PO, RPE, lactate, HR, HS, and summated HS) for starting strategy and distance. The evolution of HS reflected the imposed starting strategy, with a reduction in PO following a fast-start, an increased PO following a slow-start with similar HS during the last part of all TTs. The summated HS was strongly correlated with the sRPE of the TTs (r = 0.88). The summated HS was higher with a fast start, indicating greater effort, with limited time advantage. Thus, the HS appears to regulate both PO within a TT, but also the overall impression of the difficulty of a TT. Full article
Show Figures

Figure 1

Figure 1
<p>Power output (<b>a</b>), heart rate (<b>b</b>), blood lactate (<b>c</b>), and rating of perceived exertion (<b>d</b>) responses in relation to starting strategy.</p>
Full article ">Figure 1 Cont.
<p>Power output (<b>a</b>), heart rate (<b>b</b>), blood lactate (<b>c</b>), and rating of perceived exertion (<b>d</b>) responses in relation to starting strategy.</p>
Full article ">Figure 2
<p>Growth of Hazard Score (<b>a</b>) and summated Hazard Score (<b>b</b>) in relation to distance during self-paced, fast-start, and slow-start time trials.</p>
Full article ">Figure 2 Cont.
<p>Growth of Hazard Score (<b>a</b>) and summated Hazard Score (<b>b</b>) in relation to distance during self-paced, fast-start, and slow-start time trials.</p>
Full article ">Figure 3
<p>Session rating of perceived exertion (sRPE) to summated Hazard Score (HS) relationship during self-paced, fast-start, and slow-start time trials.</p>
Full article ">
9 pages, 504 KiB  
Article
The Effects of Short-Term Visual Feedback Training on the Stability of the Roundhouse Kicking Technique in Young Karatekas
by Stefano Vando, Stefano Longo, Luca Cavaggioni, Lucio Maurino, Alin Larion, Pietro Luigi Invernizzi and Johnny Padulo
Int. J. Environ. Res. Public Health 2021, 18(4), 1961; https://doi.org/10.3390/ijerph18041961 - 18 Feb 2021
Cited by 4 | Viewed by 2390
Abstract
The aim of this study was to assess the efficacy of using real-time visual feedback (VF) during a one-week balance training intervention on postural sway parameters in young karatekas. Twenty-six young male karatekas (age = 14.0 ± 2.3 years) were randomly divided into [...] Read more.
The aim of this study was to assess the efficacy of using real-time visual feedback (VF) during a one-week balance training intervention on postural sway parameters in young karatekas. Twenty-six young male karatekas (age = 14.0 ± 2.3 years) were randomly divided into two groups: real-time VF training (VFT; n = 14) and control (CTRL; n = 12). Their center of pressure (COP) displacement (path length, COPpl; distance from origin, COPod) was assessed pre- and post-training on a Wii Balance Board platform in two positions (Flex: knee of the supporting leg slightly bent, maximum hip and leg flexion of the other leg; Kick: knee of the supporting leg slightly bent, mawashi-geri posture for the kicking leg). Both groups trained twice a day for seven days, performing a one-legged stance on the non-dominant limb in the Kick position. During the training, VFT received real-time VF of COP displacement, while CTRL looked at a fixed point. No interaction effect was found (p > 0.05). VFT exhibited greater changes pre- and post-training in Flex COPpl (−25.2%, g = 1.5), Kick COPpl (−24.1%, g = 1.3), and Kick COPod (−44.1%, g = 1.0) compared to CTRL (−0.9–−13.0%, g-range: 0.1–0.7). It is possible that superimposing real-time VF to a week-long balance training intervention could induce a greater sport-specific balance-training effect in young karatekas. Full article
Show Figures

Figure 1

Figure 1
<p>Testing position for single-leg balance. (<b>a</b>) Flex: knee of the supporting leg slightly bent, maximum hip and leg flexion of the other leg; (<b>b</b>) Kick: knee of the supporting leg slightly bent, mawashi-geri posture for the kicking leg. Note: training was performed as in (<b>b</b>).</p>
Full article ">
19 pages, 2492 KiB  
Article
Plasma Interleukin-10 and Cholesterol Levels May Inform about Interdependences between Fitness and Fatness in Healthy Individuals
by Francesco Sartor, Jonathan P. Moore and Hans-Peter Kubis
Int. J. Environ. Res. Public Health 2021, 18(4), 1800; https://doi.org/10.3390/ijerph18041800 - 12 Feb 2021
Cited by 1 | Viewed by 2609
Abstract
Relationships between demographic, anthropometric, inflammatory, lipid and glucose tolerance markers in connection with the fat but fit paradigm were investigated by supervised and unsupervised learning. Data from 81 apparently healthy participants (87% females) were used to generate four classes of fatness and fitness. [...] Read more.
Relationships between demographic, anthropometric, inflammatory, lipid and glucose tolerance markers in connection with the fat but fit paradigm were investigated by supervised and unsupervised learning. Data from 81 apparently healthy participants (87% females) were used to generate four classes of fatness and fitness. Principal Component Analysis (PCA) revealed that the principal component was preponderantly composed of glucose tolerance parameters. IL-10 and high-density lipoprotein, low-density lipoprotein (LDL), and total cholesterol, along with body mass index (BMI), were the most important features according to Random Forest based recursive feature elimination. Decision Tree classification showed that these play a key role into assigning each individual in one of the four classes, with 70% accuracy, and acceptable classification agreement, κ = 0.54. However, the best classifier with 88% accuracy and κ = 0.79 was the Naïve Bayes. LDL and BMI partially mediated the relationship between fitness and fatness. Although unsupervised learning showed that the glucose tolerance cluster explains the highest quote of the variance, supervised learning revealed that the importance of IL-10, cholesterol levels and BMI was greater than the glucose tolerance PCA cluster. These results suggest that fitness and fatness may be interconnected by anti-inflammatory responses and cholesterol levels. Randomized controlled trials are needed to confirm these preliminary outcomes. Full article
Show Figures

Figure 1

Figure 1
<p>Output of the principal component analysis: BMI = Body Mass Index, Chol = Fasting Total Cholesterol, HDL = Fasting High Density Lipoprotein, LDL = Fasting Low Density Lipoprotein, TG = Fasting TriGlycerides, Fgluc = Fasting Glucose, BetacellF = β cell Function, InsSens = Insulin Sensitivity, InsRes = Insulin Resistance, TNFalpha = Tumor Necrosis Factor α, IL-6 = Interleukin-6, IL-10 = Interleukin-6, RER = Respiratory Exchange Ratio, Sex.0 = females, Sex.1 = males.</p>
Full article ">Figure 2
<p>Clustering of the categorical variable, including the four fatness and fitness permutations. Relationship between the first principal component and the second principal component computed by PCA. The size of the icons for the single individuals shows their weight in classification. HFHF = Higher-Fatness with Higher-Fitness group, HFLF = Higher-Fatness with Lower-Fitness group, LFHF = Lower-Fatness with Higher-Fitness group, LFLF = Lower-Fatness with Lower -Fitness group.</p>
Full article ">Figure 3
<p>Recursive feature elimination; in green are depicted the variables that are certain. IL6. = Interleukin-6, IL-10 = Interleukin-6, RER = Respiratory Exchange Ratio, Sex.0 = females, Sex.1 = males, Dim.1 = Dimension 1 of the PCA, Dim.2 = Dimension 2 of the PCA Dim.3 = Dimension 3 of the PCA, Dim.4 = Dimension 4 of the PCA, Dim.5 = Dimension 5 of the PCA.</p>
Full article ">Figure 4
<p>Confusion Matrices, and accuracy of the four classification models. ACC = accuracy, HFHF = Higher-Fatness with Higher-Fitness group, HFLF = Higher-Fatness with Lower-Fitness group, LFHF = Lower-Fatness with Higher-Fitness group, LFLF = Lower-Fatness with Lower -Fitness group.</p>
Full article ">Figure 5
<p>Decision tree, where HDL = High Density Lipoprotein, LDL = Low Density Lipoprotein, IL-10 = Interleukin-10 and BMI = Body Mass Index are expressed in their original dimensions (mmol/L, mmol/L, pg/mL, respectively). HFHF = Higher-Fatness with Higher-Fitness group, HFLF = Higher-Fatness with Lower-Fitness group, LFHF = Lower-Fatness with Higher-Fitness group, LFLF = Lower-Fatness with Lower -Fitness group.</p>
Full article ">Figure 6
<p>Quantile–quantile plots of the variables that showed partial mediation.</p>
Full article ">Figure 7
<p>Decomposed Mediation Analysis plot: ACME = Average Causal Mediation Effect, ADE = Average Direct Effect, LDL = Low Density Lipoprotein, BMI = Body Mass Index.</p>
Full article ">
12 pages, 523 KiB  
Article
Effects of a HIIT Protocol on Cardiovascular Risk Factors in a Type 1 Diabetes Mellitus Population
by Jesús Alarcón-Gómez, Joaquín Calatayud, Iván Chulvi-Medrano and Fernando Martín-Rivera
Int. J. Environ. Res. Public Health 2021, 18(3), 1262; https://doi.org/10.3390/ijerph18031262 - 31 Jan 2021
Cited by 11 | Viewed by 4812
Abstract
Cardiovascular complications are important causes of morbidity and mortality of Type 1 Diabetes Mellitus (T1DM) people. Regular exercise is strongly recommended to these patients due to its preventive action against this type of disease. However, a large percentage of patients with T1DM people [...] Read more.
Cardiovascular complications are important causes of morbidity and mortality of Type 1 Diabetes Mellitus (T1DM) people. Regular exercise is strongly recommended to these patients due to its preventive action against this type of disease. However, a large percentage of patients with T1DM people present a sedentary behavior, mainly, because of the fear of a post-exercise hypoglycemia event and lack of time. High-intensity interval training (HIIT) is an efficient and safe methodology since it prevents hypoglycemia and does not require much time, which are the main barriers for this population to doing exercise and increasing physical conditioning. Nineteen sedentary adults (37 ± 6.5 years) with T1DM were randomly assigned to 6 weeks of either HIIT, 12 bouts first 2 weeks, 16 bouts in weeks 3 and 4, and 20 bouts in the last two weeks x 30-s intervals interspersed with 1-min rest periods, performed thrice weekly or to control group, which did not train. VO2max, body composition, heart rate variability (HRV), and fasting glucose were measured as cardiovascular risk factors. We suggest that the 6-week HIIT program used in the present study is safe since no severe hypoglycemia was reported and is an effective strategy in improving VO2max, body composition, HRV, and fasting glucose, which are important cardiovascular risk factors in T1DM people. Full article
Show Figures

Figure 1

Figure 1
<p>Flow diagram of inclusion of patients in the study.</p>
Full article ">
8 pages, 346 KiB  
Article
Predictors of Athlete’s Performance in Ultra-Endurance Mountain Races
by Pedro Belinchón-deMiguel, Pablo Ruisoto, Beat Knechtle, Pantelis T. Nikolaidis, Beliña Herrera-Tapias and Vicente Javier Clemente-Suárez
Int. J. Environ. Res. Public Health 2021, 18(3), 956; https://doi.org/10.3390/ijerph18030956 - 22 Jan 2021
Cited by 15 | Viewed by 3403
Abstract
Background: In previous studies, ultra-endurance performance has been associated with training and psychological variables. However, performance under extreme conditions is understudied, mainly due to difficulties in making field measures. Aim: The aim of this study was to analyze the role of training, hydration, [...] Read more.
Background: In previous studies, ultra-endurance performance has been associated with training and psychological variables. However, performance under extreme conditions is understudied, mainly due to difficulties in making field measures. Aim: The aim of this study was to analyze the role of training, hydration, nutrition, oral health status, and stress-related psychological factors in athletes’ performance in ultra-endurance mountain events. Methods: We analyzed the variables of race time and training, hydration state, nutrition, oral health status, and stress-related psychological factors in 448 ultra-endurance mountain race finishers divided into three groups according to race length (less than 45 km, 45–90 km, and greater than 90 km), using a questionnaire. Results: Higher performance in ultra-endurance mountain races was associated with better oral health status and higher accumulative altitude covered per week as well as higher positive accumulative change of altitude per week during training. In longer distance races, experience, a larger volume of training, and better hydration/nutrition prior to the competition were associated with better performance. Conclusions: Ultra-endurance mountain athletes competing in longer races (>90 km) have more experience and follow harder training schedules compared with athletes competing in shorter distances. In longer races, a larger fluid intake before the competition was the single best predictor of performance. For races between 45 and 90 km, training intensity and volume were key predictors of performance, and for races below 45 km, oral health status was a key predictor of performance. Psychological factors previously reported as ultra-endurance mountain race performance predictors were inconsistent or failed to predict the performance of athletes in the present research. Full article

2020

Jump to: 2022, 2021

8 pages, 590 KiB  
Article
Acute Effects of Different Postactivation Potentiation Protocols on Traditional Rowing Performance
by Alfonso Penichet-Tomas, Jose M. Jimenez-Olmedo, Luis Serra Torregrosa and Basilio Pueo
Int. J. Environ. Res. Public Health 2021, 18(1), 80; https://doi.org/10.3390/ijerph18010080 - 24 Dec 2020
Cited by 7 | Viewed by 3405
Abstract
Postactivation potentiation (PAP) describes an initial muscular activation with a submaximal or maximal load intensity that produces acute improvements in muscle power and performance in subsequent explosive activities. The objective of this study was to compare the effect of different PAP protocols in [...] Read more.
Postactivation potentiation (PAP) describes an initial muscular activation with a submaximal or maximal load intensity that produces acute improvements in muscle power and performance in subsequent explosive activities. The objective of this study was to compare the effect of different PAP protocols in rowing performance. A crossover design involving seven rowers was used, in which two different PAP protocols were applied: PAP of maximal conditioning contractions (PAP MCC) on a rowing ergometer to provide greater transferability and, thus, enhance the magnitude of PAP stimuli on subsequent rowing performance; and PAP of maximal strength contractions (PAP MSC) in half squat and bench pull exercises, similar to the main exercises in rowing strength training, to perform a 20 s “all-out” test simulating a competition start. Student’s t-test was used to compare means of the variables (p < 0.05). Effect size statistics were calculated using Cohen’s d. The PAP MCC protocol resulted in significant differences, with an extremely large effect size in average power output (p = 0.034, d = 0.98) in the first 3 (p = 0.019, d = 1.15) and first 5 (p = 0.036, d = 0.91) strokes. This group also reached a greater number of strokes (p = 0.049, d = 2.29) and strokes per minute (p = 0.046, d = 1.15). PAP with maximal conditioning contractions in rowing warm-up enhanced subsequent rowing sprint and is an advisable strategy to potentiate performance at the start of rowing competitions and sprint regattas. Full article
Show Figures

Figure 1

Figure 1
<p>Schematic representation of the study design.</p>
Full article ">Figure 2
<p>Differences in technique for (<b>a</b>) the first 3 strokes and (<b>b</b>) after the first 3 strokes.</p>
Full article ">
10 pages, 745 KiB  
Article
Are There Differences in Concentric Isokinetic Strength Perfor-Mance Profiles between International and Non-International Elite Soccer Players?
by Robert Śliwowski, Jakub Marynowicz, Monika Grygorowicz, Andrzej Wieczorek and Łukasz Jadczak
Int. J. Environ. Res. Public Health 2021, 18(1), 35; https://doi.org/10.3390/ijerph18010035 - 23 Dec 2020
Cited by 11 | Viewed by 2690
Abstract
The purpose of this study is to evaluate the differences in concentric isokinetic strength characteristics of the knee extensor and knee flexor musculature between international (IL) and non-international level (N-IL) soccer players. The second aim is to establish strength symmetry status in knee [...] Read more.
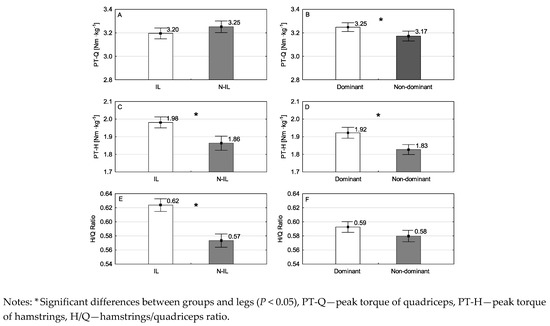
The purpose of this study is to evaluate the differences in concentric isokinetic strength characteristics of the knee extensor and knee flexor musculature between international (IL) and non-international level (N-IL) soccer players. The second aim is to establish strength symmetry status in knee muscles for dominant (DL) and non-dominant (NDL) legs for both within and between groups. 100 male top elite soccer players (IL: n = 36, age = 27.5 ± 3.4 years and N-IL: n = 64, age = 27.7 ± 6.4 years) underwent concentric isokinetic strength tests, using a Biodex System 3 dynamometer. Results indicate that statistically significant differences between groups were noted for peak torque of hamstrings (PT-H), hamstrings/quadriceps (H/Q) ratio, and total work of hamstrings (TW-H), where mean values for the IL were similarly higher than for the N-IL group (p = 0.006, p < 0.001, and p = 0.012, respectively). Our results also showed statistically significant differences for peak torque of quadriceps (PT-Q), PT-H, total work of quadriceps (TW-Q) and TW-H between legs, where mean values noted for the DL were higher than for the NDL for both groups (p = 0.021, p < 0.001, p = 0.006, and p = 0.004, respectively). Additional results show that IL players presented more symmetrical strength between legs than N-IL. The results of this study indicate that that the greatest differences in isokinetic strength performance across players at different soccer levels relate to the hamstring muscle. As a result, systematic strength training of these muscle groups is strongly recommended. Full article
Show Figures

Figure 1

Figure 1
<p>Mean values and standard error for PT of quadriceps and hamstrings by: (<b>A</b>,<b>C</b>) soccer player groups (international, non-international); (<b>B</b>,<b>D</b>) legs (dominant, non-dominant), and H/Q ratios by: (<b>E</b>) soccer player groups (international, non-international); (<b>F</b>) legs (dominant, non-dominant).</p>
Full article ">Figure 2
<p>Mean values and standard error for TW of quadriceps and hamstrings (<b>A</b>,<b>C</b>) across soccer player groups (international, non-international); (<b>B</b>,<b>D</b>) legs (dominant, non-dominant).</p>
Full article ">
15 pages, 831 KiB  
Article
Considerations for the Design of a Physical Fitness Battery to Assess Adults with Intellectual Disabilities: Preliminary Reference Values for the SAMU DIS-FIT Study
by Ruth Cabeza-Ruiz
Int. J. Environ. Res. Public Health 2020, 17(24), 9280; https://doi.org/10.3390/ijerph17249280 - 11 Dec 2020
Cited by 5 | Viewed by 2276
Abstract
For the assessment of the health-related physical fitness (PF) of individuals with intellectual disabilities (ID), tools designed for people without disabilities have generally been used. Also, the results of these assessments have routinely been compared with the scores obtained by people without ID. [...] Read more.
For the assessment of the health-related physical fitness (PF) of individuals with intellectual disabilities (ID), tools designed for people without disabilities have generally been used. Also, the results of these assessments have routinely been compared with the scores obtained by people without ID. The objectives of the present study are to present the rationale for the design of an assessment battery for PF, the so-called SAMU DIS-FIT battery, and to present the results obtained by the participants classified according to age, sex, and level of PF (physical fitness). The selection criteria for the tests that would make up the battery were: (i) utility, (ii) psychometric properties, (iii) easiness and diversity, (iv) simplicity of execution, (v) familiarity and motivation, and (vi) economy of resources. A cross-sectional study was designed to assess the PF of 261 individuals with ID. To interpret the results obtained by the participants, each of the quantitative variables of PF was categorized into three levels: lower-fit, mid-fit, and higher-fit. The findings of this study serve as a first step in establishing PF baseline values for individuals with ID. Full article
Show Figures

Figure 1

Figure 1
<p>Study flowchart.</p>
Full article ">
13 pages, 6062 KiB  
Brief Report
Descriptive Kinematic Analysis of the Potentially Tragic Accident at the 2020 Austrian MotoGP Grand Prix Using Low-Cost Instruments: A Brief Report
by Marco Gervasi, Erica Gobbi, Valentina Natalucci, Stefano Amatori and Fabrizio Perroni
Int. J. Environ. Res. Public Health 2020, 17(21), 7989; https://doi.org/10.3390/ijerph17217989 - 30 Oct 2020
Cited by 1 | Viewed by 2419
Abstract
Background: During the first Austrian MotoGP Grand Prix of 2020, following a serious accident involving the riders J. Zarco and F. Morbidelli, Morbidelli’s riderless bike cartwheeled across turn 3, narrowly missing V. Rossi and M. Viñales by just a few centimeters. As is [...] Read more.
Background: During the first Austrian MotoGP Grand Prix of 2020, following a serious accident involving the riders J. Zarco and F. Morbidelli, Morbidelli’s riderless bike cartwheeled across turn 3, narrowly missing V. Rossi and M. Viñales by just a few centimeters. As is the case with ordinary traffic accidents, analyzing the dynamics of motorcycle racing accidents can help improve safety; however, to date, the literature lacks studies that analyze the causes and severity of such accidents. Hence, the purpose of this study was to analyze the main causes that led to the accident at the 2020 Austrian MotoGp Grand Prix, to quantify the speeds and distances of the bikes and riders involved, and to hypothesize several alternative scenarios using a low-cost method. Method: Kinovea and Google Earth Pro software were used to identify markers along the racetrack and to measure the distances and calculate the time it took the motorcycles to cover those distances. The analyses were carried out on three 30-fps (frames per second) videos. Results: Zarco’s average speed as he was overtaking Morbidelli on the straightaway before turn 2 was 302 ± 1.8 km/h, higher than that of Rins and Rossi (299.7 ± 1.7 and 296 ± 1.7 km/h, respectively). The speed of Zarco and Rossi’s bikes 44.5 m before the crash was the same (267 ± 7.9 km/h). Immediately after overtaking Morbidelli, Zarco moved 2.92 m towards the center of the racetrack from point A to B, crossing Morbidelli’s trajectory and triggering the accident. Morbidelli’s riderless bike flew across turn 3 at a speed of about 76 km/h, missing V. Rossi by just 20 cm. The consequences could have been catastrophic if Rossi had not braked just 0.42 s before encountering Morbidelli’s bike in turn 3. Conclusion: Through a low-cost quali-quantitative analysis, the present study helps us to gain a deeper understanding of the dynamics of the accident and its main causes. Furthermore, in light of our findings regarding the dynamics and severity of the accident and the particular layout of the Red Bull Ring circuit, racers should be aware that overtaking at the end of turn 2, following the same trajectory as the riders involved in the crash, could be very risky. Full article
Show Figures

Figure 1

Figure 1
<p>An overview of the Red Bull Ring circuit, Austria: points from 1 to 10 represent the turns in the track.</p>
Full article ">Figure 2
<p>Chart showing the analytical procedures applied in the study.</p>
Full article ">Figure 3
<p>Satellite image showing the section of the straightaway from point A0 (corresponding to the point where the asphalt ends and the grass begins on the outer edge of the track) to point A (line between points G and H, where a shadow was cast directly under the “myWorld” billboard). The distance from A0 to A measures 288 m.</p>
Full article ">Figure 4
<p>Satellite image showing the section of the straightaway before turn 3. The white arrows indicate a billboard and the first white stripe on the left side of the track (race direction). The red dashed lines were traced from point G to point H and from point E to point F. Points A and B indicate the crossing of the front wheel of Zarco’s bike, as well as the front wheels of the other riders under consideration. The distance from point A to point B measures 44.5 m.</p>
Full article ">Figure 5
<p>Satellite image showing the section of the straightaway leading into turn 3. Point C corresponds to a marker on the internal curb of turn 3, the point where Morbidelli’s bike began cartwheeling across the track. Point D is shown by a marker on the outer edge of turn 3 with a trajectory that follows the line of the straightaway, the same trajectory that Morbidelli’s bike followed as it cartwheeled across the curve. The line from C to D measures 14 m.</p>
Full article ">Figure 6
<p>Distance between point G and point H: 12 m; distance between point E and point F: 12 m. The colored lines represent the trajectories of the first nine riders traced from point A, where the front wheels of the bikes cross the line between G and H, and point B, where they cross the line between E and F. We also reported the distance between Zarco’s Front Wheel and point G (FWG) and between his Front Wheel and point E (FWE): FWG: 0.98 m; FWE: 3.90 m.</p>
Full article ">Figure 7
<p>Representation of the dynamics of the accident showing that Zarco crossed Morbidelli’s trajectory immediately after overtaking him as he moved towards the center of the track.</p>
Full article ">Figure 8
<p>Rossi’s actual speed and instantaneous G-Force peak from point A to the point where he narrowly missed colliding with Morbidelli’s bike. The circled area shows the moment in which Rossi braked, reducing his speed by 10 km/h in 0.03 s.</p>
Full article ">Figure 9
<p>Rossi’s actual speed (moving an average of 5 points), 33 frames before the point where he narrowly missed colliding with Morbidelli’s careening bike. As described in the legend, the solid dots represent Rossi’s real speed and the solid triangles represent the speed in hypothetical scenario 1, while the empty dots represent the speed in scenario 2.</p>
Full article ">Figure 10
<p>The frame capturing the exact instant when Morbidelli’s bike crossed Rossi’s path. Kinovea was used to measure the distances based on the measurement of the rear wheel of Morbidelli’s bike. Specifically, the white arrows indicate the 60-cm diameter of Morbidelli’s rear wheel (black circle); the green arrows represent the exact distance between Rossi’s front wheel and Morbidelli’s rear wheel; the yellow and red arrows indicate the distance that Rossi’s bike would have covered if he had slowed down according to scenario 1 (about 40 cm) and scenario 2 (about 76 cm), respectively.</p>
Full article ">
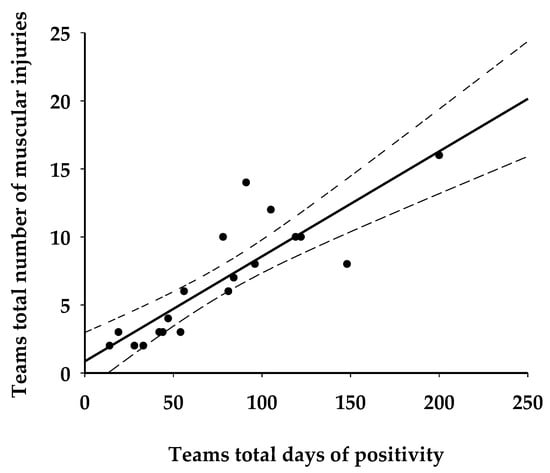
Back to TopTop