Nothing Special   »   [go: up one dir, main page]

You seem to have javascript disabled. Please note that many of the page functionalities won't work as expected without javascript enabled.


Health Economics & Finance and Global Public Health

A topical collection in Healthcare (ISSN 2227-9032). This collection belongs to the section "Health Policy".

Viewed by 146379

Editor


E-Mail Website
Guest Editor
College of Health Sciences, Jackson State University, 350 W. Woodrow Wilson Dr., Jackson, MS 39213, USA
Interests: health economics; healthcare finance; public health; global health
Special Issues, Collections and Topics in MDPI journals

Topical Collection Information

Dear Colleagues,

We call for papers for a Special Issue that focuses on global health as well as health economics and finance. The interconnected fluid network formed by the flow of cash, commodities, and communication technologies aided by human mobility helps to address healthcare reform, access, and efficiency in this globalized world. Topics regarding aging and the cost of addressing the spread of COVID-19 and health disparities is actually the epitome of globalization.

The aim of this Special Issue is to help disseminate innovative scholarship and strategies to advance global health, with a particular focus on health economics and finance and their far-reaching ramifications.

Original research, reviews, perspectives, and research notes on any topic relevant to global health are welcome. Multidisciplinary manuscripts related to all aspects of health economics & finance and global health are significant, and those relating to the association of the Global Burden of Disease (GBD) and non-communicable diseases are also eligible to be considered. Additionally, manuscripts on health equity, global health security, implementation research, social determinants of health, population health, and other urgent and neglected global health issues are welcome.

The journal adheres to rigorous standards of peer review and will consider all manuscripts on the basis of ethical and methodological integrity and potential to contribute to the extant body of knowledge. We welcome quality articles in the above areas from scholars from around the world.

Prof. Mustafa Z. Younis
Guest Editor

Manuscript Submission Information

Manuscripts should be submitted online at www.mdpi.com by registering and logging in to this website. Once you are registered, click here to go to the submission form. Manuscripts can be submitted until the deadline. All submissions that pass pre-check are peer-reviewed. Accepted papers will be published continuously in the journal (as soon as accepted) and will be listed together on the collection website. Research articles, review articles as well as short communications are invited. For planned papers, a title and short abstract (about 100 words) can be sent to the Editorial Office for announcement on this website.

Submitted manuscripts should not have been published previously, nor be under consideration for publication elsewhere (except conference proceedings papers). All manuscripts are thoroughly refereed through a single-blind peer-review process. A guide for authors and other relevant information for submission of manuscripts is available on the Instructions for Authors page. Healthcare is an international peer-reviewed open access semimonthly journal published by MDPI.

Please visit the Instructions for Authors page before submitting a manuscript. The Article Processing Charge (APC) for publication in this open access journal is 2700 CHF (Swiss Francs). Submitted papers should be well formatted and use good English. Authors may use MDPI's English editing service prior to publication or during author revisions.
Keywords

  • Health Economics & Finance
  • Global Health

Published Papers (38 papers)

2023

Jump to: 2022, 2021

11 pages, 1255 KiB  
Article
Opportunities and Threats of the Legally Facilitated Performance-Based Managed Entry Agreements in Slovakia: The Early-Adoption Perspective
by Petra Hospodková, Klára Gilíková, Miroslav Barták, Elena Marušáková and Aleš Tichopád
Healthcare 2023, 11(8), 1179; https://doi.org/10.3390/healthcare11081179 - 19 Apr 2023
Cited by 2 | Viewed by 1928
Abstract
Slovakia has adopted an amendment to Act No. 363/2011, regulating, among other things, drug reimbursement and is undergoing a significant change in the availability of innovative treatments for patients. High expectations are associated with arrangements related to performance-based managed entry agreements. Opinions and [...] Read more.
Slovakia has adopted an amendment to Act No. 363/2011, regulating, among other things, drug reimbursement and is undergoing a significant change in the availability of innovative treatments for patients. High expectations are associated with arrangements related to performance-based managed entry agreements. Opinions and positions towards this change appear to be inconsistent, and for the further application of the law in practice and when setting up the main implementation processes, it is necessary to understand the positions and opinions of the individual actors who are involved in the PB-MEA process. The interviews were conducted in the period from 20 May to 15 August 2022 around the same time as the finalisation of the amendment to Act No. 363/2011 and its adoption. A roughly one-hour open interview was conducted on a sample of 12 stakeholders in the following groups: representatives of the Ministry of Health, health-care providers, pharmaceutical companies and others, including a health insurance company. The main objective was to qualitatively describe the perception of this topic by key stakeholders in Slovakia. The responses were analysed using MAXQDATA 2022 software to obtain codes associated with key expressions. We identified three main strong top categories of expressions that strongly dominated the pro-management interviews with stakeholders: legislation, opportunities and threats. Ambiguity and insufficient coverage of the new law, improved availability of medicinal products and threats associated with data, IT systems and potentially unfavourable new reimbursement schemes were identified as key topics of each of the said top categories, respectively. Among individual sets of respondents, there is frequent consensus on both opportunities and threats in the area of implementing process changes in PB-MEA. For the successful implementation of the law in practice, some basic threats need to be removed, among which in particular is insufficient data infrastructure. Full article
Show Figures

Figure 1

Figure 1
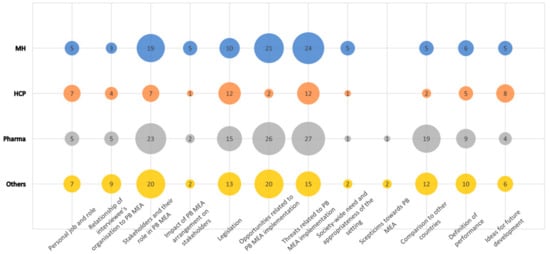
<p>Frequency chart of codes in the top-level categories by occupational group.</p>
Full article ">Figure 2
<p>Legislation: frequency chart of codes in defined sub-categories within the category legislation by occupational group.</p>
Full article ">Figure 3
<p>Opportunities: frequency chart of codes in defined sub-categories within the category opportunities related to the PB MEA implementation by occupational group.</p>
Full article ">Figure 4
<p>Threats: Frequency chart of codes in the sub-categories within the category threats related to the PB MEA implementation by occupational group.</p>
Full article ">

2022

Jump to: 2023, 2021

12 pages, 258 KiB  
Article
Reform of the Health Insurance Funding Model to Improve the Care of Noncommunicable Diseases Patients in Saudi Arabia
by Ahmed Hazazi, Andrew Wilson and Shaun Larkin
Healthcare 2022, 10(11), 2294; https://doi.org/10.3390/healthcare10112294 - 16 Nov 2022
Cited by 5 | Viewed by 4608
Abstract
Health insurance models are being considered as part of health system reforms in Saudi Arabia. This paper assesses the attributes of health funding models that support better control of non-communicable diseases (NCDs) and perspectives on health insurance as a model from the perspective [...] Read more.
Health insurance models are being considered as part of health system reforms in Saudi Arabia. This paper assesses the attributes of health funding models that support better control of non-communicable diseases (NCDs) and perspectives on health insurance as a model from the perspective of patients, clinicians, and managers. The study employed a mixed-methods research design that included quantitative and qualitative data gathering and analysis. Study findings indicated concerns that the current health funding mechanism is financially unsustainable and, as a result, there will be a greater reliance on personal health insurance to support government spending on healthcare. Essential elements of any health insurance model to support effective NCD management identified from a review of the literature and interviews include the following: ensuring continuity of care and equity; funding chronic disease prevention interventions; prioritising primary healthcare; and maintaining the principle of community rating to prevent insurers from discriminating against members. Other desirable attributes for the funding model includes collaboration across primary, secondary, and tertiary care. Healthcare finance reform aimed at adopting and increasing personal health insurance coverage may play a critical role in extending access to healthcare, eliminating health inequities, enhancing population health, and reducing government spending on healthcare if appropriately considered. Full article
19 pages, 676 KiB  
Article
The Associations between Childhood Experiences and Occupational Choice Capability, and the Mediation of Societal Gender Roles
by Orhan Koçak, Meryem Ergin and Mustafa Z. Younis
Healthcare 2022, 10(6), 1004; https://doi.org/10.3390/healthcare10061004 - 29 May 2022
Cited by 1 | Viewed by 3760
Abstract
Experiences in family, school, and social life during childhood are associated with gender roles and occupational choice capability. This study examines how competent individuals are in occupational choice capability and the relationships of childhood experiences and gender roles with their competencies in occupational [...] Read more.
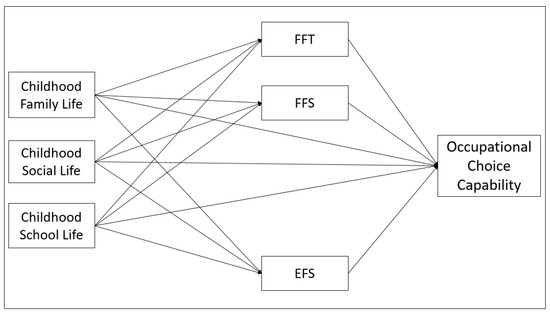
Experiences in family, school, and social life during childhood are associated with gender roles and occupational choice capability. This study examines how competent individuals are in occupational choice capability and the relationships of childhood experiences and gender roles with their competencies in occupational choice capability. The research is composed of 805 individuals aged 18 and older, who reside in Turkey. In the research, we used the Personal Information Form, Childhood Experiences Scale, Gender Roles Attitude Scale, and The Scale of Occupational Choice Capability. The SPSS 25 program and PROCESS-Macro were used to analyze the variables. The relationship between the scales was investigated using Pearson correlation analysis and multiple regression analysis. According to the findings we obtained, individuals’ family and school life were positively correlated with their career choices, and family function sexism harmed their choice of profession. We also found gender roles had a mediating role in the relationship between school life and career choice. Full article
Show Figures

Figure 1

Figure 1
<p>Conceptual Diagram of Model.</p>
Full article ">Figure 2
<p>Results of the Proposed Conceptual Model.</p>
Full article ">
11 pages, 284 KiB  
Article
Direct and Indirect Costs Related to Physical Activity Levels in Patients with Diabetes Mellitus in Spain: A Cross-Sectional Study
by Antonio Sarria-Santamera, Zhanna Alexeyeva, Mei Yen Chan, Miguel A. Ortega, Angel Asunsolo-del-Barco and Carlos Navarro-García
Healthcare 2022, 10(4), 752; https://doi.org/10.3390/healthcare10040752 - 18 Apr 2022
Cited by 4 | Viewed by 2585
Abstract
Diabetes mellitus (DM) is a global public health concern. DM is importantly linked to the modern lifestyle. Lifestyle-based interventions currently represent a critical preventive and therapeutic approach for patients with DM. Increasing physical activity has proven multiple benefits to prevent this condition; however, [...] Read more.
Diabetes mellitus (DM) is a global public health concern. DM is importantly linked to the modern lifestyle. Lifestyle-based interventions currently represent a critical preventive and therapeutic approach for patients with DM. Increasing physical activity has proven multiple benefits to prevent this condition; however, there is still room for further progress in this field, especially in terms of the effect of exercise in patients with already established DM. This study intends to examine the economic relationship between physical activity and direct/indirect costs in patients with DM. We analyze a national representative sample (n = 1496) of the general population of Spain, using available data from the National Health Survey of 2017 (NHS 2017). Our results show that 63.7% of the sample engaged in some degree of physical activity, being more frequent in men (67.5%), younger individuals (80.0%), and those with higher educational levels (69.7%). Conversely, lower levels of physical activity were associated with female sex, older subjects, and various comorbidities. Our study estimates that 2151 € per (51% in direct costs) patient may be saved if a minimum level of physical activity is implemented, primarily, due to a decrease in indirect costs (absenteeism and presenteeism). This study shows that physical activity will bring notable savings in terms of direct and indirect costs in patients with DM, particularly in some vulnerable groups. Full article
9 pages, 254 KiB  
Article
Public Health Financing and Responses to COVID-19: Lessons from South Korea
by Hyeki Park, Boram Sim, Bo Zhao and Eun Woo Nam
Healthcare 2022, 10(4), 750; https://doi.org/10.3390/healthcare10040750 - 18 Apr 2022
Cited by 5 | Viewed by 3140
Abstract
Health financing strategies contribute significantly to containing the outbreak of the Coronavirus disease 2019 (COVID-19). This study aims to reassess Korea’s financing strategies in response to COVID-19 in 2020, to ascertain its effects and sustainability. The Joint External Evaluation tool was adopted to [...] Read more.
Health financing strategies contribute significantly to containing the outbreak of the Coronavirus disease 2019 (COVID-19). This study aims to reassess Korea’s financing strategies in response to COVID-19 in 2020, to ascertain its effects and sustainability. The Joint External Evaluation tool was adopted to analyze the data collected from government reports, official statistics, and other sources. Findings show that Korea could maintain a low incidence and fatality rate compared with other countries, at low costs. It was a result of rapidly procured healthcare resources based on laws and policies established after the 2015 epidemic, and the National Health Insurance. However, to achieve long-term sustainability, it is important to enhance the financial stability of the national health insurance and increase the proportion of the public sector in healthcare resources. Full article
14 pages, 965 KiB  
Article
Socio-Economic, Demographic and Health Determinants of the COVID-19 Outbreak
by Ayfer Ozyilmaz, Yuksel Bayraktar, Metin Toprak, Esme Isik, Tuncay Guloglu, Serdar Aydin, Mehmet Firat Olgun and Mustafa Younis
Healthcare 2022, 10(4), 748; https://doi.org/10.3390/healthcare10040748 - 18 Apr 2022
Cited by 8 | Viewed by 2746
Abstract
Objective: In this study, the effects of social and health indicators affecting the number of cases and deaths of the COVID-19 pandemic were examined. For the determinants of the number of cases and deaths, four models consisting of social and health indicators were [...] Read more.
Objective: In this study, the effects of social and health indicators affecting the number of cases and deaths of the COVID-19 pandemic were examined. For the determinants of the number of cases and deaths, four models consisting of social and health indicators were created. Methods: In this quantitative research, 93 countries in the model were used to obtain determinants of the confirmed cases and determinants of the COVID-19 fatalities. Results: The results obtained from Model I, in which the number of cases was examined with social indicators, showed that the number of tourists, the population between the ages of 15 and 64, and institutionalization had a positive effect on the number of cases. The results obtained from the health indicators of the number of cases show that cigarette consumption affects the number of cases positively in the 50th quantile, the death rate under the age of five affects the number of cases negatively in all quantiles, and vaccination positively affects the number of cases in 25th and 75th quantile values. Findings from social indicators of the number of COVID-19 deaths show that life expectancy negatively affects the number of deaths in the 25th and 50th quantiles. The population over the age of 65 and CO2 positively affect the number of deaths at the 25th, 50th, and 75th quantiles. There is a non-linear relationship between the number of cases and the number of deaths at the 50th and 75th quantile values. An increase in the number of cases increases the number of deaths to the turning point; after the turning point, an increase in the number of cases decreases the death rate. Herd immunity has an important role in obtaining this finding. As a health indicator, it was seen that the number of cases positively affected the number of deaths in the 50th and 75th quantile values and the vaccination rate in the 25th and 75th quantile values. Diabetes affects the number of deaths positively in the 75th quantile. Conclusion: The population aged 15–64 has a strong impact on COVID-19 cases, but in COVID-19 deaths, life expectancy is a strong variable. On the other hand, it has been found that vaccination and the number of cases interaction term has an effect on the mortality rate. The number of cases has a non-linear effect on the number of deaths. Full article
Show Figures

Figure 1

Figure 1
<p>Changes in the quantile regression coefficients for Model I. Notes: The shaded bands represent the corresponding 95% confidence intervals.</p>
Full article ">Figure 2
<p>Changes in the quantile regression coefficients for Model II. Notes: The shaded bands represent the corresponding 95% confidence intervals.</p>
Full article ">Figure 3
<p>Changes in the quantile regression coefficients for Model III. Notes: The shaded bands represent the corresponding 95% confidence intervals.</p>
Full article ">Figure 4
<p>Changes in the quantile regression coefficients for Model IV. Notes: The shaded bands represent the corresponding 95% confidence intervals.</p>
Full article ">
11 pages, 627 KiB  
Article
Healthcare Utilization with Drug Acquisition and Expenses at the National Health Insurance Fund in Sudan
by Yasir Ahmed Mohammed Elhadi, Abdelmuniem Ahmed, Ramy Mohamed Ghazy, Elhadi B. Salih, Osman S. Abdelhamed, Ramy Shaaban, Hammad Mohamed Hammad Mohamed, Alanood Elnaeem Mohamed, Noha Ahmed El Dabbah and Ashraf Ahmed Zaher Zaghloul
Healthcare 2022, 10(4), 630; https://doi.org/10.3390/healthcare10040630 - 27 Mar 2022
Cited by 2 | Viewed by 4654
Abstract
Background: Understanding the pattern of care use can provide valuable information for reform interventions. This study investigates the pattern of healthcare utilization and its association with drug acquisition patterns and expenses in the National Health Insurance Fund (NHIF) of Al Jazira State in [...] Read more.
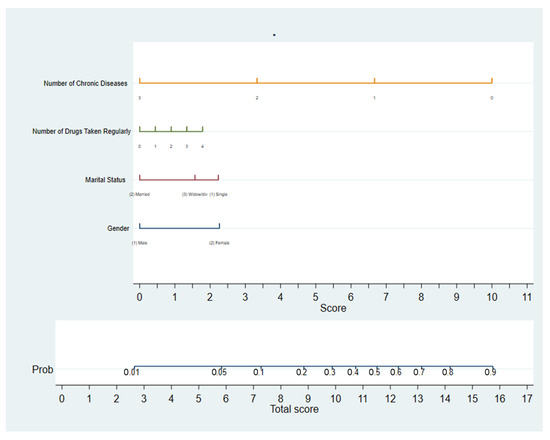
Background: Understanding the pattern of care use can provide valuable information for reform interventions. This study investigates the pattern of healthcare utilization and its association with drug acquisition patterns and expenses in the National Health Insurance Fund (NHIF) of Al Jazira State in Sudan. Methods: A cross-sectional survey was conducted at NHIF primary healthcare centers of Al Jazirah state in Sudan. Results: A total of 768 beneficiaries were interviewed, of which 63.2% reported using out-of-network physician care, while 36.8% receive care from the NHIF physician network only. More than half (60.8%) of NHIF-interviewed clients reported a heavy burden of medication costs. The pattern of physician utilization was significantly associated with the number and source of regular drugs, the burden of out-of-pocket payment, and monthly out-of-pocket expenditures on medications, (p < 0.001). The regression analysis revealed that gender, marital status, number of chronic diseases, and number of regular drugs were the significant predictors of the pattern of physician care utilization; these factors explained nearly 36% of the variance in respondents’ pattern of physician care utilization. Conclusions: An impressive proportion of out-of-network care was found in Al Jazirah State in Sudan. The NHIF stakeholders should consider medication subsidy as a potential strategy for decreasing patient leakage to out-of-network services. Full article
Show Figures

Figure 1

Figure 1
<p>Nomogram plot for the significant predictors of using out-of-network care among NHIF insured clients in Al Jazirah state.</p>
Full article ">
16 pages, 1287 KiB  
Article
The Impact of Public, Private, and Out-of-Pocket Health Expenditures on Under-Five Mortality in Malaysia
by Renuka Devi Logarajan, Norashidah Mohamed Nor, Abdalla Sirag, Rusmawati Said and Saifuzzaman Ibrahim
Healthcare 2022, 10(3), 589; https://doi.org/10.3390/healthcare10030589 - 21 Mar 2022
Cited by 6 | Viewed by 4333
Abstract
Health financing in Malaysia is intensely subsidised by public funding and is increasingly sourced by household out-of-pocket financing, yet the under-five mortality rate has been gradually increasing in the last decade. In this context, this study aims to investigate the relationship between public, [...] Read more.
Health financing in Malaysia is intensely subsidised by public funding and is increasingly sourced by household out-of-pocket financing, yet the under-five mortality rate has been gradually increasing in the last decade. In this context, this study aims to investigate the relationship between public, private, and out-of-pocket health expenditures and the under-five mortality rate in Malaysia using the autoregressive distributed lag (ARDL) estimation technique, whereby critical test values are recalculated using the response surface method for a time-series data of 22 years. The findings reveal that out-of-pocket health expenditure deteriorates the under-five mortality rate in Malaysia, while public and private health expenditures are statistically insignificant. Therefore, an effective health financing safety net may be an option to ensure an imperative child health outcome. Full article
Show Figures

Figure 1

Figure 1
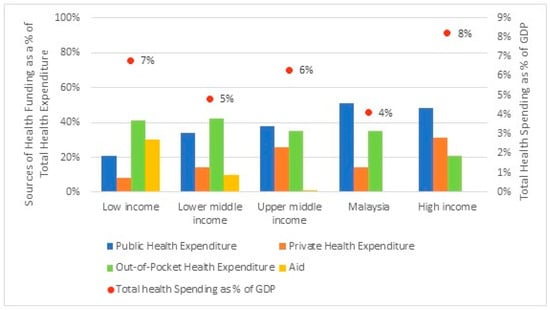
<p>Global health expenditure in 2018. Source: Report on Global Spending on Health 2020: Weathering the Storm (WHO, 2020) and Malaysia National Health Accounts: Health Expenditure Report 1997–2018 (Ministry of Health, 2020).</p>
Full article ">Figure 2
<p>Health expenditure in Malaysia, from 1997 to 2018. Source: Malaysia National Health Accounts, Health Expenditure Report 1997–2018 (Ministry of Health, 2020).</p>
Full article ">Figure 3
<p>Under-five mortality rate from 1990 to 2018. Source: Department of Statistics Malaysia and United Nations Inter-Agency Group for Child Mortality Estimation 2018.</p>
Full article ">Figure 4
<p>Cumulative sum (CUSUM) and CUSUM square test for stability.</p>
Full article ">
14 pages, 1171 KiB  
Article
Analysis of Healthcare Expenditures in Bulgaria
by Zornitsa Mitkova, Miglena Doneva, Nikolay Gerasimov, Konstantin Tachkov, Maria Dimitrova, Maria Kamusheva and Guenka Petrova
Healthcare 2022, 10(2), 274; https://doi.org/10.3390/healthcare10020274 - 30 Jan 2022
Cited by 6 | Viewed by 3250
Abstract
The growth of public expenditure worldwide has set the priority on assessment of trends and establishment of factors which generate the most significant public costs. The goal of the current study is to review the tendencies in public healthcare expenditures in Bulgaria and [...] Read more.
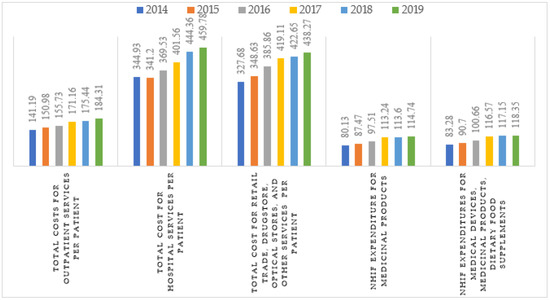
The growth of public expenditure worldwide has set the priority on assessment of trends and establishment of factors which generate the most significant public costs. The goal of the current study is to review the tendencies in public healthcare expenditures in Bulgaria and to analyze the influence of the demographic, economic, and healthcare system capacity indicators on expenditures dynamics. A retrospective, top-down, financial analysis of the healthcare system expenditures was performed. Datasets of the National Statistical Institute (NSI), National Health Insurance Fund (NHIF), and National Center of Public Health and Analysis (NCPHA) were retrospectively reviewed from2014–2019 to collect the information in absolute units of healthcare expenditures, healthcare system performance, demographics, and economic indicators. The research showed that increasing GDP led to higher healthcare costs, and it was the main factor affecting the cost growth in Bulgaria. The number of hospitalized patients and citizens in retirement age remained constant, confirming that their impact on healthcare costs was negligible. In conclusion, the population aging, average life expectancy, patient morbidity, and hospitalization rate altogether impacted healthcare costs mainly due to the multimorbidity of older people and the rising need for outpatient hospital services and medications. Full article
Show Figures

Figure 1

Figure 1
<p>Per patient cost for healthcare services during 2014–2019.</p>
Full article ">Figure 2
<p>The dependence of NHIF expenditure for medical devices, medicinal products, and dietary foods on GDP by final consumption expenditure, population at retirement age, and number of hospitalized patients.</p>
Full article ">Figure 3
<p>The dependence of total costs for outpatient services on population at retirement age, GDP by final consumption expenditure, and number of hospitalized patients for the investigated period.</p>
Full article ">Figure 4
<p>The dependence of total costs for hospital services on population at retirement age, GDP by final consumption expenditure, and number of hospitalized patients.</p>
Full article ">Figure 5
<p>The dependence of total cost for retail trade, drugstores, optical stores, and other services depending on population at retirement age, GDP by final consumption expenditure, and number of hospitalized patients.</p>
Full article ">Figure 6
<p>The dependence of NHIF expenditures for medicinal products on population at retirement age, GDP by final consumption expenditure, and number of hospitalized patients.</p>
Full article ">
27 pages, 1320 KiB  
Article
The ‘Red Herring’ Hypothesis: Some Theory and New Evidence
by Peter Zweifel
Healthcare 2022, 10(2), 211; https://doi.org/10.3390/healthcare10020211 - 21 Jan 2022
Cited by 1 | Viewed by 2427
Abstract
The ‘red herring’ hypothesis (RHH) claims that apart from income and medical technology, proximity to death rather than age constitutes the main determinant of healthcare expenditure (HCE). This paper seeks to underpin the RHH with some theory to derive new predictions also for [...] Read more.
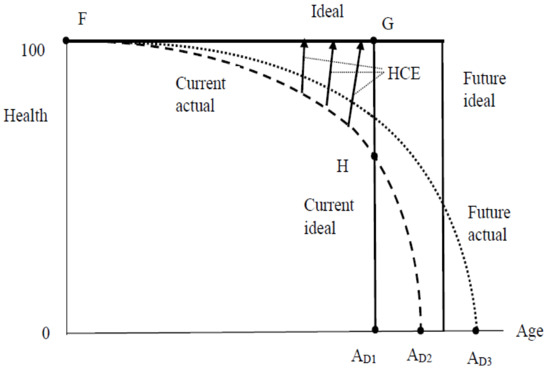
The ‘red herring’ hypothesis (RHH) claims that apart from income and medical technology, proximity to death rather than age constitutes the main determinant of healthcare expenditure (HCE). This paper seeks to underpin the RHH with some theory to derive new predictions also for a rationed setting, and to test them against published empirical evidence. One set comprising ten predictions uses women’s longer life expectancy as an indicator of the difference in time to death in their favor. Out of 28 testing opportunities drawn from the published evidence, in the case of no rationing seven out of eleven result in full and two in partial confirmation; in the case of rationing, twelve out of 17 result in full and one in partial confirmation. The other set, containing 35 testing opportunities, concerns the age profile of HCE. In the case of no rationing, seven out of twelve result in full and four in partial confirmation; in the case of rationing, eleven out of 23 in full and nine in partial confirmation. There are but ten contradictions in total. Overall, the new tests of the RHH can be said to receive a good deal of empirical support, both from countries and settings with and without rationing. Full article
Show Figures

Figure 1

Figure 1
<p>Ideal and actual health profiles, and HCE.</p>
Full article ">Figure A1
<p>Outcomes associated with the patient-physician interaction given rationing. (<b>a</b>) in efforts space (dashed no equilibrium; (<b>b</b>) in HCE space.</p>
Full article ">
15 pages, 1553 KiB  
Article
Disparities in Health Financing Allocation among Infectious Diseases in Ebola Virus Disease (EVD)-Affected Countries, 2005–2017
by Kazuki Shimizu, Francesco Checchi and Abdihamid Warsame
Healthcare 2022, 10(2), 179; https://doi.org/10.3390/healthcare10020179 - 18 Jan 2022
Cited by 4 | Viewed by 3123
Abstract
The Ebola virus disease (EVD) outbreaks impacted the population health due to overstretched health systems and disrupted essential health services. Despite a call to achieve equal financial allocation depending on public health needs, there has been scant examination of the fairness of investment [...] Read more.
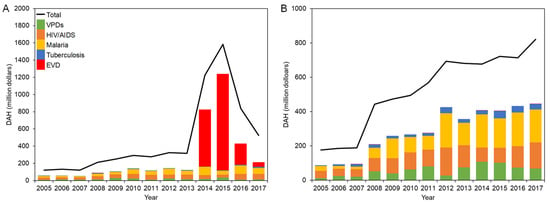
The Ebola virus disease (EVD) outbreaks impacted the population health due to overstretched health systems and disrupted essential health services. Despite a call to achieve equal financial allocation depending on public health needs, there has been scant examination of the fairness of investment among infectious diseases. This study analyzes the extent to which equitable development assistance for health (DAH) has been provided in accordance with disease burden in EVD-affected countries. Estimates of disability-adjusted life years (DALYs) in the Global Burden of Disease (GBD) Study 2017 and DAH Database 1990–2019 in 2005–2017 were analyzed by disease category: vaccine-preventable diseases (VPDs), HIV/AIDS, malaria, tuberculosis, and EVD. HIV/AIDS generally recorded higher ratios of DAH per DALYs (DAH/DALYs). Malaria and tuberculosis showed different trends by country, and VPDs generally presented lower ratios. In West Africa in 2013–2016, DAH/DALYs surged in EVD and fluctuated in HIV/AIDS and malaria. Tuberculosis and VPDs consistently recorded lower ratios. To achieve the risk reduction during and after health emergencies, optimal funding allocation between diseases based on the disease burden is warranted in the pre-emergency period, along with measurement of immediate health needs of populations in real-time during an emergency. Full article
Show Figures

Figure 1

Figure 1
<p>DAH for EVD-affected countries in 2005–2017: (<b>A</b>) West Africa; (<b>B</b>) DRC.</p>
Full article ">Figure 2
<p>DALYs in EVD-affected countries in 2005–2017: (<b>A</b>) West Africa; (<b>B</b>) DRC. Solid squares represent the point estimates of all-cause DALYs, and whiskers extend to the upper and lower 95% confidence intervals.</p>
Full article ">Figure 3
<p>DAH/DALYs in EVD-affected countries in 2005–2017: (<b>A</b>) West Africa; (<b>B</b>) DRC. The black line represents the total DAH/DALYs, and the gray area is extended to the upper and lower 95% confidence intervals based on variations of DALYs. Colored bars represent the DAH/DALYs by disease category. Whiskers extend to the upper and lower 95% confidence intervals based on variations of DALYs. A common logarithmic scale is used on the vertical axis.</p>
Full article ">Figure 4
<p>DAH/DALYs in countries in West Africa in 2005–2017: (<b>A</b>) Guinea; (<b>B</b>) Liberia; (<b>C</b>) Sierra Leone. The black line represents the total DAH/DALYs, and the gray area is extended to the upper and lower 95% confidence intervals based on variations of DALYs. Colored bars represent the DAH/DALYs by disease category. Whiskers extend to the upper and lower 95% confidence intervals based on variations of DALYs. A common logarithmic scale is used on the vertical axis.</p>
Full article ">

2021

Jump to: 2023, 2022

28 pages, 1111 KiB  
Article
Willingness to Pay to Improve Quality of Public Healthcare Services in Mauritius
by Jamiil Jeetoo and Vishal Chandr Jaunky
Healthcare 2022, 10(1), 43; https://doi.org/10.3390/healthcare10010043 - 27 Dec 2021
Cited by 7 | Viewed by 6315
Abstract
Mauritius has a universal free healthcare system, based on the Beveridge model which is financed by taxpayers. There are growing considerations over improving quality of healthcare services. The purpose of the study is to employ a contingency valuation (CV) to investigate the willingness [...] Read more.
Mauritius has a universal free healthcare system, based on the Beveridge model which is financed by taxpayers. There are growing considerations over improving quality of healthcare services. The purpose of the study is to employ a contingency valuation (CV) to investigate the willingness of Mauritians people to pay to improve the quality of public healthcare services and the associated determinants using the double-bounded dichotomous choice model. A drop off survey with a sample size of 974 respondents from the working population is used. The empirical analysis shows that the majority of the sample was willing to pay for improving quality of public healthcare services. Other than the conventional determinants of respondents’ demographic and socioeconomic characteristics, the findings support the assertion that psycho-social constructs such as the Theory of Planned Behaviour, Norm-Activation, Public Good Theory, and Perceived Response Efficacy are found to significantly affect Willingness-to-Pay (WTP). The results of this study might be of use to policymakers to help with both priority setting and fund allocation. Full article
Show Figures

Figure 1

Figure 1
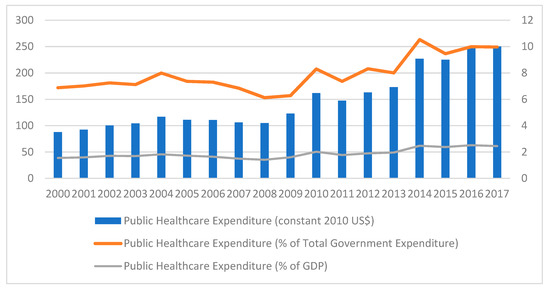
<p>Trend of Public Healthcare Expenditure. Source: Authors’ own computation.</p>
Full article ">Figure 2
<p>Evolution of Public Healthcare Expenditure as a Percentage of Total Healthcare Expenditure. Source: Authors’ own computation.</p>
Full article ">Figure 3
<p>Conceptual Model.</p>
Full article ">Figure 4
<p>Components of the TPB and their influence on the final behaviour. Source: Adapted from Fishbein and Ajzen [<a href="#B16-healthcare-10-00043" class="html-bibr">16</a>].</p>
Full article ">
14 pages, 701 KiB  
Article
A Country-Level Empirical Study on the Fiscal Effect of Elderly Population Health: The Mediating Role of Healthcare Resources
by Bo Tang and Zhi Li
Healthcare 2022, 10(1), 30; https://doi.org/10.3390/healthcare10010030 - 24 Dec 2021
Cited by 9 | Viewed by 2910
Abstract
Demographic shifts towards an aging population are becoming a significant fiscal challenge for governments. Previous research has explored the fiscal consequences of the expanding elderly population, but the impact on the elderly’s health quality is less mentioned. The balanced relationship between elderly population [...] Read more.
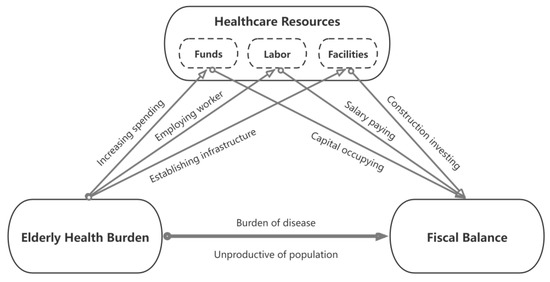
Demographic shifts towards an aging population are becoming a significant fiscal challenge for governments. Previous research has explored the fiscal consequences of the expanding elderly population, but the impact on the elderly’s health quality is less mentioned. The balanced relationship between elderly population health and public finance is a major concern of the global political agenda on the aging society. This article used cross-country panel data from 2000 to 2019 to examine the fiscal effect of the elderly health burden and the mediating role of healthcare resources. The results are demonstrated: The elderly health burden has a negative impact on fiscal balance, especially in aged society and longevity countries. Moreover, the mediating effect of healthcare resources is significant, whereby various forms of healthcare resources such as funds, labor, and facilities all have significant effects. Thus, the conceptual framework of elderly population health, healthcare resources, and public finance is confirmed that the elderly health burden specifically leads to the growing consumption of healthcare resources, which reduces the fiscal balance. It is concluded that reducing the elderly health burden and improving healthcare resource efficiencies are two feasible strategies to enhance fiscal sustainability. Full article
Show Figures

Figure 1

Figure 1
<p>Theoretical framework chart.</p>
Full article ">
14 pages, 310 KiB  
Article
Factors Associated with Out-of-Pocket Health Expenditure in Polish Regions
by Błażej Łyszczarz and Zhaleh Abdi
Healthcare 2021, 9(12), 1750; https://doi.org/10.3390/healthcare9121750 - 17 Dec 2021
Cited by 6 | Viewed by 3586
Abstract
Out-of-pocket (OOP) payments are perceived as the most regressive means of health financing. Using the panel-data approach and region-aggregated data from Statistics Poland, this research investigated associations between socio-economic factors and OOP health spending in 16 Polish regions for the period 1999–2019. The [...] Read more.
Out-of-pocket (OOP) payments are perceived as the most regressive means of health financing. Using the panel-data approach and region-aggregated data from Statistics Poland, this research investigated associations between socio-economic factors and OOP health spending in 16 Polish regions for the period 1999–2019. The dependent variable was real (inflation-adjusted) monthly OOP health expenditure per person in Polish households. Potential independent variables included economic, labour, demographic, educational, health, environmental, and lifestyle measures based on previous research. A set of panel-data estimators was used in regression models. The factors that were positively associated with OOP health spending were disposable income, the proportions of children (aged 0–9) and elderly (70+ years) in the population, healthcare supply (proxied by physicians’ density), air pollution, and tobacco and alcohol expenditure. On the other hand, the increased unemployment rate, life expectancy at age 65, mortality rate, and higher sports participation were all related to lower OOP health spending. The results may guide national strategies to improve health-care allocations and offer additional financial protection for vulnerable groups, such as households with children and elderly members. Full article
22 pages, 5893 KiB  
Article
Does Emotional Intelligence Increase Satisfaction with Life during COVID-19? The Mediating Role of Depression
by Orhan Koçak
Healthcare 2021, 9(11), 1529; https://doi.org/10.3390/healthcare9111529 - 9 Nov 2021
Cited by 5 | Viewed by 4287
Abstract
COVID-19 has spread rapidly and become a health crisis around the world, and negatively affected the mental state of individuals. Emotional intelligence (EI) can play an important role in coping with the mental problems experienced due to the pandemic. This study examined how [...] Read more.
COVID-19 has spread rapidly and become a health crisis around the world, and negatively affected the mental state of individuals. Emotional intelligence (EI) can play an important role in coping with the mental problems experienced due to the pandemic. This study examined how individuals’ emotional intelligence levels affect depression and satisfaction with life during the COVID-19 period. The study was designed as quantitative and cross-sectional and reached 578 adult participants online. Emotional intelligence trait scale–short form, depression subscale (DASS-21), satisfaction with life scale, and sociodemographic questions as control variables were used as data collection tools in the study. The data obtained were conducted using SPSS 24, PROCESS-Macro, and Amos 25 statistical programs. The hypotheses established were tested by correlation, multiple regression, mediating, and moderating analyzes. Results confirmed that emotional intelligence had a positive association with satisfaction with life and a negative association with depression. In addition, interaction analyses found that age and family type had a moderating effect on satisfaction with life, and depression had a mediating effect. After discussing the importance of emotional intelligence as a coping mechanism in dealing with problems, some suggestions were made to policymakers and practitioners. Full article
Show Figures

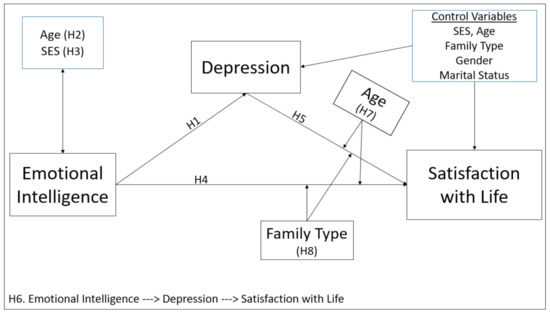
Figure 1

Figure 1
<p>Schematization of the hypothesized model.</p>
Full article ">Figure 2
<p>Interaction effect of age and EI (<b>a</b>) and age and depression (<b>b</b>) on satisfaction with life.</p>
Full article ">Figure 3
<p>Interaction effect of family type and depression on satisfaction with life.</p>
Full article ">Figure 4
<p>The results of proposed research model, * <span class="html-italic">p</span> &lt; 0.05, ** <span class="html-italic">p</span> &lt; 0.01, *** <span class="html-italic">p</span> &lt; 0.001.</p>
Full article ">
24 pages, 3649 KiB  
Review
Health Policies Based on Patient Satisfaction: A Bibliometric Study
by Mayra Soledad Grasso, María del Carmen Valls Martínez and Alicia Ramírez-Orellana
Healthcare 2021, 9(11), 1520; https://doi.org/10.3390/healthcare9111520 - 8 Nov 2021
Cited by 3 | Viewed by 3257
Abstract
Healthcare decision-makers increasingly face a changing and ever-evolving landscape, forcing them to formulate public policies based on the results from different scientific investigations. This article evaluates the field of research on patient satisfaction as a basis for health policies. The analysis was carried [...] Read more.
Healthcare decision-makers increasingly face a changing and ever-evolving landscape, forcing them to formulate public policies based on the results from different scientific investigations. This article evaluates the field of research on patient satisfaction as a basis for health policies. The analysis was carried out with a sample of 621 articles published between 2000 and 2020 in the Scopus database. The world’s largest producer and research co-operator on patient satisfaction and health policy was the United States. However, the most prolific authors, institutions, and journals are of British origin. Regarding the themes, we find that, in economic and management matters, scientific production is scarce. To study the evolution of keywords, we divided the study period into two periods of an equal number of years. In both sub-periods, the keyword “Human” stands out. In the second sub-period, the word “Perception” stands out, which indicates the current attention paid to the patient’s opinion. Full article
Show Figures

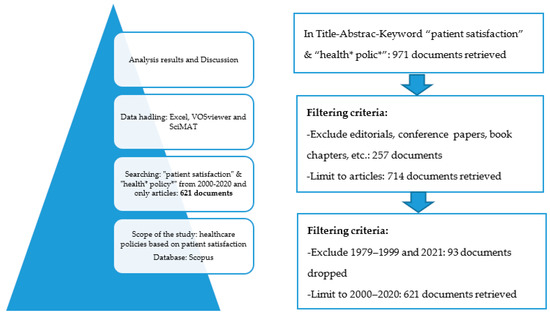
Figure 1

Figure 1
<p>The methodology followed in the selection and processing of information.</p>
Full article ">Figure 2
<p>Evolution over time of published articles and total citations.</p>
Full article ">Figure 3
<p>Documents by subject area (percentage).</p>
Full article ">Figure 4
<p>Worldwide publications on PS and HP.</p>
Full article ">Figure 5
<p>Network of cooperation based co-authorship between countries.</p>
Full article ">Figure 6
<p>Network of cooperation based on co-authorship of the prominent authors.</p>
Full article ">Figure 7
<p>Strategic diagram of keywords based on documents-average citation from 2000–2010. Source: own elaboration.</p>
Full article ">Figure 8
<p>Strategic diagram of keywords based on documents-average citation from 2011–2020. Source: Own elaboration.</p>
Full article ">Figure 9
<p>Evolution of leading keywords network based on co-occurrence (1954–2020). Own elaboration.</p>
Full article ">
10 pages, 249 KiB  
Article
Private Healthcare Expenditure in China: A Regional Comparative Analysis
by Shangguang Yang, Danyang Wang, Lu Xu, Chunlan Wang, Xi Yang and Kevin Lo
Healthcare 2021, 9(10), 1374; https://doi.org/10.3390/healthcare9101374 - 14 Oct 2021
Cited by 3 | Viewed by 2261
Abstract
Private (out-of-pocket) healthcare expenditure (PHCE) is a complex phenomenon that is shaped by many different factors. In this paper, we analyzed the influencing factors of PHCE in China, with a specific focus on regional differences. We found that old-age dependency ratio, income, and [...] Read more.
Private (out-of-pocket) healthcare expenditure (PHCE) is a complex phenomenon that is shaped by many different factors. In this paper, we analyzed the influencing factors of PHCE in China, with a specific focus on regional differences. We found that old-age dependency ratio, income, and education have significant impacts on PHCE in all regions, whereas public HCE, number of beds in medical institutions, and economic development levels have significant impacts only in some regions. The results indicate that the government should pay attention to regional inequality and implement targeted adjustments for improving the health service system. In particular, we recommend: (1) monitoring regional inequality in PHCE and other healthcare issues to unmask geographical differences in healthcare interventions; (2) adopting regional-specific policy measures—the government should divert some resources from eastern to western and central regions to increasing the support for public health undertakings and improve the quality of the local health services while providing matching medical resources by targeting the needs of the residents; (3) paying more attention to the healthcare demand of the elderly population; and (4) improving the education level of residents to improve public health and avoid high PHCE. Full article
14 pages, 378 KiB  
Article
Analysis of Health Care Billing via Quantile Variable Selection Models
by Tahir Ekin and Paul Damien
Healthcare 2021, 9(10), 1274; https://doi.org/10.3390/healthcare9101274 - 27 Sep 2021
Viewed by 3069
Abstract
Fraudulent billing of health care insurance programs such as Medicare is in the billions of dollars. The extent of such overpayments remains an issue despite the emerging use of analytical methods for fraud detection. This motivates policy makers to also be interested in [...] Read more.
Fraudulent billing of health care insurance programs such as Medicare is in the billions of dollars. The extent of such overpayments remains an issue despite the emerging use of analytical methods for fraud detection. This motivates policy makers to also be interested in the provider billing characteristics and understand the common factors that drive conservative and/or aggressive behavior. Statistical approaches to tackling this problem are confronted by the asymmetric and/or leptokurtic distributions of billing data. This paper is a first attempt at using a quantile regression framework and a variable selection approach for medical billing analysis. The proposed method addresses the varying impacts of (potentially different) variables at the different quantiles of the billing aggressiveness distribution. We use the mammography procedure to showcase our analysis and offer recommendations on fraud detection. Full article
Show Figures

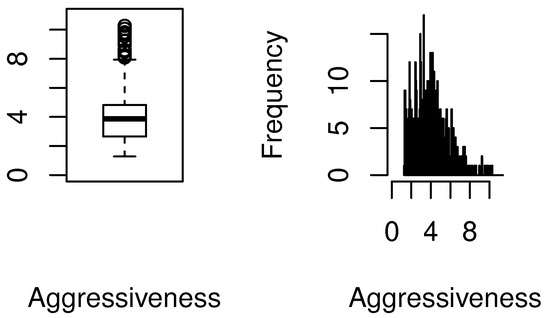
Figure 1

Figure 1
<p>Boxplot and histogram of provider billing aggressiveness for Procedure 77055.</p>
Full article ">Figure 2
<p>Q-Q plot for the OLS regression.</p>
Full article ">Figure 3
<p>OLS and quantile regression estimates for select variables. Notes: <span class="html-italic">x</span>-axis depicts quantiles of the dependent variable; <span class="html-italic">y</span>-axis represents parameter estimates. The solid black line and dashed red lines are the OLS and 95% confidence interval estimates, the dotted black line and gray shaded areas are the quantile functional and 95% confidence band estimates, respectively.</p>
Full article ">
14 pages, 865 KiB  
Article
Evaluation of the Efficiency of European Health Systems Using Fuzzy Data Envelopment Analysis
by Juan Cándido Gómez-Gallego, María Gómez-Gallego, Javier Fernando García-García and Ursula Faura-Martinez
Healthcare 2021, 9(10), 1270; https://doi.org/10.3390/healthcare9101270 - 26 Sep 2021
Cited by 11 | Viewed by 2508
Abstract
Many studies that assess efficiency in health systems are based on output mean values. That approach ignores the representativeness of the average statistic, which can become a serious problem in estimation. To solve this question, this research contributes in three different ways: the [...] Read more.
Many studies that assess efficiency in health systems are based on output mean values. That approach ignores the representativeness of the average statistic, which can become a serious problem in estimation. To solve this question, this research contributes in three different ways: the first aim is to evaluate the technical efficiency in the management of European health systems considering a set of DEA (Data Envelopment Analysis) and FDEA (Fuzzy Data Envelopment Analysis) models. A second goal is to assess the bias in the estimation of efficiency when applying the conventional DEA. The third objective is the evaluation of the statistical relationship between the bias in the efficiency estimation and the macroeconomic variables (income inequality and economic freedom). The main results show positive correlations between DEA and FDEA scores. Notwithstanding traditional DEA models overestimate efficiency scores. Furthermore, the size of the bias is positively related to income inequality and negative with economic freedom in the countries evaluated. Full article
Show Figures

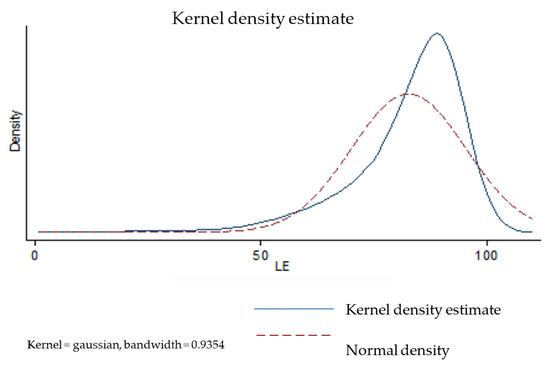
Figure 1

Figure 1
<p>Kernel density estimate for Spain.</p>
Full article ">
10 pages, 2478 KiB  
Article
Prevalence and Risk Factors of Self-Reported Perfume Sensitivity in Saudi Arabia
by Meshael Alrasheed, Omar Albalawi, Mohammed Aljallal and Amani S. Alqahtani
Healthcare 2021, 9(10), 1248; https://doi.org/10.3390/healthcare9101248 - 22 Sep 2021
Cited by 1 | Viewed by 3595
Abstract
Perfumes are widely used products; however, several fragrance substances used in perfuming are well-established allergenic substances and have been attributed to various adverse health reactions. The nature and significance of perfume sensitivity reactions have not been thoroughly investigated. Therefore, this study aimed to [...] Read more.
Perfumes are widely used products; however, several fragrance substances used in perfuming are well-established allergenic substances and have been attributed to various adverse health reactions. The nature and significance of perfume sensitivity reactions have not been thoroughly investigated. Therefore, this study aimed to identify the prevalence, nature, and associated risk factors of self-reported perfume sensitivity among the general population in Saudi Arabia. A nationally representative cross-sectional study was conducted among adults in Saudi Arabia in October 2020. Significant associated risk factors were explored using multivariate regression analyses. A total of 1078 participants completed the survey, with a mean age of 36.7 years (SD ± 10.36). Perfume sensitivity reactions were reported in 14.6% of participants. From among these participants, 17.8% reported moderate to severe reactions. Respiratory and skin symptoms were the most reported reactions, with total rates of 40.1% and 35.7%, respectively. History of asthma (OR = 3.2, 95%CI 1.88–4.37, p < 0.001) and the use of counterfeit perfume products (OR = 1.9, 95%CI 1.23–2.94, p < 0.003) were significantly associated with a higher risk of perfume sensitivity. Our study revealed that a considerable number of the general population in Saudi Arabia has experienced adverse health reactions due to perfume products. The enormous volume of the perfume market thus necessitates further quantitative analysis studies to determine the presence of allergenic fragrance substances in perfumes. Full article
Show Figures

Figure 1

Figure 1
<p>Perfume-buying sources among study participants (<span class="html-italic">n</span> = 1078).</p>
Full article ">Figure 2
<p>Perceptions of causes of the reported sensitivity (<span class="html-italic">n</span> = 157).</p>
Full article ">
24 pages, 8915 KiB  
Article
Analysis of Reproduction Number R0 of COVID-19 Using Current Health Expenditure as Gross Domestic Product Percentage (CHE/GDP) across Countries
by Kayode Oshinubi, Mustapha Rachdi and Jacques Demongeot
Healthcare 2021, 9(10), 1247; https://doi.org/10.3390/healthcare9101247 - 22 Sep 2021
Cited by 19 | Viewed by 2946
Abstract
(1) Background: Impact and severity of coronavirus pandemic on health infrastructure vary across countries. We examine the role percentage health expenditure plays in various countries in terms of their preparedness and see how countries improved their public health policy in the first and [...] Read more.
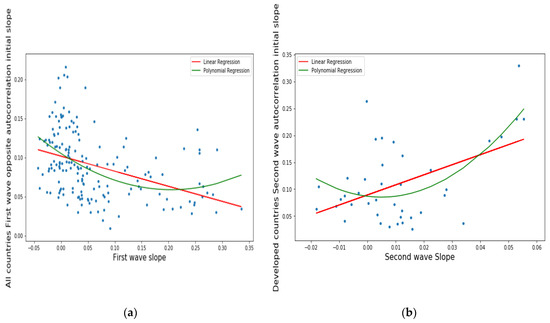
(1) Background: Impact and severity of coronavirus pandemic on health infrastructure vary across countries. We examine the role percentage health expenditure plays in various countries in terms of their preparedness and see how countries improved their public health policy in the first and second wave of the coronavirus pandemic; (2) Methods: We considered the infectious period during the first and second wave of 195 countries with their current health expenditure as gross domestic product percentage (CHE/GDP). An exponential model was used to calculate the slope of the regression line while the ARIMA model was used to calculate the initial autocorrelation slope and also to forecast new cases for both waves. The relationship between epidemiologic and CHE/GDP data was used for processing ordinary least square multivariate modeling and classifying countries into different groups using PC analysis, K-means and hierarchical clustering; (3) Results: Results show that some countries with high CHE/GDP improved their public health strategy against virus during the second wave of the pandemic; (4) Conclusions: Results revealed that countries who spend more on health infrastructure improved in the tackling of the pandemic in the second wave as they were worst hit in the first wave. This research will help countries to decide on how to increase their CHE/GDP in order to properly tackle other pandemic waves of the present COVID-19 outbreak and future diseases that may occur. We are also opening up a debate on the crucial role socio-economic determinants play during the exponential phase of the pandemic modelling. Full article
Show Figures

Figure 1

Figure 1
<p>Linear (in red) and parabolic or cubic (in green) regression plots of the opposite of the initial autocorrelation slope vs. (<b>a</b>) first wave exponential regression slope for all countries, (<b>b</b>) second wave exponential regression slope for developed countries and (<b>c</b>) days from the start of the first wave observed in China for all countries. (<b>a</b>): LinregressResult slope = −0.193, intercept = 0.102, <span class="html-italic">r</span> value = −0.394, <span class="html-italic">p</span> value = 1.026 × 10<sup>−7</sup>, stderr = 0.03467, <span class="html-italic">p</span> value = 0.00145, stderr = 0.54339, R-squared for order two polynomial regression = 0.19, RMSE for linear regression = 0.0385, RMSE for polynomial regression = 0.046, (<b>b</b>): LinregressResult slope = 1.867, intercept = 0.089, <span class="html-italic">r</span> value = 0.487, R-squared for order two polynomial regression = 0.37, RMSE for linear regression = 0.063, RMSE for polynomial regression = 0.094, (<b>c</b>): LinregressResult slope = 0.000295, intercept = 0.0765, <span class="html-italic">r</span> value = 0.195469, <span class="html-italic">p</span> value = 0.01415, stderr = 0.000119, R-squared linear regression = 0.038, R-squared for order three polynomial pegression = 0.1, RMSE for linear regression = 0.04, RMSE for polynomial regression = 0.0414825.</p>
Full article ">Figure 1 Cont.
<p>Linear (in red) and parabolic or cubic (in green) regression plots of the opposite of the initial autocorrelation slope vs. (<b>a</b>) first wave exponential regression slope for all countries, (<b>b</b>) second wave exponential regression slope for developed countries and (<b>c</b>) days from the start of the first wave observed in China for all countries. (<b>a</b>): LinregressResult slope = −0.193, intercept = 0.102, <span class="html-italic">r</span> value = −0.394, <span class="html-italic">p</span> value = 1.026 × 10<sup>−7</sup>, stderr = 0.03467, <span class="html-italic">p</span> value = 0.00145, stderr = 0.54339, R-squared for order two polynomial regression = 0.19, RMSE for linear regression = 0.0385, RMSE for polynomial regression = 0.046, (<b>b</b>): LinregressResult slope = 1.867, intercept = 0.089, <span class="html-italic">r</span> value = 0.487, R-squared for order two polynomial regression = 0.37, RMSE for linear regression = 0.063, RMSE for polynomial regression = 0.094, (<b>c</b>): LinregressResult slope = 0.000295, intercept = 0.0765, <span class="html-italic">r</span> value = 0.195469, <span class="html-italic">p</span> value = 0.01415, stderr = 0.000119, R-squared linear regression = 0.038, R-squared for order three polynomial pegression = 0.1, RMSE for linear regression = 0.04, RMSE for polynomial regression = 0.0414825.</p>
Full article ">Figure 2
<p>Linear (in red) and quartic (in green) regression plots of the opposite of the initial autocorrelation slope of the first wave vs first wave maximum R<sub>0</sub> for developed countries. LinregressResult slope = 0.01034, intercept = 0.1019, <span class="html-italic">r</span> value = −0.3578, <span class="html-italic">p</span> value = 0.02163, stderr = 0.00433, RMSE for linear regression = 0.0303, RMSE for polynomial regression = 0.0349, R-squared for order four polynomial regression = 0.33.</p>
Full article ">Figure 3
<p>Linear (in red) and sextic (in green) regression plots of first wave opposite of initial autocorrelation slope vs. CHE/GDP. LinregressResult slope = 0.01117, intercept = 0.0664, <span class="html-italic">r</span> value = 0.47219, <span class="html-italic">p</span> value = 0.0097, stderr = 0.004, RMSE for linear regression = 0.0387, RMSE for polynomial regression = 0.04399, R-squared for order six polynomial regression = 0.4.</p>
Full article ">Figure 4
<p>Regression plot of first wave exponential regression slope vs CHE/GDP for developed and developing countries. LinregressResult slope = 0.026632, intercept = −0.1052912, <span class="html-italic">r</span> value = 0.5661, <span class="html-italic">p</span> value = 7.60 × 10<sup>−5</sup>, stderr = 0.00605655, R-squared = 0.320470, RMSE for linear regression = 0.095836.</p>
Full article ">Figure 5
<p>Regression plots for developed countries of (<b>a</b>) first and (<b>b</b>) second wave exponential regression slope versus CHR/GDP, (<b>c</b>) first and (<b>d</b>) second wave maximum R<sub>0</sub> of the new cases curve. (<b>a</b>): LinregressResult slope = 0.0320468, intercept = −0.16158, <span class="html-italic">r</span> value=0.6481, <span class="html-italic">p</span> value = 4.62 13 × 10<sup>−6</sup>, stderr = 0.00603, R-squared = 0.42, RMSE for linear regression = 0.09359760581, (<b>b</b>): LinregressResult slope = −0.0010489, intercept = 0.01994, <span class="html-italic">r</span> value = 0.1340845, <span class="html-italic">p</span> value = 0.4094462, stderr = 0.001258, R-squared = 0.018, RMSE for linear regression = 0.018583749, (<b>c</b>): LinregressResult slope = 0.03612, intercept = 0.0062, <span class="html-italic">r</span> value = 0.3299, <span class="html-italic">p</span> value = 0.0352, stderr = 0.0165, R-squared = 0.109, RMSE for linear regression = 0.116, (<b>d</b>): LinregressResult slope = 0.05223, intercept = −0.0421, <span class="html-italic">r</span> value = 0.434366, <span class="html-italic">p</span> value = 0.0051, stderr = 0.01757, R-squared = 0.18867, RMSE for linear regression = 0.01689.</p>
Full article ">Figure 5 Cont.
<p>Regression plots for developed countries of (<b>a</b>) first and (<b>b</b>) second wave exponential regression slope versus CHR/GDP, (<b>c</b>) first and (<b>d</b>) second wave maximum R<sub>0</sub> of the new cases curve. (<b>a</b>): LinregressResult slope = 0.0320468, intercept = −0.16158, <span class="html-italic">r</span> value=0.6481, <span class="html-italic">p</span> value = 4.62 13 × 10<sup>−6</sup>, stderr = 0.00603, R-squared = 0.42, RMSE for linear regression = 0.09359760581, (<b>b</b>): LinregressResult slope = −0.0010489, intercept = 0.01994, <span class="html-italic">r</span> value = 0.1340845, <span class="html-italic">p</span> value = 0.4094462, stderr = 0.001258, R-squared = 0.018, RMSE for linear regression = 0.018583749, (<b>c</b>): LinregressResult slope = 0.03612, intercept = 0.0062, <span class="html-italic">r</span> value = 0.3299, <span class="html-italic">p</span> value = 0.0352, stderr = 0.0165, R-squared = 0.109, RMSE for linear regression = 0.116, (<b>d</b>): LinregressResult slope = 0.05223, intercept = −0.0421, <span class="html-italic">r</span> value = 0.434366, <span class="html-italic">p</span> value = 0.0051, stderr = 0.01757, R-squared = 0.18867, RMSE for linear regression = 0.01689.</p>
Full article ">Figure 6
<p>Regression plot of first wave exponential regression slope vs CHE/GDP for all countries. LinregressResult slope = 0.01214439, intercept = −0.0159087, <span class="html-italic">r</span> value = 0.3655, <span class="html-italic">p</span> value = 2.71 × 10<sup>−6</sup>, stderr = 0.00249223, R-squared = 0.13359, RMSE for linear regression = 0.0819603345.</p>
Full article ">Figure 7
<p>(<b>a</b>) First wave moving average and standard deviation of new cases (left) and (<b>b</b>) autocorrelation curve for Mali (right). (<b>c</b>) First wave moving average and standard deviation of new cases (left) and (<b>d</b>) autocorrelation curve for Luxembourg (right).</p>
Full article ">Figure 8
<p>(<b>a</b>) Second wave moving average and standard deviation of new cases (left) and (<b>b</b>) autocorrelation curve for Mali (right). (<b>c</b>) Second wave moving average and standard deviation of new cases (left) and (<b>d</b>) autocorrelation curve for Slovenia (right).</p>
Full article ">Figure 9
<p>(<b>a</b>) First and (<b>b</b>) second wave forecast for Mali. (<b>c</b>) First wave forecast for Luxembourg. (<b>d</b>) Second wave forecast for Slovenia.</p>
Full article ">Figure 10
<p>(<b>a</b>) Boxplots of the clusters corresponding to the hierarchical clustering. Visualizations of (<b>b</b>) more “developing” (in red with some notable exceptions such as the Czech Republic and Germany) and (<b>c</b>) more “developed” (in green and partially in orange) countries parts of the hierarchy tree.</p>
Full article ">Figure 10 Cont.
<p>(<b>a</b>) Boxplots of the clusters corresponding to the hierarchical clustering. Visualizations of (<b>b</b>) more “developing” (in red with some notable exceptions such as the Czech Republic and Germany) and (<b>c</b>) more “developed” (in green and partially in orange) countries parts of the hierarchy tree.</p>
Full article ">Figure 11
<p>(<b>a</b>) Principal components (PC) plot from the principal component analysis (PCA) on the initial variables: 1st and 2nd waves maximum R<sub>0</sub>, first wave R<sub>0</sub> and second wave R<sub>0</sub>, deterministic R<sub>0</sub>, 1st wR<sub>0</sub><sup>det</sup> and 2nd wR<sub>0</sub><sup>det</sup>, 1st wave Arima slope, 2nd wave Arima slope, and CHE/GDP. (<b>b</b>) Projection of the points corresponding to 204 countries of the PCA’s plot on the first PC plane with more developed countries in green and more developing in orange. (<b>c</b>) Explained variance plot. (<b>d</b>,<b>e</b>) Correlation circles for the two first PC planes.</p>
Full article ">Figure 11 Cont.
<p>(<b>a</b>) Principal components (PC) plot from the principal component analysis (PCA) on the initial variables: 1st and 2nd waves maximum R<sub>0</sub>, first wave R<sub>0</sub> and second wave R<sub>0</sub>, deterministic R<sub>0</sub>, 1st wR<sub>0</sub><sup>det</sup> and 2nd wR<sub>0</sub><sup>det</sup>, 1st wave Arima slope, 2nd wave Arima slope, and CHE/GDP. (<b>b</b>) Projection of the points corresponding to 204 countries of the PCA’s plot on the first PC plane with more developed countries in green and more developing in orange. (<b>c</b>) Explained variance plot. (<b>d</b>,<b>e</b>) Correlation circles for the two first PC planes.</p>
Full article ">Figure 12
<p>Parallel coordinates for cluster centroids.</p>
Full article ">Figure 13
<p>(<b>a</b>) Leverage vs normalized squared residuals plot. (<b>b</b>) Residuals regression plots for initial variables.</p>
Full article ">
10 pages, 845 KiB  
Article
Is Time-Driven Activity-Based Costing Coming out on Top? A Comparison with Activity-Based Costing in the Health Field
by Angels Niñerola, Ana-Beatriz Hernández-Lara and Maria-Victoria Sánchez-Rebull
Healthcare 2021, 9(9), 1113; https://doi.org/10.3390/healthcare9091113 - 27 Aug 2021
Cited by 3 | Viewed by 3312
Abstract
The cost of health is a recurrent topic that has generated much research, as it affects all of society. Both public and private agents need to know the real cost of treatments, services, and products for decision-making. This article aims to compare the [...] Read more.
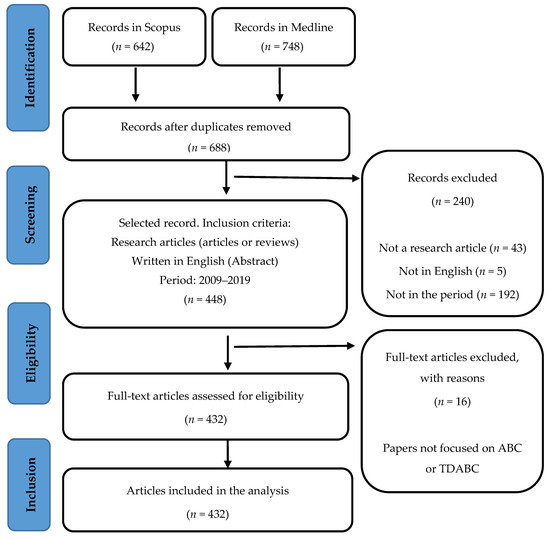
The cost of health is a recurrent topic that has generated much research, as it affects all of society. Both public and private agents need to know the real cost of treatments, services, and products for decision-making. This article aims to compare the use and research impact of two cost systems widely used in health: ABC and TDABC, which is an evolution of ABC. For doing so, a bibliometric review in Scopus and Medline was carried out encompassing the years 2009–2019. The results show a great increase in publications using TDABC, while publications on ABC stabilized. On the other hand, the TDABC articles presented higher research impacts in traditional and alternative metrics. Articles on TDABC are more frequently cited, published in better journals, and more visible in academic social networks. The findings suggest that scholars and practitioners should focus on TDABC rather than ABC for addressing cost in health for its simplicity, projection, and research opportunities. Full article
Show Figures

Figure 1

Figure 1
<p>PRISMA flow adapted from Moher 2009 (search conducted on 18 September 2020).</p>
Full article ">Figure 2
<p>ABC and TDABC publication trends in health literature.</p>
Full article ">
20 pages, 6083 KiB  
Article
A Bayes Decision Rule to Assist Policymakers during a Pandemic
by Kang-Hua Cao, Paul Damien, Chi-Keung Woo and Jay Zarnikau
Healthcare 2021, 9(8), 1023; https://doi.org/10.3390/healthcare9081023 - 9 Aug 2021
Cited by 1 | Viewed by 2474
Abstract
A new decision rule based on net benefit per capita is proposed and exemplified with the aim of assisting policymakers in deciding whether to lockdown or reopen an economy—fully or partially—amidst a pandemic. Bayesian econometric models using Markov chain Monte Carlo algorithms are [...] Read more.
A new decision rule based on net benefit per capita is proposed and exemplified with the aim of assisting policymakers in deciding whether to lockdown or reopen an economy—fully or partially—amidst a pandemic. Bayesian econometric models using Markov chain Monte Carlo algorithms are used to quantify this rule, which is illustrated via several sensitivity analyses. While we use COVID-19 data from the United States to demonstrate the ideas, our approach is invariant to the choice of pandemic and/or country. The actions suggested by our decision rule are consistent with the closing and reopening of the economies made by policymakers in Florida, Texas, and New York; these states were selected to exemplify the methodology since they capture the broad spectrum of COVID-19 outcomes in the U.S. Full article
Show Figures

Figure 1

Figure 1
<p>Weekly employment rates (2006–2020) and daily COVID-19 death rates (2020) by states.</p>
Full article ">Figure 2
<p>ACF plots for the employment and death rate series by state.</p>
Full article ">Figure 3
<p>Predictive distributions of Florida unadjusted personal income in dollars.</p>
Full article ">Figure 4
<p>Predictive distributions of Florida adjusted personal income in dollars.</p>
Full article ">Figure 5
<p>Predictive distributions of medical and fatality costs in dollars.</p>
Full article ">Figure 6
<p>Predictive distributions of Florida ΔNB in dollars.</p>
Full article ">Figure 7
<p>(<b>a</b>) Panel A—<span class="html-italic">P</span>(ΔNB &gt; 0) with Unadjusted Income Values. (<b>b</b>) Panel B—<span class="html-italic">P</span>(ΔNB &gt; 0) with Adjusted Income Values.</p>
Full article ">Figure 7 Cont.
<p>(<b>a</b>) Panel A—<span class="html-italic">P</span>(ΔNB &gt; 0) with Unadjusted Income Values. (<b>b</b>) Panel B—<span class="html-italic">P</span>(ΔNB &gt; 0) with Adjusted Income Values.</p>
Full article ">Figure 8
<p>New York City COVID-19 deaths by age as of 12 May 2020. Note: Underlying conditions include diabetes, lung disease, cancer, immunodeficiency, heart disease, hypertension, asthma, kidney disease, GI/liver disease, and obesity.</p>
Full article ">
20 pages, 1164 KiB  
Article
Why Are Turkish University Students Addicted to the Internet? A Moderated Mediation Model
by Orhan Koçak, İlayda Yılmaz and Mustafa Z. Younis
Healthcare 2021, 9(8), 953; https://doi.org/10.3390/healthcare9080953 - 29 Jul 2021
Cited by 3 | Viewed by 4995
Abstract
Internet addiction has become a significant problem that primarily affects young people. It has an essential effect on the individual’s self-perception and assessment of their competencies. This study aimed to reveal whether there is a significant relationship between the level of internet addiction [...] Read more.
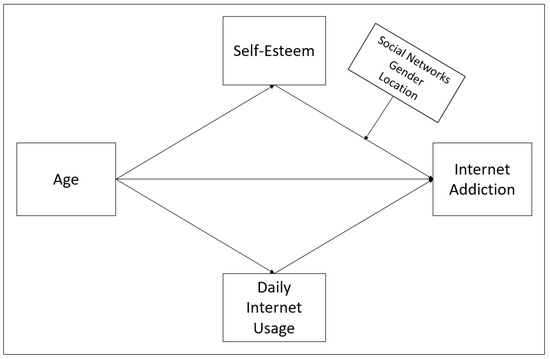
Internet addiction has become a significant problem that primarily affects young people. It has an essential effect on the individual’s self-perception and assessment of their competencies. This study aimed to reveal whether there is a significant relationship between the level of internet addiction of university students and their age and self-esteem. For this purpose, internet addiction and self-esteem scales were used in addition to questions such as age, gender, the purpose of internet use, and internet daily usage time. We used a quantitative research method to obtain cross-sectional data from 400 Turkish young people using online surveys. Correlation, regression, mediation, and moderation analyses were performed using SPSS and the PROCESS macro plugin for data analysis. Internet addiction was significantly associated with self-esteem, gender, age, and daily internet usage. In addition, we discovered that self-esteem and daily usage time played a mediation role in the effect of the age variable on internet addiction. Moreover, the moderation roles of social networks, gender, and location in the impact of self-esteem on internet addiction were determined. With this study, we understood that as age increases, self-esteem triggers the decrease of internet addiction. In this sense, policies should be developed to increase self-esteem among young people to ensure the conscious use of the internet. Full article
Show Figures

Figure 1

Figure 1
<p>Conceptual model of research.</p>
Full article ">Figure 2
<p>Interaction effect of self-esteem and gender on internet addiction.</p>
Full article ">Figure 3
<p>Interaction effect of self-esteem and location on internet addiction.</p>
Full article ">Figure 4
<p>Interaction effect of self-esteem and social networks on internet addiction.</p>
Full article ">Figure 5
<p>Results of the proposed research model, * <span class="html-italic">p</span> &lt; 0.05, *** <span class="html-italic">p</span> &lt; 0.001.</p>
Full article ">
10 pages, 554 KiB  
Article
The Economic Burden Associated with the Management of Different Stages of Breast Cancer: A Retrospective Cost of Illness Analysis in Saudi Arabia
by Ahmed Alghamdi, Bander Balkhi, Shahad Alqahtani and Hamoud Almotairi
Healthcare 2021, 9(7), 907; https://doi.org/10.3390/healthcare9070907 - 18 Jul 2021
Cited by 17 | Viewed by 5762
Abstract
Globally, breast cancer management is associated with a heavy economic burden, but its impact in Saudi Arabia has not been fully quantified. The aim of this study was to estimate the economic burden of breast cancer management at various disease stages, in Saudi [...] Read more.
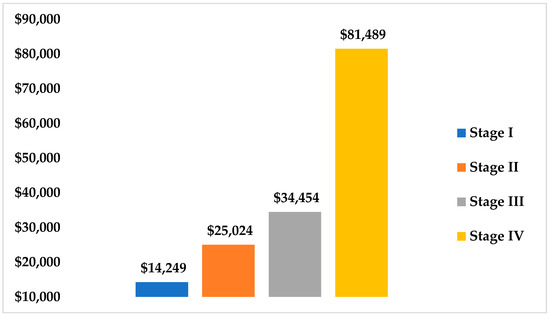
Globally, breast cancer management is associated with a heavy economic burden, but its impact in Saudi Arabia has not been fully quantified. The aim of this study was to estimate the economic burden of breast cancer management at various disease stages, in Saudi Arabia, from a payer perspective. We conducted a retrospective, multicenter cost of illness study in two governmental healthcare centers from January to December 2018, using the data of 300 patients at different breast cancer stages. A micro-costing, bottom-up method was used, and descriptive and inferential statistics were analyzed. The total estimated cost for treating breast cancer during the study period was $13.345 million USD, with the average cost per patient ranging from $14,249 USD in stage I to $81,489 USD in stage IV (p < 0.001). Medication cost was the main driver of total healthcare spending, followed by hospitalization and diagnostic tests. The cost of targeted therapy drugs represented 67% of the total medication costs, mostly driven by trastuzumab-based regimens. The economic burden of breast cancer management in Saudi Arabia is substantial and increases significantly with disease advancement. Early detection screening programs, evaluating the value of highly expensive interventions, and considering biosimilars, may contribute toward cost savings. Full article
Show Figures

Figure 1

Figure 1
<p>Estimated annual cost of breast cancer management (in USD), per disease stage.</p>
Full article ">Figure 2
<p>Major drivers of direct medical costs in breast cancer management.</p>
Full article ">Figure 3
<p>The estimated annual cost for drug categories used in breast cancer treatment (in USD).</p>
Full article ">
19 pages, 1774 KiB  
Article
Understanding the Evolution of Government Attention in Response to COVID-19 in China: A Topic Modeling Approach
by Quan Cheng, Jianhua Kang and Minwang Lin
Healthcare 2021, 9(7), 898; https://doi.org/10.3390/healthcare9070898 - 15 Jul 2021
Cited by 15 | Viewed by 3742
Abstract
The effective control over the outbreak of COVID-19 in China showcases a prompt government response, in which, however, the allocation of attention, as an essential parameter, remains obscure. This study is designed to clarify the evolution of the Chinese government’s attention in tackling [...] Read more.
The effective control over the outbreak of COVID-19 in China showcases a prompt government response, in which, however, the allocation of attention, as an essential parameter, remains obscure. This study is designed to clarify the evolution of the Chinese government’s attention in tackling the pandemic. To this end, 674 policy documents issued by the State Council of China are collected to establish a text corpus, which is then used to extract policy topics by applying the latent dirichlet allocation (LDA) model, a topic modelling approach. It is found that the response policies take different tracks in a four-stage controlling process, and five policy topics are identified as major government attention areas in all stages. Moreover, a topic evolution path is highlighted to show internal relationships between different policy topics. These findings shed light on the Chinese government’s dynamic response to the pandemic and indicate the strength of applying adaptive governance strategies in coping with public health emergencies. Full article
Show Figures

Figure 1

Figure 1
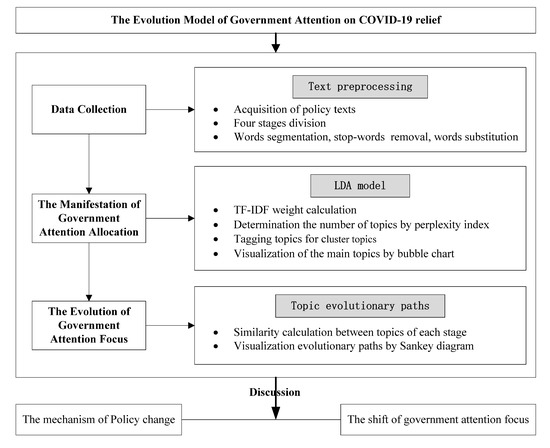
<p>Evolution model of government attention on COVID-19 relief.</p>
Full article ">Figure 2
<p>Four stages of managing the COVID-19 pandemic in China.</p>
Full article ">Figure 3
<p>LDA topic model.</p>
Full article ">Figure 4
<p>Topic intensity in Stage 1.</p>
Full article ">Figure 5
<p>Topic intensity in Stage 2.</p>
Full article ">Figure 6
<p>Topic intensity in Stage 3.</p>
Full article ">Figure 7
<p>Topic Intensity in Stage 4.</p>
Full article ">Figure 8
<p>The topic evolution path of managing COVID-19 in China.</p>
Full article ">
14 pages, 2140 KiB  
Article
Analysis of Factors Relevant to Revenue Enhancement in Hernia Interventions (SwissDRG G09)
by Bassey Enodien, Stephanie Taha-Mehlitz, Marta Bachmann, Victor E. Staartjes, Maike Gripp, Tobias Staudner, Anas Taha and Daniel Frey
Healthcare 2021, 9(7), 862; https://doi.org/10.3390/healthcare9070862 - 8 Jul 2021
Cited by 4 | Viewed by 2133
Abstract
Background: Since diagnosis-related groups (SwissDRG) were established in Switzerland in 2012, small and medium-size hospitals have encountered increasing financial troubles. Even though hernia repair operations are frequent, most hospitals fail to cover their costs with these procedures. Previous studies have focused mainly on [...] Read more.
Background: Since diagnosis-related groups (SwissDRG) were established in Switzerland in 2012, small and medium-size hospitals have encountered increasing financial troubles. Even though hernia repair operations are frequent, most hospitals fail to cover their costs with these procedures. Previous studies have focused mainly on analyzing costs and the contributing factors but less on variables that can be positively influenced. Therefore, this study aims to identify the relevant and influenceable factors for revenue growth in hernia repair surgery. Methods: Data from all patients who underwent the SwissDRG G09 surgery for a hernia in 2019 were analyzed. The contribution margin (CM4), as well as any over- or under-coverage, was correlated to case-specific costs. Results: A total of 168 patients received hernia repair surgery with the SwissDRG code G09. The average revenue/loss generated by one procedure was CHF −623.84. Procedures covered by the General Health Insurance (OKP) generated a loss of CHF −830.70 on average, whereas procedures covered by private insurance companies (VVG) generated revenue of CHF +1100 on average. Significant factors impacting the profitability of hernia repair operations were teaching during surgery (p < 0.005), the surgical operating time (p < 0.001), the total anesthesia time (p < 0.001), the number of surgeons present (p = 0.022), the insurance state of patients (p < 0.001), and the type of surgery (p < 0.01 for Lichtenstein’s procedure). Conclusions: This study reveals that hernia repair surgery performed under cost coverage by OKP is generally unprofitable. Our results further imply that the most important and influenceable factors for revenue enhancement are the quality and process optimization of the surgical department. To compensate for this deficit, hospitals should aim to increase the percentage of patients with private health insurance coverage in their procedures. Since outpatient surgery does not provide a valid alternative due to the low reimbursement by insurance companies, the cost efficiency of inpatient hernia repair needs to be increased by process optimization of the surgical department; for instance, by providing specialized hernia teams performing with shorter operation times and high quality. Full article
Show Figures

Figure 1

Figure 1
<p>The binary break-even point for surgical time was 73.5 min determined with the Area under the Curve (AUC) and the “closest-to-(0, 1)-criterion”.</p>
Full article ">Figure 2
<p>The binary break-even point for anesthesia and emergence time was 74.5 min determined with Area under the Curve (AUC) and the “closest-to-(0, 1)-criterion”.</p>
Full article ">Figure 3
<p>The binary break-even point for total surgical time and anesthesia time was 145.5 min determined with Area under the Curve (AUC) and the “closest-to-(0, 1)-criterion”.</p>
Full article ">Figure 4
<p>Surgical time was correlated to the contribution margin for each procedure in scatter plots. Sideplots show the distribution of contribution margins and surgical times in a histogram. Strength of correlation was calculated using the Pearson correlation coefficient (<span class="html-italic">r</span> = −0.49) and indicated in the figure.</p>
Full article ">Figure 5
<p>Total surgery and anesthesia time was correlated to the contribution margin for each procedure in scatter plots (A). Sideplots (A) show the distribution of contribution margins and total surgical and anesthesia times in a histogram (A). Strength of correlation was calculated using the Pearson correlation coefficient (<span class="html-italic">r</span> = −0.51) and indicated in the figure.</p>
Full article ">Figure 6
<p>Anesthesia time was correlated to the contribution margin for each procedure in scatter plots (A). Sideplots (A) show the distribution of contribution margins and anesthesia times in a histogram (A). Strength of correlation was calculated using the Pearson correlation coefficient (<span class="html-italic">r</span> = −0.13) and indicated in the figure.</p>
Full article ">
17 pages, 635 KiB  
Article
Tobacco Use and Risk Factors for Hypertensive Individuals in Kenya
by Silvia Nanjala Walekhwa and Adnan Kisa
Healthcare 2021, 9(5), 591; https://doi.org/10.3390/healthcare9050591 - 17 May 2021
Cited by 4 | Viewed by 5044
Abstract
This study aimed to examine the association between hypertension and tobacco use as well as other known hypertensive risk factors (BMI, waist–hip ratio, alcohol consumption, physical activity, and socio-economic factors among adults) in Kenya. The study utilized the 2015 Kenya STEPs survey (adults [...] Read more.
This study aimed to examine the association between hypertension and tobacco use as well as other known hypertensive risk factors (BMI, waist–hip ratio, alcohol consumption, physical activity, and socio-economic factors among adults) in Kenya. The study utilized the 2015 Kenya STEPs survey (adults aged 18–69) and investigated the association between tobacco use and hypertension. Descriptive statistics, correlation, frequencies, and regression (linear and logistic) analyses were used to execute the statistical analysis. The study results indicate a high prevalence of hypertension in association with certain risk factors—body mass index (BMI), alcohol, waist–hip ratio (WHR), and tobacco use—that were higher in males than females among the hypertensive group. Moreover, the findings noted an exceptionally low awareness level of hypertension in the general population. BMI, age, WHR, and alcohol use were prevalent risks of all three outcomes: hypertension, systolic blood pressure, and diastolic blood pressure. Healthcare authorities and policymakers can employ these findings to lower the burden of hypertension by developing health promotion and intervention policies. Full article
Show Figures

Figure 1

Figure 1
<p>Systolic and diastolic distribution in both and by genders box plot.</p>
Full article ">
10 pages, 596 KiB  
Article
Predicting a Need for Financial Assistance in Emergency Department Care
by Samuel Davis, Sara Nourazari, Rachel Granovsky and Nasser Fard
Healthcare 2021, 9(5), 556; https://doi.org/10.3390/healthcare9050556 - 10 May 2021
Cited by 4 | Viewed by 2082
Abstract
Identifying patients with a low likelihood of paying their bill serves the needs of patients and providers alike: aligning government programs with their target beneficiaries while minimizing patient frustration and reducing waste among emergency physicians by streamlining the billing process. The goal of [...] Read more.
Identifying patients with a low likelihood of paying their bill serves the needs of patients and providers alike: aligning government programs with their target beneficiaries while minimizing patient frustration and reducing waste among emergency physicians by streamlining the billing process. The goal of this study was to predict the likelihood of patients paying the balance of their emergency department visit bill within 90 days of receipt. Three machine learning methodologies were applied to predict payment: logistic regression, decision tree, and random forest. Models were trained and performance was measured using 1,055,941 patients with non-zero balances across 27 EDs from 1 August 2015 to 31 July 2017. The decision tree accurately predicted 87% of unsuccessful payments, providing significant opportunities to identify patients in need of financial assistance. Full article
Show Figures

Figure 1

Figure 1
<p>Confusion Matrix. Correct predictions are either TP or TN, while incorrect predictions are either FP or FN. Sensitivity is the ratio of TP to all P, which represents the strength of the model at identifying positive results. The specificity is the ratio of TN to all N, which represents the strength of the model at identifying negative results. The PPV represents the likelihood of a positive prediction being correct, while NPV represents the likelihood of a negative prediction being correct.</p>
Full article ">Figure 2
<p>Abridged DT results; the complete tree has 131 nodes, of which 66 are terminal.</p>
Full article ">
27 pages, 1573 KiB  
Article
And When I Die: Theory of Planned Behavior as Applied to Sperm Cryopreservation
by Limor Dina Gonen
Healthcare 2021, 9(5), 554; https://doi.org/10.3390/healthcare9050554 - 9 May 2021
Cited by 6 | Viewed by 2740
Abstract
The present study investigates fertility intentions of men, aged 18–59, as expressed in willingness to cryopreserve sperm for future use in procreation. An economic stated-preference framework is combined with the Theory of Planned Behavior (TPB) to investigate which attributes are important in the [...] Read more.
The present study investigates fertility intentions of men, aged 18–59, as expressed in willingness to cryopreserve sperm for future use in procreation. An economic stated-preference framework is combined with the Theory of Planned Behavior (TPB) to investigate which attributes are important in the decision to cryopreserve sperm, what is the Willingness to Pay (WTP) for cryopreservation, and which attributes influence it. A structured, two-part questionnaire was used, based on WTP and Conjoint analysis (CA) applied in tandem to elicit respondents’ preferences in evaluating utility. Findings show which attributes are important in the decision to cryopreserve sperm among them Risk of Infertility, Personal monthly income, Chance of pregnancy from frozen semen, Age and what are significant predictor variables for the WTP which are Personal monthly income, Importance of the risk of infertility, Initial registration fee to sperm bank and cryopreservation, and Degree of religious observance. The findings further demonstrate that respondents value sperm cryopreservation and have a positive WTP for it as it seems to contribute to improving well-being. As a result of these findings, governments should consider state funding for cryopreservation as part of national health policy. Full article
Show Figures

Figure A1

Figure A1
<p>Component plot in rotated space, based on PCA and factor loadings.</p>
Full article ">Figure A2
<p>The methodology according to the objective which are pursued and the methodology used.</p>
Full article ">Figure A3
<p>The list of the statistical analysis conducted.</p>
Full article ">
20 pages, 312 KiB  
Article
Out-of-Pocket Health Expenditure and Poverty: Evidence from a Dynamic Panel Threshold Analysis
by Abdalla Sirag and Norashidah Mohamed Nor
Healthcare 2021, 9(5), 536; https://doi.org/10.3390/healthcare9050536 - 3 May 2021
Cited by 38 | Viewed by 6745
Abstract
The current study investigated the association between out-of-pocket health expenditure and poverty using macroeconomic data from a sample of 145 countries from 2000 to 2017. In particular, it was examined whether the relationship between out-of-pocket health expenditure and poverty was contingent on a [...] Read more.
The current study investigated the association between out-of-pocket health expenditure and poverty using macroeconomic data from a sample of 145 countries from 2000 to 2017. In particular, it was examined whether the relationship between out-of-pocket health expenditure and poverty was contingent on a certain threshold level of out-of-pocket health spending. The dynamic panel threshold method, which allows for the endogeneity of the threshold regressor (out-of-pocket health expenditure), was used. Three indicators were adopted as poverty measures, namely the poverty headcount ratio, the poverty gap index, and the poverty gap squared index. At the same time, out-of-pocket health expenditure was measured as a percentage of total health expenditure. The results showed the validity of the estimated threshold models, indicating that only beyond the turning point, which was about 29 percent, that out-of-pocket health spending led to increased poverty. When heterogeneity was controlled for in the sample, using the World Bank income classification, the findings showed variations in the estimated threshold, with higher values for the low- and lower-middle-income groups, as compared to the high-income group. For the lower-income groups, below the threshold for out-of-pocket health expenditure, it had a positive or insignificant effect on poverty reduction, while it led to higher poverty above the threshold. Further, the sampled countries were divided into regions, according to the World Health Organization. Generally, improving health care systems through tolerable levels of out-of-pocket health expenditure is an inevitable step toward better health coverage and poverty reduction in many developing countries. Full article
9 pages, 244 KiB  
Article
Refugees’ Opinions about Healthcare Services: A Case of Turkey
by Dilaver Tengilimoğlu, Aysu Zekioğlu, Fatih Budak, Hüseyin Eriş and Mustafa Younis
Healthcare 2021, 9(5), 490; https://doi.org/10.3390/healthcare9050490 - 21 Apr 2021
Cited by 5 | Viewed by 2749
Abstract
Background: Migration is one of the most important social events in human history. In recent years, Turkey hosted a high number of asylum seekers and refugees, primarily because of continuing wars and radical social changes in the Middle East. Methods: Using a random [...] Read more.
Background: Migration is one of the most important social events in human history. In recent years, Turkey hosted a high number of asylum seekers and refugees, primarily because of continuing wars and radical social changes in the Middle East. Methods: Using a random sampling method, Syrian refugees aged 18 and over, who can communicate in Turkish, were reached via personal contact and a total of 714 refugees participated in the study voluntarily. Results: Turkey has mounted with some success and to point out that even though participating refugees in both provinces are young and healthy, almost 50% have bad or worse health status, 61% have chronic diseases, and 55% need regular medication. Participating refugees living in Şanlıurfa stated that ‘Hospitals are very clean and tidy.’ (3.80 ± 0.80). The answers given to the following statements had the highest mean for the participating refugees living in Kilis; ‘Hospitals are clean and tidy.’ (3.22 ± 1.25). Conclusion: Due to financial and human resource deficiencies, there are problems in providing preventive and therapeutic health services, especially to refugees living outside the refugee camps in bad conditions. It is important that refugees are encouraged to apply to family health and community health centers in this context. Full article
10 pages, 241 KiB  
Article
The Effect of Changes in Employment on Health of Work-Related Injured Workers: A Longitudinal Perspectives
by Han-Kyoul Kim, Kyu-Min Kim, Jae-Hak Kim and Hyun-Sill Rhee
Healthcare 2021, 9(4), 470; https://doi.org/10.3390/healthcare9040470 - 15 Apr 2021
Viewed by 2157
Abstract
This longitudinal study attempted to identify changes in employment status and overall health status. The participants were workers who had experienced work-related injuries in the past. In this study, we used the Panel Study of Workers’ Compensation Insurance from 2013 to 2017. This [...] Read more.
This longitudinal study attempted to identify changes in employment status and overall health status. The participants were workers who had experienced work-related injuries in the past. In this study, we used the Panel Study of Workers’ Compensation Insurance from 2013 to 2017. This study utilized propensity score matching for a quasi-experimental design study of the first year to exclude the effects of the confounding variables and exclude the effect of employment status, which is the main independent variable. After applying propensity score matching the research subjects totaled 1070. Changes in employment status were found to have a negative effect on overall health status. This raises new implications for existing industrial accident-related support policies. Thus, it is considered that the scope should be expanded from policies related to re-employment of workers after an industrial accident to improving quality of life through maintaining employment from a long-term perspective. The notable point of this study was to apply the PSM methods. By applying PSM, we clearly identified the effect of changes in employment status on health status. Full article
14 pages, 244 KiB  
Article
Investigation of the Effect of Social Media Addiction on Adults with Depression
by Serdar Aydin, Orhan Koçak, Thomas A. Shaw, Betul Buber, Esra Zeynep Akpinar and Mustafa Z. Younis
Healthcare 2021, 9(4), 450; https://doi.org/10.3390/healthcare9040450 - 11 Apr 2021
Cited by 24 | Viewed by 15416
Abstract
This study aimed to investigate the effects of social media addiction on depression in adult individuals. For this purpose, the researchers analyzed whether social media dependence had differing impacts according to various variables (age, gender, the highest level of education, duration of daily [...] Read more.
This study aimed to investigate the effects of social media addiction on depression in adult individuals. For this purpose, the researchers analyzed whether social media dependence had differing impacts according to various variables (age, gender, the highest level of education, duration of daily use of social media, frequency of social media use, etc.). A sample population of 419 people who live in different provinces in Turkey between 18 and 62 years of age participated in the research. The questionnaire form was developed to obtain the Social Media Dependence Scale (SMDS), Beck Depression Inventory scores, and demographic information from the participants. The research was conducted according to the general screening model. Significant differences were found between depression and social media dependency in variables such as the number of children, age, and income. As a result of the study, when social media addiction was examined in terms of gender among socio-demographic variables, no significant difference was found. Full article
12 pages, 544 KiB  
Article
Economic Evaluation of Emotional and Personal Support in the Health Care of Women with Disabilities
by Manuel Vargas-Vargas, María-Leticia Meseguer-Santamaría and Francisco Sánchez-Alberola
Healthcare 2021, 9(4), 438; https://doi.org/10.3390/healthcare9040438 - 8 Apr 2021
Viewed by 1968
Abstract
It is generally accepted that people with disabilities make greater use of health services. Moreover, certain social circumstances alter the intensity of such use. This manuscript seeks to analyze the existing differences in the use of healthcare among women with and without disabilities, [...] Read more.
It is generally accepted that people with disabilities make greater use of health services. Moreover, certain social circumstances alter the intensity of such use. This manuscript seeks to analyze the existing differences in the use of healthcare among women with and without disabilities, to study the impact of emotional and personal support (EPS) on such use and to assess the reduction of the economic cost that this factor entails. Data from the Spanish National Health Survey (SNHS-2017) and updated unit costs of health services have been used to estimate the differences in use attributable to disability and the economic impact of emotional and personal support. The empirical results show an association between disability and perceived EPS, the latter being less common among Spanish women with disabilities. In addition, within this group, EPS significantly influences the levels of use of health services. Finally, the net effect of a perceived EPS increase would translate into a reduction in the economic costs of health care for women with disabilities. Full article
Show Figures

Figure 1

Figure 1
<p>Average of emotional and personal support (EPS) items for limited and not limited women.</p>
Full article ">
20 pages, 1239 KiB  
Article
Dynamics of Public Spending on Health and Socio-Economic Development in the European Union: An Analysis from the Perspective of the Sustainable Development Goals
by Antonio Rafael Peña-Sánchez, José Ruiz-Chico and Mercedes Jiménez-García
Healthcare 2021, 9(3), 353; https://doi.org/10.3390/healthcare9030353 - 20 Mar 2021
Cited by 5 | Viewed by 3332
Abstract
In recent years, healthcare has become a fundamental pillar of the level of well-being of any society. With the aim of improving the lives of countries and societies, in 2015 the United Nations (UN) approved the 2030 Agenda for Sustainable Development. Among the [...] Read more.
In recent years, healthcare has become a fundamental pillar of the level of well-being of any society. With the aim of improving the lives of countries and societies, in 2015 the United Nations (UN) approved the 2030 Agenda for Sustainable Development. Among the Sustainable Development Goals (SDGs) set out in the Agenda are health and well-being (O3) and the reduction of inequalities (O10). The general objective of this paper is to analyse the impact that the level of socioeconomic development, as well as the evolution of inequalities, have had on public spending on health in European Union countries. The research methodology is based on the application of a regression model and statistical techniques such as sigma convergence, beta convergence and the Gini index. We can see that the levels of public spending on health per capita, the level of socio-economic development and the degree of inequality are closely related in these countries. For this reason, we suggest maintaining sustainable economic growth to reduce the economic disparities between EU countries, and also the current differences in public spending on health per capita. Full article
Show Figures

Figure 1

Figure 1
<p>GDPpc’s Sigma convergence of EU-28 countries. Source: Prepared by authors based on Eurostat.</p>
Full article ">Figure 2
<p>GDPpc’s Beta convergence of EU-28 countries (2010–2019). Source: Prepared by authors based on Eurostat.</p>
Full article ">Figure 3
<p>Evolution of the concentration of disposable income within the EU countries (measured by the Gini Index). Source: Prepared by authors based on Eurostat.</p>
Full article ">Figure 4
<p>Relationship between PSH and the level of economic development of EU-28 countries (2014–2018). Source: Prepared by authors based on Eurostat.</p>
Full article ">Figure 5
<p>Relationship between PSH and the level of economic development adjusted with the Gini Index of EU-28 countries (2014–2018). Source: Prepared by authors based on Eurostat.</p>
Full article ">
15 pages, 1751 KiB  
Article
On the Network Transmission Mechanisms of Disease-Specific Healthcare Expenditure Spillovers: Evidence from the Connectedness Network Analyses
by Wen-Yi Chen
Healthcare 2021, 9(3), 319; https://doi.org/10.3390/healthcare9030319 - 13 Mar 2021
Cited by 3 | Viewed by 1894
Abstract
Previous studies investigating factors influencing healthcare expenditure growth ignored the network transmission mechanisms of disease-specific healthcare expenditure spillovers and regarded the processes culminating in healthcare expenditure growth as a black box. In this study, we investigated factors influencing the network transmission mechanisms underlying [...] Read more.
Previous studies investigating factors influencing healthcare expenditure growth ignored the network transmission mechanisms of disease-specific healthcare expenditure spillovers and regarded the processes culminating in healthcare expenditure growth as a black box. In this study, we investigated factors influencing the network transmission mechanisms underlying the determinants of healthcare expenditure growth through the dynamic connectedness network and the robust least square regression analyses. Our results indicate that demographic transition and business cycles are key factors increasing interconnectedness of different disease-specific healthcare expenditures, and that promotion of primary care utilization would reduce total healthcare expenditure spillovers. In order to reduce diffusion of disease-specific healthcare expenditures, health promotion activities should focus on those clinical diagnosis-related groups of diseases classified as pure net transmitters of spillover, and preventive interventions targeting different diseases should be activated in different phrases of the business cycle. Full article
Show Figures

Figure 1

Figure 1
<p>Static connectedness network structure of net-pairwise directional connectedness indices (<span class="html-italic">NPDCI</span>). (<b>a</b>) Complete Network: total connectedness index (<span class="html-italic">TCI</span>) is 87.20%. The size of nodes indicates the overall magnitude of transmission/reception of spillover for each clinical classification system (CCS) code. Red (green) color for a node denotes a specific CCS<span class="html-italic">i</span> (<span class="html-italic">i</span> = 1, 2,…, 18) that is a net transmitter (receiver). The thickness of arrows reflects the strength of the spillover between a pair of CCS codes. Thicker arrows indicate stronger spillovers between two CCS codes. (<b>b</b>) Net Transmitters: Ten of these eighteen clinical diagnosis-related groups of diseases (these being infectious and parasitic diseases (CCS1), neoplasms (CCS2), endocrine, nutritional, and metabolic diseases and immunity disorders (CCS3), diseases of the blood and blood-forming organs (CCS4), diseases of the circulatory system (CCS7), diseases of the digestive system (CCS9), diseases of the genitourinary system (CCS10) diseases of the musculoskeletal system and connective tissue (CCS13), symptoms, signs, and ill-defined conditions and factors influencing health status (CCS17), and residual codes unclassified diseases (CCS18) are net transmitters of spillover. (<b>c</b>) Net Receivers: The other eight of these eighteen clinical diagnosis-related groups of diseases (these being mental illness (CCS5), diseases of the nervous system and sense organs (CCS6), diseases of the respiratory system (CCS8), complications of pregnancy, childbirth, and the puerperium (CCS11), diseases of the skin and subcutaneous tissue (CCS12), congenital anomalies (CCS14), certain conditions originating in the perinatal period (CCS15), and injury and poisoning (CCS16)) are net receivers of spillover.</p>
Full article ">Figure 1 Cont.
<p>Static connectedness network structure of net-pairwise directional connectedness indices (<span class="html-italic">NPDCI</span>). (<b>a</b>) Complete Network: total connectedness index (<span class="html-italic">TCI</span>) is 87.20%. The size of nodes indicates the overall magnitude of transmission/reception of spillover for each clinical classification system (CCS) code. Red (green) color for a node denotes a specific CCS<span class="html-italic">i</span> (<span class="html-italic">i</span> = 1, 2,…, 18) that is a net transmitter (receiver). The thickness of arrows reflects the strength of the spillover between a pair of CCS codes. Thicker arrows indicate stronger spillovers between two CCS codes. (<b>b</b>) Net Transmitters: Ten of these eighteen clinical diagnosis-related groups of diseases (these being infectious and parasitic diseases (CCS1), neoplasms (CCS2), endocrine, nutritional, and metabolic diseases and immunity disorders (CCS3), diseases of the blood and blood-forming organs (CCS4), diseases of the circulatory system (CCS7), diseases of the digestive system (CCS9), diseases of the genitourinary system (CCS10) diseases of the musculoskeletal system and connective tissue (CCS13), symptoms, signs, and ill-defined conditions and factors influencing health status (CCS17), and residual codes unclassified diseases (CCS18) are net transmitters of spillover. (<b>c</b>) Net Receivers: The other eight of these eighteen clinical diagnosis-related groups of diseases (these being mental illness (CCS5), diseases of the nervous system and sense organs (CCS6), diseases of the respiratory system (CCS8), complications of pregnancy, childbirth, and the puerperium (CCS11), diseases of the skin and subcutaneous tissue (CCS12), congenital anomalies (CCS14), certain conditions originating in the perinatal period (CCS15), and injury and poisoning (CCS16)) are net receivers of spillover.</p>
Full article ">Figure 2
<p>Time plots for variables used for the robust least square estimation. Note: <span class="html-italic">TCI</span> and <span class="html-italic">NTDCI<sub>i</sub></span> (<span class="html-italic">i</span> = 1, 2,…, 18) represent total connectedness and net total directional connectedness indices of CCS code <span class="html-italic">i</span>, respectively. The monthly indices were aggregated from weekly indices. ln(●) is the nature logarithm operator. All trends were generated using the Hodrick–Prescott filter with a smoothing parameter (lambda = 14400). <span class="html-italic">X</span>-axis illustrates time horizon. Right <span class="html-italic">Y</span>-axis and left <span class="html-italic">Y</span>-axis indicate the trends of variables and their cyclical components, respectively. We could further separate these eighteen disease-specific healthcare expenditures into three groups: the first group being the pure net transmitters of spillover (all having positive signs of <span class="html-italic">NTDCI</span>), which includes the infectious and parasitic diseases (CCS1), neoplasms (CCS2), endocrine, nutritional, and metabolic diseases and immunity disorders (CCS3), diseases of the circulatory system (CCS7), and diseases of the musculoskeletal system and connective tissue (CCS13). The second group is the pure net receivers of spillover (all with negative signs of <span class="html-italic">NTDCI</span>), consisting of complications of pregnancy, childbirth, and the puerperium (CCS11), congenital anomalies (CCS14), and certain conditions originating in the perinatal period (CCS15). The third group is the in-betweens (having mixed signs of <span class="html-italic">NTDCI</span>), comprised of diseases of the blood and blood-forming organs (CCS4), mental illness (CCS5), diseases of the nervous system and sense organs (CCS6), diseases of the respiratory system (CCS8), diseases of the digestive system (CCS9), diseases of the genitourinary system (CCS10), diseases of the skin and subcutaneous tissue (CCS12), injury and poisoning (CCS16), symptoms, signs, and ill-defined conditions and factors influencing health status (CCS17), and residual codes unclassified diseases (CCS18).</p>
Full article ">
19 pages, 1000 KiB  
Article
Cost Analysis of Selected Radiotherapeutic Modalities for Prostate Cancer Treatment—Czech Republic Case Study for the Purposes of Hospital Based HTA
by Petra Hospodková, Tomáš Husár, Barbora Klíčová, Lucie Severová, Karel Šrédl and Roman Svoboda
Healthcare 2021, 9(1), 98; https://doi.org/10.3390/healthcare9010098 - 19 Jan 2021
Cited by 3 | Viewed by 2794
Abstract
This study aims to calculate the costs of prostate cancer radiotherapy in a regional hospital Department of Radiation Oncology equipped with Three-Dimensional Conformal Radiation Therapy (3D-CRT) and Intensity Modulated Radiation Therapy (IMRT) Volumetric Arc Therapy (VMAT) radiation technology, using activity based costing (ABC), [...] Read more.
This study aims to calculate the costs of prostate cancer radiotherapy in a regional hospital Department of Radiation Oncology equipped with Three-Dimensional Conformal Radiation Therapy (3D-CRT) and Intensity Modulated Radiation Therapy (IMRT) Volumetric Arc Therapy (VMAT) radiation technology, using activity based costing (ABC), and to compare the costs of both methods at the level of component treatment process activities and with respect to insurance reimbursements. The costing was performed based on a sample of 273 IMRT VMAT patients and 312 3D-CRT patients in a regional hospital in the period from 2018 to 2019. The research has highlighted the necessity to place emphasis on factors that may skew the costing results. The resulting output has been supplemented by a sensitivity analysis, whereas the modeled parameter is represented by the time required for one patient fraction on a linear accelerator and the time the Radiology Assistant needs to prepare the complete radiation plan as part of radiotherapy planning. Moreover, the effects of the received grant, in the form of calculated write-offs, are also considered. The case study uses the example of radiotherapy to demonstrate the potential of ABC and suggests considering the application of this method as an effective management tool for cost and economic evaluation as part of comprehensive hospital assessment under the Hospital-Based Health Technology Assessment (HB-HTA) initiative. Full article
Show Figures

Figure 1

Figure 1
<p>Component phases of the Activity Based Costing (ABC) method.</p>
Full article ">Figure 2
<p>ABC process.</p>
Full article ">Figure 3
<p>Comparison of costs of component treatment process activities for both modalities. Red dots represent the total.</p>
Full article ">
Back to TopTop