Novel Insights into Cannabinoid Receptors, Molecular Targets, and Therapeutic Potentials
A topical collection in Cells (ISSN 2073-4409). This collection belongs to the section "Cell Signaling".
Viewed by 72519Editor
Topical Collection Information
Dear Colleagues,
Cannabis has been used as a remedy for illness for centuries in various cultures. Recently, there has been a renewed interest in the uses of cannabis and cannabinoids for medicinal purposes, due to improved legal status in medical cannabis and the advances in cannabinoid research. Cannabinoids are composed of three categories, including phytocannabinoids (the active chemical components of cannabis), endocannabinoids (the cannabinoid-like substances in our body), and synthetic cannabinoids (the cannabinoids prepared in the laboratory). Cannabinoids exert their effects through multiple receptors, targets and signaling pathways. In addition to CB1 and CB2, two well-established cannabinoid receptors, there are numerous molecular targets for cannabinoids, e.g., G-protein-coupled receptors (GPR55, GPR18, GPR3/GPR6/GPR12), transient receptor potential (TRPV) channels, and peroxisome proliferator-activated (PPAR) receptors. These cannabinoid receptors and molecular targets play essential roles for the effects of cannabinoids in health and disease. In addition, they are underscoring the mechanisms of actions for the potential therapeutic effects of a variety of cannabinoids. Recently, there have been tremendous advances in our understanding of these receptors and molecular targets, as well as their implications in the therapeutic potentials of cannabinoids.
The emphasis of this Topical Collection is on the recent advances in our knowledge of cannabinoid receptors, molecular targets, and signaling pathways in the context of physiological/pathological conditions, and cannabinoid therapeutic potentials. Review articles summarizing recent discoveries, and original research articles of both basic and clinical studies are welcome.
We look forward to your important contributions.
Dr. Zhao-Hui Song
Collection Editor
Manuscript Submission Information
Manuscripts should be submitted online at www.mdpi.com by registering and logging in to this website. Once you are registered, click here to go to the submission form. Manuscripts can be submitted until the deadline. All submissions that pass pre-check are peer-reviewed. Accepted papers will be published continuously in the journal (as soon as accepted) and will be listed together on the collection website. Research articles, review articles as well as short communications are invited. For planned papers, a title and short abstract (about 100 words) can be sent to the Editorial Office for announcement on this website.
Submitted manuscripts should not have been published previously, nor be under consideration for publication elsewhere (except conference proceedings papers). All manuscripts are thoroughly refereed through a single-blind peer-review process. A guide for authors and other relevant information for submission of manuscripts is available on the Instructions for Authors page. Cells is an international peer-reviewed open access semimonthly journal published by MDPI.
Please visit the Instructions for Authors page before submitting a manuscript. The Article Processing Charge (APC) for publication in this open access journal is 2700 CHF (Swiss Francs). Submitted papers should be well formatted and use good English. Authors may use MDPI's English editing service prior to publication or during author revisions.
Keywords
- Cannabinoid receptor
- Molecular target
- Signal transduction
- Therapeutic potentials
<p>JD5037 treatment caused liver injury in <span class="html-italic">Mdr2<sup>−/−</sup></span> mice. (<b>A</b>) Treatment schedule. (<b>B</b>) JD5037 reduced body weight. (<b>C</b>,<b>D</b>) JD5037 increased liver enzymes. (<b>E</b>) H&E staining of liver sections. White arrows: periductal fibrosis; yellow arrows: inflammatory cells; green arrows: hepatocyte damage. Magnification, 100×. (<b>F</b>) The effects of JD5037 on hepatic CB1R and CB2R protein expression. Left: immunoblots; right: band density analysis, blue dots denote untreated (UT, saline), red denotes JD5037 treated, green denotes untreated, and purple denotes JD5037 treated CB1R or CB2R levels in each animal samples. ** <span class="html-italic">p</span> < 0.01; *** <span class="html-italic">p</span> < 0.001; **** <span class="html-italic">p</span> < 0.0001.</p> Full article ">Figure 2
<p>JD5037 treatment increased serum bile acid levels in <span class="html-italic">Mdr2<sup>−/−</sup></span> mice. (<b>A</b>) Serum bile acid. (<b>B</b>) Liver bile acid. (<b>C</b>) mRNA levels of bile acid transporters. (<b>D</b>) mRNA levels of the enzymes for bile acid synthesis. Each dot represents one mouse sample. Black dots indicate saline treated, and blue dots denote JD5037 treated. ns denotes non-significant. ** <span class="html-italic">p</span> < 0.01.</p> Full article ">Figure 3
<p>JD5037 treatment exacerbated liver fibrosis in <span class="html-italic">Mdr2<sup>−/−</sup></span> mice. (<b>A</b>) Sirius red staining of liver sections. Magnification, 100×. (<b>B</b>) Liver hydroxyproline concentrations. (<b>C</b>) mRNA levels of fibrogenic genes in the liver. (<b>D</b>) CK19 mRNA levels in the liver. (<b>E</b>) mRNA levels of inflammatory factors in the liver. Black dotes denote saline treated and blue dots denote JD5037 treated mouse sample. * <span class="html-italic">p</span> < 0.05; ** <span class="html-italic">p</span> < 0.01; *** <span class="html-italic">p</span> < 0.001; **** <span class="html-italic">p</span> < 0.0001.</p> Full article ">Figure 4
<p>JD5037 treatment did not prevent liber fibrosis development in <span class="html-italic">Mdr2<sup>−/−</sup></span> mice. (<b>A</b>) Treatment schedule. (<b>B</b>) Body weight gain. (<b>C</b>) Sirius red staining of liver sections. Magnification, 100×. (<b>D</b>) Liver enzyme levels. (<b>E</b>) Bile acid levels in the serum and liver. Black dotes denote saline treated and blue dots denote JD5037 treated mouse sample. ns denotes non-significant. * <span class="html-italic">p</span> < 0.05.</p> Full article ">
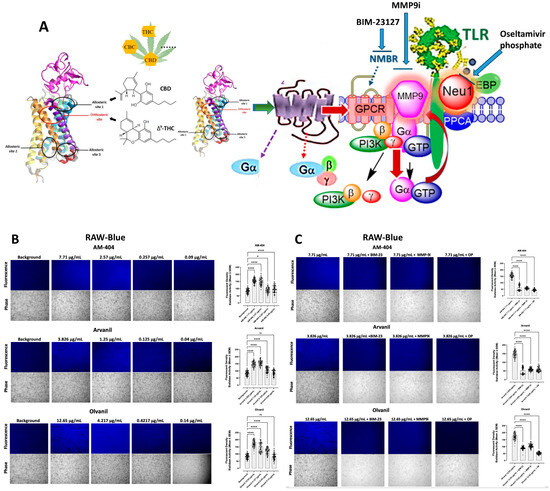
<p>Sialidase activity is associated with CB1 GPCR agonist treatments of live RAW-blue macrophage cells. (<b>A</b>) We propose that the CB1 GPCRs heterodimerize with neuromedin B (NMBR) tethered to TLR in a multimeric receptor complex with matrix metalloproteinase-9 (MMP-9) and neuraminidase-1 (Neu1) in naïve (unstimulated) TLR-expressing cells. Here, a novel molecular signaling platform regulating the interaction and signaling mechanism between these molecules on the cell surface uncovers a functional selectivity of CB1 GPCR biased heteromers with NMBR to induce TLR activation signaling axis mediated by Neu1 sialidase activation and the modification of TLR glycosylation. This signaling platform potentiates MMP9 and Neu1 crosstalk on the cell surface, which is essential for activating TLR. Citation: Taken in part from Bunsick et al. [<a href="#B52-cells-13-00480" class="html-bibr">52</a>]. (<b>B</b>) Cells were allowed to adhere on 12 mm circular glass slides for 24 h at 37 °C in a humidified incubator. After removing the media, 0.318 mM 4-MUNANA substrate in Tris-buffered saline pH 7.4 was added to cells alone (control background) or with either AM-404, Arvanil, and Olvanil at the indicated dosage. Fluorescent images were taken 2 min after adding substrate using epi-fluorescent microscopy (20× objective). The sialidase hydrolyzed product of 4-MUNANA (4-MU) has an emission at 450 nm (blue color) when excited at 365 nm. The mean fluorescence of 50 multi-point replicates surrounding the live cells’ periphery was calculated using Image J software, 1.5g, Java 1.8.0_345 (64-bit). The mean fluorescence ± S.E.M is represented by error bars. (<b>C</b>) Different components of the signaling paradigm were inhibited using BIM-23127, an antagonist of NMBR, MMP9i, an inhibitor of MMP-9, and oseltamivir phosphate (OP), an inhibitor of Neu-1 at the indicated predetermined concentrations. The quantified data represent two to three independent experiments displaying similar results. Statistical significance, as indicated by asterisks, was calculated with ANOVA and Fisher’s LSD uncorrected multiple comparisons post hoc test at a confidence level of 95%. ns = non-significant, **** <span class="html-italic">p</span> < 0.0001, * <span class="html-italic">p</span> < 0.05.</p> Full article ">Figure 2
<p>(<b>A</b>) We propose that the CB1 GPCRs heterodimerize with neuromedin B (NMBR) tethered to RTK in a multimeric receptor complex with matrix metalloproteinase-9 (MMP-9) and neuraminidase-1 (Neu1) in naïve (unstimulated) cancer cells. Citation: Taken in part from Bunsick et al. [<a href="#B52-cells-13-00480" class="html-bibr">52</a>] and Haxho et al. [<a href="#B9-cells-13-00480" class="html-bibr">9</a>]. Sialidase activity of live PANC-1 (<b>B</b>,<b>C</b>) and SW-620 (<b>D</b>,<b>E</b>) in response to AM-404, Arvanil, and Olvanil. CB1 agonists, AM-404, Arvanil, and Olvanil, significantly induce Neu-1 sialidase activity in a dose-dependent fashion compared to media control in live PANC-1 (<b>B</b>) and SW-620 (<b>D</b>). In the three cell lines, the saturation and KI concentrations for each agonist produced a more significant impact on sialidase activity compared to the latter two concentrations, which were more representative of the control. The sialidase hydrolyzed product of 4-MUNANA (4-MU) has an emission at 450 nm (blue color) when excited at 365 nm. The mean fluorescence of 50 multi-point replicates surrounding the cell’s periphery was calculated using Image J software. The mean fluorescence ± S.E.M is represented by error bars. (<b>C</b>,<b>E</b>) Different components of the signaling paradigm were inhibited using BIM-23127, an antagonist of NMBR, MMP9i, an inhibitor of MMP-9, and oseltamivir phosphate (OP), an inhibitor of Neu-1 at the indicated predetermined concentrations. The quantified data represent two to three independent experiments displaying similar results. Statistical significance, as indicated by asterisks, was calculated with ANOVA and Fisher’s uncorrected LSD multiple comparisons post hoc test at a confidence level of 95%. ns = non-significant, **** <span class="html-italic">p</span> < 0.0001, ** <span class="html-italic">p</span> < 0.01.</p> Full article ">Figure 2 Cont.
<p>(<b>A</b>) We propose that the CB1 GPCRs heterodimerize with neuromedin B (NMBR) tethered to RTK in a multimeric receptor complex with matrix metalloproteinase-9 (MMP-9) and neuraminidase-1 (Neu1) in naïve (unstimulated) cancer cells. Citation: Taken in part from Bunsick et al. [<a href="#B52-cells-13-00480" class="html-bibr">52</a>] and Haxho et al. [<a href="#B9-cells-13-00480" class="html-bibr">9</a>]. Sialidase activity of live PANC-1 (<b>B</b>,<b>C</b>) and SW-620 (<b>D</b>,<b>E</b>) in response to AM-404, Arvanil, and Olvanil. CB1 agonists, AM-404, Arvanil, and Olvanil, significantly induce Neu-1 sialidase activity in a dose-dependent fashion compared to media control in live PANC-1 (<b>B</b>) and SW-620 (<b>D</b>). In the three cell lines, the saturation and KI concentrations for each agonist produced a more significant impact on sialidase activity compared to the latter two concentrations, which were more representative of the control. The sialidase hydrolyzed product of 4-MUNANA (4-MU) has an emission at 450 nm (blue color) when excited at 365 nm. The mean fluorescence of 50 multi-point replicates surrounding the cell’s periphery was calculated using Image J software. The mean fluorescence ± S.E.M is represented by error bars. (<b>C</b>,<b>E</b>) Different components of the signaling paradigm were inhibited using BIM-23127, an antagonist of NMBR, MMP9i, an inhibitor of MMP-9, and oseltamivir phosphate (OP), an inhibitor of Neu-1 at the indicated predetermined concentrations. The quantified data represent two to three independent experiments displaying similar results. Statistical significance, as indicated by asterisks, was calculated with ANOVA and Fisher’s uncorrected LSD multiple comparisons post hoc test at a confidence level of 95%. ns = non-significant, **** <span class="html-italic">p</span> < 0.0001, ** <span class="html-italic">p</span> < 0.01.</p> Full article ">Figure 3
<p>Co-localization of cannabinoid type 1 (CB1) receptor with Neu-1. CB1 receptors co-localized with Neu-1 in naïve, unstimulated RAW-Blue (<b>A</b>), PANC-1 (<b>B</b>), and SW-620 (<b>C</b>) cells. For analysis of co-localization, cells were fixed, permeabilized, blocked, and immunostained with anti-CB1 conjugated with AlexaFluor 594 (red) and anti-Neu-1 conjugated with AlexaFluor 488 (green). Co-localization was quantified using AxioVision imaging software to compute the Pearson correlation coefficient, measuring the linear association between two variables (40× objective). The Pearson correlation coefficient for co-localization between CB1 receptors and Neu-1 was 0.5917 in RAW-Blue (<b>A</b>), 0.6467 in PANC-1 (<b>B</b>), and 0.6455 in SW-620 (<b>C</b>), affirming CB1-Neu1 receptor proximity.</p> Full article ">Figure 3 Cont.
<p>Co-localization of cannabinoid type 1 (CB1) receptor with Neu-1. CB1 receptors co-localized with Neu-1 in naïve, unstimulated RAW-Blue (<b>A</b>), PANC-1 (<b>B</b>), and SW-620 (<b>C</b>) cells. For analysis of co-localization, cells were fixed, permeabilized, blocked, and immunostained with anti-CB1 conjugated with AlexaFluor 594 (red) and anti-Neu-1 conjugated with AlexaFluor 488 (green). Co-localization was quantified using AxioVision imaging software to compute the Pearson correlation coefficient, measuring the linear association between two variables (40× objective). The Pearson correlation coefficient for co-localization between CB1 receptors and Neu-1 was 0.5917 in RAW-Blue (<b>A</b>), 0.6467 in PANC-1 (<b>B</b>), and 0.6455 in SW-620 (<b>C</b>), affirming CB1-Neu1 receptor proximity.</p> Full article ">Figure 4
<p>Immunofluorescence analysis of E-cadherin expression in response to CB1-agonists. CB1-agonists, AM-404, Arvanil, and Olvanil notably reduced the expression of the epithelial–mesenchymal transition (EMT), E-cadherin, in SW-620 cells. Cells were fixed, permeabilized, blocked, and immunostained with primary mouse monoclonal IgG antibodies for E-cadherin, followed by goat anti-mouse AlexaFluor 488 (green) secondary antibodies. As an isotype control, we use normal mouse IgG. The fluorescence was calculated using Corel Photo-Paint, with the average of eight points subtracted by the background fluorescence and multiplied by the pixel density (20× objective). Statistical significance was calculated with ANOVA and Fisher’s uncorrected LSD multiple comparisons post hoc test at a confidence level of 95%. ns = non-significant.</p> Full article ">Figure 5
<p>Immunofluorescence analysis of vimentin expression in response to CB1-agonists. CB1-agonists, AM-404, Arvanil, and Olvanil, significantly increased the expression of the epithelial–mesenchymal transition (EMT), vimentin, in SW-620 cells. Cells were fixed, permeabilized, blocked, and immunostained with primary mouse monoclonal IgG antibodies for vimentin, followed by goat anti-mouse AlexaFluor 488 (green) secondary antibodies. As an isotype control, we use normal mouse IgG. The fluorescence was calculated using Corel Photo-Paint, with the average of eight points subtracted by the background fluorescence and multiplied by the pixel density (20× objective). Statistical significance, as indicated by asterisks, was calculated with ANOVA and Fisher’s uncorrected LSD multiple comparisons post hoc test at a confidence level of 95%. ns = non-significant, **** <span class="html-italic">p</span> < 0.0001, *** <span class="html-italic">p</span> < 0.001.</p> Full article ">Figure 6
<p>The cells stably express a secreted embryonic alkaline phosphatase (SEAP) gene inducible by NF-kB and AP-1 transcription factors. Upon stimulation, RAW-Blue™ cells activate NF-kB and AP-1, leading to the secretion of SEAP, which is detectable and measurable when using QUANTI-Blue™, a SEAP detection medium (Invivogen). Quantitative spectrophotometry analysis of the effect of LPS and AM-404-, Arvanil-, and Olvanil-induced SEAP activity in the culture medium. The measurement of the relative SEAP activity was calculated as fold change in each compound (SEAP activity in medium from treated cells minus no cell background over SEAP activity in medium from untreated cells minus background). Results are the means of three separate experiments. Statistical significance, as indicated by asterisks, was calculated with ANOVA and Fisher’s uncorrected LSD multiple comparisons post hoc test at a confidence level of 95%.**** <span class="html-italic">p</span> < 0.0001, *** <span class="html-italic">p</span> < 0.001.</p> Full article ">Figure 7
<p>Cannabinoid type 1 (CB1) receptor participates in a multimeric receptor complex with neuromedin B receptor (NMBR), neuraminidase 1 (Neu-1), and Toll-like receptor (TLR). Here, the biased CB1 GPCR platform potentiates Neu-1 and MMP-9 cell surface crosstalk, mediating TLR glycosylation modification and transactivation and subsequent NF-kB-induced epigenetic rewiring. ∆<sup>9</sup>-tetrahydrocannabinol (THC), an orthosteric ligand, and cannabidiol (CBD), an allosteric ligand, alongside the N-terminus and location of the orthosteric and allosteric binding sites, are illustrated concerning CB1 cannabinoid receptors. Notes: CB1 agonists stimulation of the biased CB1 GPCR induces receptor heterodimerization with NMBR, wherein NMBR-induced activation of MMP-9 allows the endopeptidase to cleave the elastin binding protein and expose the catalytic sialidase domain of Neu-1. The sialidase domain of Neu-1 hydrolyzes alpha-2,3-sialic acid from the glycosylated receptor, TLR, reducing the steric hindrance, which facilitates TLR dimerization, activation, and cellular signaling. The resultant downstream signaling mediates the phosphorylation of the IkB subunit, which facilitates the translocation of NF-kB to the nucleus, enabling epigenetic modulation of gene expression [<a href="#B8-cells-13-00480" class="html-bibr">8</a>,<a href="#B89-cells-13-00480" class="html-bibr">89</a>]. Citation: Reprinted/Adapted with permission, Bunsick et al. [<a href="#B52-cells-13-00480" class="html-bibr">52</a>], Qorri et al. [<a href="#B86-cells-13-00480" class="html-bibr">86</a>], Jakowiecki et al. [<a href="#B87-cells-13-00480" class="html-bibr">87</a>], Reber et al. [<a href="#B88-cells-13-00480" class="html-bibr">88</a>], and Marquardt et al. [<a href="#B90-cells-13-00480" class="html-bibr">90</a>] Licensee MDPI, Basel, Switzerland. These articles are openaccess articles distributed under the terms and conditions of the Creative Commons Attribution (CCBY) license (<a href="http://creativecommons.org/licenses/by/4.0/" target="_blank">http://creativecommons.org/licenses/by/4.0/</a> (23 April 2021), which permits unrestricted use, distribution, and reproduction in any medium, provided the original author and source are properly credited.</p> Full article ">
Full article ">Figure 1
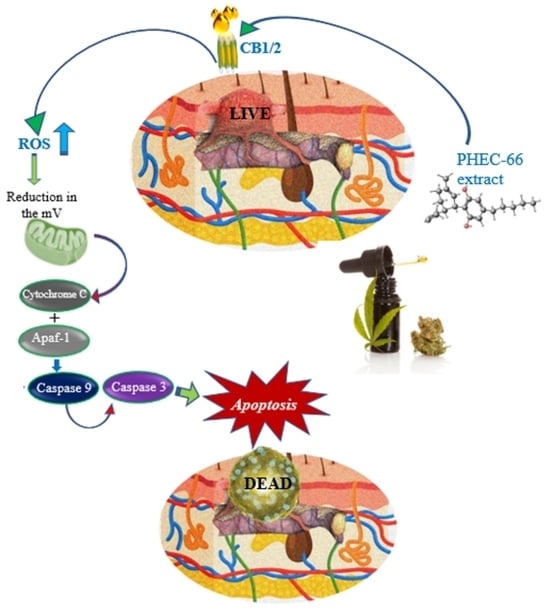
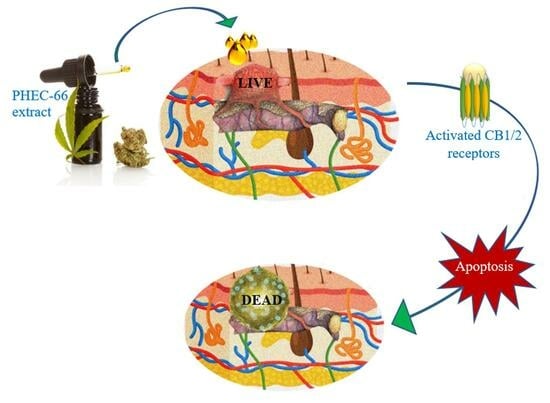
<p>Effect of PHEC-66 on the expression of cell membrane receptors. Melanoma (MM418-C1, MM329, and MM96L) and keratinocyte-derived cells (HaCaT) were treated with PHEC-66 at its IC<sub>50</sub> concentration for 24 h. Asterisks indicate statistically significant differences between PHEC-66-IC<sub>50</sub>-treated melanoma cell lines and the corresponding non-treated cells. All data represent the mean ± SEM of three independent experiments (**** <span class="html-italic">p</span> < 0.0001). The dotted line represents untreated cells which ranked number one across all cells on the <span class="html-italic">Y</span>-axis scale.</p> Full article ">Figure 2
<p>The effect of PHEC-66 extract on the viability of melanoma cells treated with CB1 and CB2 antagonists. MM418-C1 cells treated with PHEC-66 in the presence or absence of (<b>A</b>) CB1 antagonist (1.25 µg/mL AM251), (<b>B</b>) CB2 antagonist (1.25 µg/mL AM630). MM329 cells treated with PHEC-66 in the presence or absence of (<b>C</b>) CB1 antagonist (1.25 µg/mL AM251), (<b>D</b>) CB2 antagonist (1.25 µg/mL AM630). MM96L cells treated with PHEC-66 in the presence or absence of (<b>E</b>) CB1 antagonist (1.25 µg/mL AM251), (<b>F</b>) CB2 antagonist (1.25 µg/mL AM630). The data are presented as means ± standard deviations for each group (<span class="html-italic">n</span> = 3). Significant differences between groups are indicated by * <span class="html-italic">p</span> < 0.05, ** <span class="html-italic">p</span> < 0.01, *** <span class="html-italic">p</span> < 0.001, **** <span class="html-italic">p</span> < 0.0001.</p> Full article ">Figure 2 Cont.
<p>The effect of PHEC-66 extract on the viability of melanoma cells treated with CB1 and CB2 antagonists. MM418-C1 cells treated with PHEC-66 in the presence or absence of (<b>A</b>) CB1 antagonist (1.25 µg/mL AM251), (<b>B</b>) CB2 antagonist (1.25 µg/mL AM630). MM329 cells treated with PHEC-66 in the presence or absence of (<b>C</b>) CB1 antagonist (1.25 µg/mL AM251), (<b>D</b>) CB2 antagonist (1.25 µg/mL AM630). MM96L cells treated with PHEC-66 in the presence or absence of (<b>E</b>) CB1 antagonist (1.25 µg/mL AM251), (<b>F</b>) CB2 antagonist (1.25 µg/mL AM630). The data are presented as means ± standard deviations for each group (<span class="html-italic">n</span> = 3). Significant differences between groups are indicated by * <span class="html-italic">p</span> < 0.05, ** <span class="html-italic">p</span> < 0.01, *** <span class="html-italic">p</span> < 0.001, **** <span class="html-italic">p</span> < 0.0001.</p> Full article ">Figure 3
<p>Effect of PHEC-66 treatment on cellular ROS level in melanoma cells. (<b>A</b>) ROS levels for MM96L were measured using BD LSRFortessa, (<b>B</b>) MM418-C1, (<b>C</b>) MM329, and (<b>D</b>) MM96L were treated for 24 h with PHEC-66 h at both 50% and 100% of its IC<sub>50</sub> concentration. Data are expressed as the means ± standard deviations of triplicate experiments (<span class="html-italic">n</span> = 3). Significant differences between PHEC-66-treated cells and vehicle-control cells are marked with * <span class="html-italic">p</span> < 0.05, **** <span class="html-italic">p</span> < 0.0001.</p> Full article ">Figure 4
<p>The effect of PHEC-66 treatment on melanoma cell cycle kinetics was assessed for three different cell lines. These cells were exposed to PHEC-66 at concentrations equivalent to 50%, 100%, and 200% of their respective IC<sub>50</sub> values, and the treatment duration was 24 h. (<b>A</b>) Cell cycle distribution for MM96L was analysed for MM96L using BD LSRFortessa, (<b>B</b>) MM418C1, (<b>C</b>) MM329, and (<b>D</b>) MM96L. The data presented represent the mean ± standard deviations for each group (<span class="html-italic">n</span> = 3). Significant differences between groups are indicated * <span class="html-italic">p</span> < 0.05, ** <span class="html-italic">p</span> < 0.01, *** <span class="html-italic">p</span> < 0.001.</p> Full article ">Figure 4 Cont.
<p>The effect of PHEC-66 treatment on melanoma cell cycle kinetics was assessed for three different cell lines. These cells were exposed to PHEC-66 at concentrations equivalent to 50%, 100%, and 200% of their respective IC<sub>50</sub> values, and the treatment duration was 24 h. (<b>A</b>) Cell cycle distribution for MM96L was analysed for MM96L using BD LSRFortessa, (<b>B</b>) MM418C1, (<b>C</b>) MM329, and (<b>D</b>) MM96L. The data presented represent the mean ± standard deviations for each group (<span class="html-italic">n</span> = 3). Significant differences between groups are indicated * <span class="html-italic">p</span> < 0.05, ** <span class="html-italic">p</span> < 0.01, *** <span class="html-italic">p</span> < 0.001.</p> Full article ">Figure 5
<p>The effect of PHEC-66 treatment on melanoma was assessed for three different cell lines. These cells were exposed to PHEC-66 at concentrations equivalent to 50%, 100%, and 200% of their respective IC<sub>50</sub> values, and the treatment duration was 48 h. (<b>A</b>) Apoptosis for MM96L was analysed using BD LSRFortessa, (<b>B</b>) MM418-C1, (<b>C</b>) MM329, and (<b>D</b>) MM96L. Data are expressed as means ± standard deviations of each group (<span class="html-italic">n</span> = 3). Significant differences between groups are marked with **** <span class="html-italic">p</span> < 0.0001.</p> Full article ">Figure 5 Cont.
<p>The effect of PHEC-66 treatment on melanoma was assessed for three different cell lines. These cells were exposed to PHEC-66 at concentrations equivalent to 50%, 100%, and 200% of their respective IC<sub>50</sub> values, and the treatment duration was 48 h. (<b>A</b>) Apoptosis for MM96L was analysed using BD LSRFortessa, (<b>B</b>) MM418-C1, (<b>C</b>) MM329, and (<b>D</b>) MM96L. Data are expressed as means ± standard deviations of each group (<span class="html-italic">n</span> = 3). Significant differences between groups are marked with **** <span class="html-italic">p</span> < 0.0001.</p> Full article ">
Full article ">Figure 1
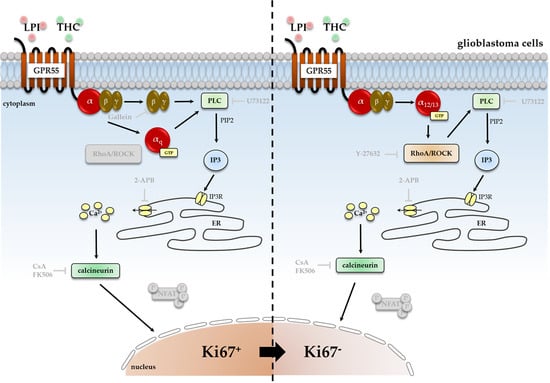
<p>Impact of ROCK inhibitor Y-27632 on THC- and LPI-induced reduction of the number of Ki67<sup>+</sup> nuclei. <span class="html-italic">GBM #4</span> and <span class="html-italic">GBM #10</span> were left untreated or exposed to THC (<b>a</b>) or LPI (<b>b</b>) for 24 h, resulting in a decreased number of Ki67<sup>+</sup> nuclei. In <span class="html-italic">GBM #4</span> THC- (<b>a</b>) and LPI (<b>b</b>)-mediated effects on the number of Ki67<sup>+</sup> nuclei remained unaffected in the presence of Y-27632. In contrast, pretreatment with Y-27632 significantly attenuated the responses of <span class="html-italic">GBM #10</span> to THC (<b>a</b>) and LPI (<b>b</b>). Altered numbers of Ki67<sup>+</sup> nuclei by Y-27632 itself were not observed (<b>a</b>,<b>b</b>). Data are presented as means ± SEMs of N = 3 independent experiments performed in duplicate. Each red dot represents an individual data point. −/+ indicates without/with the corresponding substance. ++ denotes that cells were pre-incubated with Y-27632 before THC or LPI was added. Significance was set at <span class="html-italic">p</span> < 0.05. The asterisk denotes significant results regarding the respective measurement indicated by the bar.</p> Full article ">Figure 2
<p>Impact of PLC inhibitor U73122 and its inactive analogue U73343 on THC- and LPI-induced reduction of the number of Ki67<sup>+</sup> nuclei. <span class="html-italic">GBM #4</span> and <span class="html-italic">GBM #10</span> were left untreated or exposed to THC (<b>a</b>) or LPI (<b>b</b>) for 24 h, resulting in a decreased number of Ki67<sup>+</sup> nuclei. Pretreatment with U73122, a commonly used inhibitor of PLC, significantly reversed the effects obtained after exposure to THC (<b>a</b>) or LPI (<b>b</b>) in both <span class="html-italic">GBM #4</span> and <span class="html-italic">GBM #10</span>. Its inactive form U73343 failed to diminish the responses to THC (<b>a</b>) and LPI (<b>b</b>) at the same concentrations used for U73122. U73122 or U73343 alone did not cause any alterations (<b>a</b>,<b>b</b>). Data are presented as means ± SEMs of N = 3 independent experiments performed in duplicate. Each red dot represents an individual data point. −/+ indicates without/with the corresponding substance ++ denotes that cells were pre-incubated with U73122 or U73343 before THC or LPI was added. Significance was set at <span class="html-italic">p</span> < 0.05. The asterisk denotes significant results regarding the respective measurement indicated by the bar.</p> Full article ">Figure 3
<p>Impact of antagonized IP3-sensitive receptors using 2-APB on THC- and LPI-induced reduction of the number of Ki67<sup>+</sup> nuclei. <span class="html-italic">GBM #4</span> and <span class="html-italic">GBM #10</span> were left untreated or exposed to THC (<b>a</b>) or LPI (<b>b</b>) for 24 h, resulting in a decreased number of Ki67<sup>+</sup> nuclei. The effects of THC (<b>a</b>) and LPI (<b>b</b>) were significantly reduced after pre-incubation with 2-APB in both <span class="html-italic">GBM #4</span> and <span class="html-italic">GBM #10</span>. When <span class="html-italic">GBM #4</span> was exposed to 2-APB alone, a small reduction in the number Ki67<sup>+</sup> nuclei were observed (<b>a</b>,<b>b</b>). Data are means ± SEMs of N = 4 independent experiments performed in duplicate. Each red dot represents an individual data point. -/+ indicates without/with the corresponding substance. ++ denotes that cells were pre-incubated with 2-APB before THC or LPI was added. Significance was set at <span class="html-italic">p</span> < 0.05. The asterisk denotes significant results regarding the respective measurement indicated by the bar.</p> Full article ">Figure 4
<p>Detection and quantification of genes encoding different Gα subunits at transcript level. Expression of <span class="html-italic">GNAO1</span>, <span class="html-italic">GNAI1</span>, <span class="html-italic">GNAI2</span>, <span class="html-italic">GNAI3</span>, <span class="html-italic">GNASS</span>, <span class="html-italic">GNASL</span>, <span class="html-italic">GNA12</span>, <span class="html-italic">GNA13</span>, and <span class="html-italic">GNAQ</span> were analyzed by quantitative RT-PCR in untreated cells of <span class="html-italic">GBM #4</span> and <span class="html-italic">GBM #10</span>. All cells expressed the examined Gα-subunits as transcripts (<b>a</b>) at different levels (<b>b</b>). <span class="html-italic">RNA polymerase II subunit A</span> (<span class="html-italic">POLR2A</span>) served as an internal reference. Furthermore, relative transcript levels were calculated using the 2<sup>−∆∆Ct</sup> method (<b>b</b>). Remarkably, <span class="html-italic">GBM #4</span> showed a significantly higher amount of Gα<sub>o</sub> transcripts than <span class="html-italic">GBM #10</span>, whereas Gα<sub>q</sub> showed significantly higher expression by <span class="html-italic">GBM #10</span> when compared to <span class="html-italic">GBM #4</span>. The abundance and distribution of gene transcripts encoding different subunits within one cell population were similar in <span class="html-italic">GBM #4</span> and <span class="html-italic">GBM #10</span>. Altered ratios to others were observed for <span class="html-italic">GNAOI</span> in <span class="html-italic">GBM #4</span> and <span class="html-italic">GNAQ</span> in <span class="html-italic">GBM #10</span>. Data represent means ± SEMs (normalized to <span class="html-italic">GBM #4</span> or <span class="html-italic">GNAOI</span>) of N = 4 independent experiments performed in triplicate. Each red dot represents an individual data point. Significance was set at <span class="html-italic">p</span> < 0.05. The asterisk denotes significant results regarding the respective measurement indicated by the bar.</p> Full article ">Figure 5
<p>Impacts of pertussis toxin (PTX, Gα<sub>o/i</sub> inhibitor) and forskolin (FSK) on the number of Ki67<sup>+</sup> cells in the presence or absence of THC or LPI. <span class="html-italic">GBM #4</span> and <span class="html-italic">GBM #10</span> were left untreated or exposed to THC (<b>a</b>) or LPI (<b>b</b>) for 24 h, resulting in a decreased number of Ki67<sup>+</sup> nuclei. A significantly decreased number of Ki67<sup>+</sup> nuclei was detected after stimulation with PTX alone in <span class="html-italic">GBM #4</span> and <span class="html-italic">GBM #10</span>. When THC (<b>a</b>) or LPI (<b>b</b>) were applied after PTX pre-incubation, neither inhibitory nor additive effects were observed. In <span class="html-italic">GBM #4</span> and <span class="html-italic">GBM #10</span>, the number of Ki67<sup>+</sup> nuclei was reduced concentration dependently after FSK stimulation for 24 h (<b>c</b>). FSK was applied in an ascending concentration series of 0.1 µM, 1 µM, 5 µM, 10 µM, and 30 µM. Significant effects were measured after incubation with ≥1 µM FSK. Data are means ± SEMs of N = 3 independent experiments performed in duplicate. Each red dot represents an individual data point. −/+ indicates without/with the corresponding substance. ++ denotes that cells were pre-incubated with PTX before THC or LPI was added. Significance was set at <span class="html-italic">p</span> < 0.05. The asterisk denotes significant results regarding the respective measurement indicated by the bar.</p> Full article ">Figure 6
<p>Impact of Gβγ inhibitor gallein on THC- and LPI-induced reduction of the number of Ki67<sup>+</sup> nuclei. <span class="html-italic">GBM #4</span> and <span class="html-italic">GBM #10</span> were left untreated or exposed to THC (<b>a</b>) or LPI (<b>b</b>) for 24 h, resulting in a decreased number of Ki67<sup>+</sup> nuclei. After cells were pre-incubated with gallein, responses to THC (<b>a</b>) and LPI (<b>b</b>) were significantly abolished in <span class="html-italic">GBM #4</span>. In contrast, in <span class="html-italic">GBM #10</span>, gallein caused no impact on THC- (<b>a</b>) and LPI-mediated signaling (<b>b</b>), reducing the number of Ki67<sup>+</sup> nuclei. No alterations were observed when cells were stimulated with gallein alone (<b>a</b>,<b>b</b>). Data are means ± SEMs of N = 3 independent experiments performed in duplicate. Each red dot represents an individual data point. −/+ indicates without/with the corresponding substance. ++ denotes that cells were pre-incubated with gallein before THC or LPI was added. Significance was set at <span class="html-italic">p</span> < 0.05. The asterisk denotes significant results regarding the respective measurement indicated by the bar.</p> Full article ">Figure 7
<p>Impact of calcineurin inhibitor Cyclosporine A (CsA) and FK506 on THC- and LPI-induced reduction in the number of Ki67<sup>+</sup> nuclei. <span class="html-italic">GBM #4</span> and <span class="html-italic">GBM #10</span> were left untreated or exposed to THC (<b>a</b>) or LPI (<b>b</b>) for 24 h, resulting in a decreased number of Ki67<sup>+</sup> nuclei. In <span class="html-italic">GBM #4,</span> the effects of THC (<b>a</b>) and LPI (<b>b</b>) were significantly reduced by CsA and FK506, but CsA alone elicited a decreased number of Ki67<sup>+</sup> nuclei compared to the untreated control group. In <span class="html-italic">GBM #10</span>, lower concentrations of CsA and FK506 were used. No significant effects on responses to THC (<b>a</b>) and LPI (<b>b</b>) were observed in the presence of CsA, whereas FK506 partially inhibited the effects of THC (<b>a</b>) and LPI (<b>b</b>). Data are means ± SEMs of N = 3 or N = 5 (<span class="html-italic">GBM #10</span>, CsA) independent experiments performed in duplicate. Each red dot represents an individual data point. -/+ indicates without/with the corresponding substance. ++ denotes that cells were pre-incubated with CsA or FK506 before THC or LPI was added. Significance was set at <span class="html-italic">p</span> < 0.05. The asterisk denotes significant results regarding the respective measurement indicated by the bar.</p> Full article ">Figure 8
<p>Influence of THC and LPI on the subcellular localization of NFAT1 and NFAT2 after 30 min. Representative images of NFAT1 (<b>a</b>) and NFAT2 (<b>b</b>) after 30 min of THC and LPI stimulation. In untreated control cells, NFAT1 (<b>a</b>) and NFAT2 (<b>b</b>) were localized in both the cytoplasm and nucleus. Translocation of NFAT1 (<b>a</b>) and NFAT2 (<b>b</b>) after THC or LPI administration was not detectable in <span class="html-italic">GBM #4</span> or <span class="html-italic">GBM #10</span>. Increased signals of nuclear NFAT1 (<b>a</b>) were observed after ionomycin (Io) and thapsigargin (Thap) in both cell lines. In contrast, signals of NFAT2 (<b>b</b>) remained unchanged. Cell nuclei were counterstained with DAPI. Scale bar = 25 µm.</p> Full article ">Figure 9
<p>Influence of THC or LPI on the subcellular localization of NFAT3 and NFAT4 after 30 min. Representative images of NFAT3 (<b>a</b>) and NFAT4 (<b>b</b>) after 30 min of THC or LPI stimulation. In untreated control cells, NFAT3 (<b>a</b>) was mainly localized in the nucleus, and NFAT4 (<b>b</b>) was solely localized in the cytoplasm. Translocation of NFAT3 (<b>a</b>) and NFAT4 (<b>b</b>) after THC, LPI, ionomycin (Io), and thapsigargin (Thap) administration was not detectable in <span class="html-italic">GBM #4</span> and <span class="html-italic">GBM #10</span>. Cell nuclei were counterstained with DAPI. Scale bar = 25 µm.</p> Full article ">Figure 10
<p>Influence of ionomycin on the subcellular localization of NFAT1 after 30 min in the presence of THC and LPI. THC and LPI had no effect on the subcellular localization of NFAT1 in <span class="html-italic">GBM #4</span> and <span class="html-italic">GBM #10</span>. Ionomycin (Io) induced a marked translocation of NFAT1 into the nucleus after 30 min. In the presence of THC or LPI, ionomycin’s effects remained unchanged. Cell nuclei were counterstained with DAPI. Scale bar = 25 µm.</p> Full article ">
Full article ">Figure 1
<p>Effect of PHEC-66 on the viability of cultured skin cells. PHEC-66 ranged between (1.56 and 25 µg/mL) and was added to the cells for 48 h. Data represent the mean values ± standard deviation of three independent experiments performed in triplicate. GraphPad Prism was used to produce the dose–response curve and IC<sub>50</sub> doses.</p> Full article ">Figure 2
<p>PHEC-66 and CBD reduces the formation of melanoma cell colonies. A representative image of MM96L cell colonies formed post-PHEC-66 and CBD treatment (<b>A</b>). The effect of PHEC-66 and CBD on the colonies formed by (<b>B</b>) MM418-C1, (<b>C</b>) MM329, and (<b>D</b>) MM96L cells following exposure to PHEC-66 and CBD. PHEC-66 concentrations added to each cell line were 50%, 100%, and 200% of the respective IC<sub>50</sub> values, while CBD was equivalent to that present within PHEC-66 at its IC<sub>50</sub> value. Asterisks represent statistically significant differences between PHEC-66 or CBD-treated cells compared to the control group (** <span class="html-italic">p</span> = 0.005, **** <span class="html-italic">p</span> ≤ 0.0001). Hash represents statistically significant differences between CBD-treated cells compared to PHEC-66 treated cells (#### <span class="html-italic">p</span> ≤ 0.0001). All data represent the mean ± SEM of three independent experiments.</p> Full article ">Figure 3
<p>PHEC-66 and CBD reduces the motility of melanoma cells. A representative image of MM418-C1 gap closure over 48 h following PHEC-66 and CBD treatment (<b>A</b>). The effect of PHEC-66 (50% and 100% of their respective IC<sub>50</sub> values) and CBD (equivalent to the amount present in 100% PHEC-66) treatment for 48 h on the migration of MM418-C1 (<b>B</b>), MM329 (<b>C</b>), and (<b>D</b>) MM96L cell lines (<b>D</b>). Error bars indicate ± SEM (<span class="html-italic">n</span> = 3). Asterisks indicate statistically significant differences between CBD-treated cells and PHEC-66 treated cells (* <span class="html-italic">p</span> = 0.05, ** <span class="html-italic">p</span> = 0.01, **** <span class="html-italic">p</span> < 0.0001 one-way ANOVA with Tukey’s multiple comparisons test). (Scale bar = 100 µm).</p> Full article ">Figure 4
<p>Effect of PHEC-66 on the morphology of MM418-C1, MM329, and MM96L melanoma cells. The cells were treated with the PHEC-66 at their respective IC<sub>50</sub> concentrations for 48 h and then examined under TEM. Solid-line arrow: chromatin condensation, dotted-line arrow: cell membrane blebbing, NU: nucleus, NM: nuclear membrane, Cr: chromatin condensation, PM: plasma membrane. (<b>A</b>) MM329 control cells, (<b>B</b>) PHEC-66-treated MM329 cells, (<b>C</b>) MM418-C1 control cells, (<b>D</b>) PHEC-66-treated MM418-C1 cells, (<b>E</b>) MM96L control cells, (<b>F</b>) PHEC-66-treated MM96L cells (Scale bar = 2 µm).</p> Full article ">Figure 5
<p>PHEC-66 and CBD treatment reduces the surface area of melanoma cell spheroids. A representative image of the effect of 48 h PHEC-66 and CBD treatment on MM96L spheroids (<b>A</b>). The top panel is of the spheroids at 0 h, and the bottom panel is after 48 h treatment. The spheroids were exposed to PHEC-66 and CBD for 48 h and changes in their surface area can be seen in MM418-C1 (<b>B</b>), MM329 (<b>C</b>), and MM96L cells (<b>D</b>). Asterisks indicate statistically significant differences between untreated spheroids and PHEC-66-treated spheroids (** <span class="html-italic">p</span> = 0.01, *** <span class="html-italic">p</span> = 0.001, **** <span class="html-italic">p</span> < 0.0001 one-way ANOVA with Tukey’s multiple comparisons test). The results expressed are the mean ± SEM (<span class="html-italic">n</span> = 3) (Scale bar = 900 μm).</p> Full article ">Figure 5 Cont.
<p>PHEC-66 and CBD treatment reduces the surface area of melanoma cell spheroids. A representative image of the effect of 48 h PHEC-66 and CBD treatment on MM96L spheroids (<b>A</b>). The top panel is of the spheroids at 0 h, and the bottom panel is after 48 h treatment. The spheroids were exposed to PHEC-66 and CBD for 48 h and changes in their surface area can be seen in MM418-C1 (<b>B</b>), MM329 (<b>C</b>), and MM96L cells (<b>D</b>). Asterisks indicate statistically significant differences between untreated spheroids and PHEC-66-treated spheroids (** <span class="html-italic">p</span> = 0.01, *** <span class="html-italic">p</span> = 0.001, **** <span class="html-italic">p</span> < 0.0001 one-way ANOVA with Tukey’s multiple comparisons test). The results expressed are the mean ± SEM (<span class="html-italic">n</span> = 3) (Scale bar = 900 μm).</p> Full article ">Figure 6
<p>PHEC-66 elicits a greater cytotoxicity to cells grown in 2D monolayers vs. 3D spheroids. PHEC-66 was added to 2D and 3D cultures of MM418-C1 (<b>A</b>,<b>B</b>) MM329 (<b>B</b>), and MM96L cells (<b>C</b>) for 48 h. Error bars indicate ± SEM (<span class="html-italic">n</span> = 3). Asterisks indicate statistically significant differences between 2D- and 3D-treated cells with PHEC-66 treated cells (* <span class="html-italic">p</span> < 0.05, ** <span class="html-italic">p</span> < 0.005, *** <span class="html-italic">p</span> = 0.001, **** <span class="html-italic">p</span> < 0.0001 one-way ANOVA with Tukey’s multiple comparisons test).</p> Full article ">
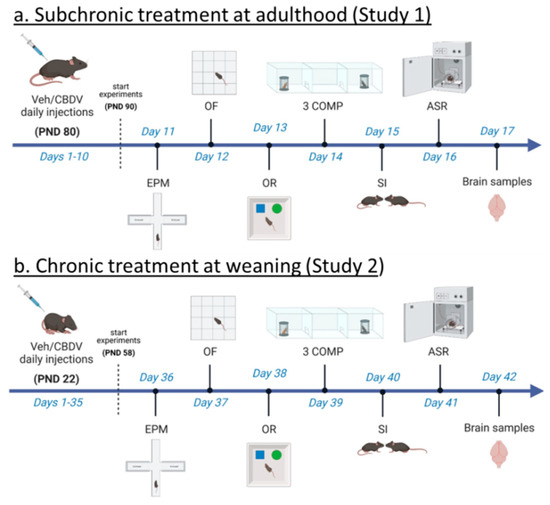
<p>Experimental timeline and procedures used in Study 1 and Study 2. For Study 1 (<b>a</b>), treatment administration started at adulthood (i.e., approximately 3 months of age) and 10 days before the beginning of behavioral testing. Daily intraperitoneal injections of vehicle (Veh) or cannabidivarin (CBDV) solutions (20 or 100 mg/kg) were given during the entire experimental period, including the days of behavioral testing and brain sampling (one hour before their beginning). For Study 2 (<b>b</b>), daily intraperitoneal injections started the day after weaning (i.e., at 3 weeks of age) and 5 weeks before the beginning of behavioral tests. Injections were continued during the entire experimental period, including the days of behavioral testing during which they were administered after completion of each testing procedure. EPM = elevated plus maze, OF = open field, OR = object recognition, 3 COMP = three-compartment test, SI = social interaction, ASR = acoustic startle response. PND = post-natal day.</p> Full article ">Figure 2
<p>Effects of adult subchronic CBDV administration on object recognition memory (Study 1). Locomotor activity (<b>a</b>) and anxiety-like behavior (<b>b</b>) were measured during the 20 min habituation session in the empty open field. The time spent exploring both objects (<b>c</b>) and the novel object recognition index (<b>d</b>) were computed during the 5 min sample and test phases, respectively. All behavioral parameters were measured in WT and <span class="html-italic">Fmr1</span>-KO mice treated with vehicle solution, CBDV at the dose of 20 mg/kg (CBDV-20) or 100 mg/kg (CBDV-100). Data are expressed as mean ± SEM. Numbers in histograms indicate sample size for each group. * <span class="html-italic">p</span> < 0.05; § versus chance level (50%, red dotted line).</p> Full article ">Figure 3
<p>Effects of adult subchronic CBDV administration on sociability and social novelty preference in the three-compartment paradigm (Study 1). Locomotion (<b>a</b>,<b>c</b>,<b>e</b>), percent sociability (<b>b</b>,<b>d</b>) and social novelty recognition (<b>f</b>) scores are shown for each of the three 5 min trials of the test. These included a first trial of habituation to the apparatus containing the empty stimulus cages (<b>a</b>,<b>b</b>), a second trial of sociability (<b>c</b>,<b>d</b>) aimed at assessing the percent preference for a social versus non-social novel stimulus (juvenile male mouse versus inanimate object) and a third trial of social novelty preference (<b>e</b>,<b>f</b>) assessing the percent preference for a novel versus familiar stimulus mouse. Data are expressed as mean ± SEM. Numbers in histograms indicate sample size for each group. § versus chance level (50%, red dotted line).</p> Full article ">Figure 4
<p>Effects of subchronic adult CBDV treatment on social interaction and acoustic startle response (Study 1). Time spent performing direct affiliative behaviors (including sniffing and contact) towards an unfamiliar adult NMRI female mouse was assessed during the first and second 3 min time bins of a 6 min interaction session (<b>a</b>). Body startle (ln-transformed to meet the normality assumptions of parametric ANOVA) was measured in response to acoustic stimuli of 6, 12, 18 and 24 dB over a background of 66 dB (<b>b</b>). Data are expressed as mean ± SEM. Numbers in histograms indicate sample size for each group. * <span class="html-italic">p</span> < 0.05 from post hoc comparisons following a significant interaction (<b>a</b>) or from separate ANOVAs in each treated group (<b>b</b>).</p> Full article ">Figure 5
<p>Effects of juvenile chronic CBDV administration on object recognition memory (Study 2). Locomotor activity (<b>a</b>) and anxiety-like behavior (<b>b</b>) were measured during the 20 min habituation session in the empty open field. The time spent exploring both objects (<b>c</b>) and the novel object recognition index (<b>d</b>) were computed during the 5 min sample and test phases, respectively. All behavioral parameters were measured in WT and <span class="html-italic">Fmr1</span>-KO mice treated with vehicle solution, CBDV at the dose of 20 mg/kg (CBDV-20) or 100 mg/kg (CBDV-100). Data are expressed as mean ± SEM. Numbers in histograms indicate sample size for each group. * <span class="html-italic">p</span> < 0.05; § versus chance level (50%, red dotted line).</p> Full article ">Figure 6
<p>Effects of juvenile chronic CBDV administration on sociability and social novelty preference in the three-compartment paradigm (Study 2). Locomotion (<b>a</b>,<b>c</b>,<b>e</b>), percent sociability (<b>b</b>,<b>d</b>) and social novelty recognition (<b>f</b>) scores are shown for each of the three 5 min trials of the test. These included a first trial of habituation to the apparatus containing the empty stimulus cages (<b>a</b>,<b>b</b>), a second trial of sociability (<b>c</b>,<b>d</b>) aimed at assessing the percent preference for a social versus non-social novel stimulus (juvenile male mouse versus inanimate object) and a third trial of social novelty preference (<b>e</b>,<b>f</b>) assessing the percent preference for a novel versus familiar stimulus mouse. Data are expressed as mean ± SEM. Numbers in histograms indicate sample size for each group. § versus chance level (50%, red dotted line).</p> Full article ">Figure 7
<p>Effects of juvenile chronic CBDV treatment on social interaction and acoustic startle response (Study 2). Time spent performing direct affiliative behaviors (including sniffing and contact) towards an unfamiliar adult NMRI female mouse was assessed during the first and second 3 min time bins of a 6 min interaction session (<b>a</b>). Body startle (ln-transformed to meet the normality assumptions of parametric ANOVA) was measured in response to acoustic stimuli of 6, 12, 18 and 24 dB over a background of 66 dB (<b>b</b>). Data are expressed as mean ± SEM. Numbers in histograms indicate sample size for each group. * <span class="html-italic">p</span> < 0.05 from post hoc comparisons following a significant interaction (<b>a</b>) or from separate ANOVAs in each treated group (<b>b</b>).</p> Full article ">
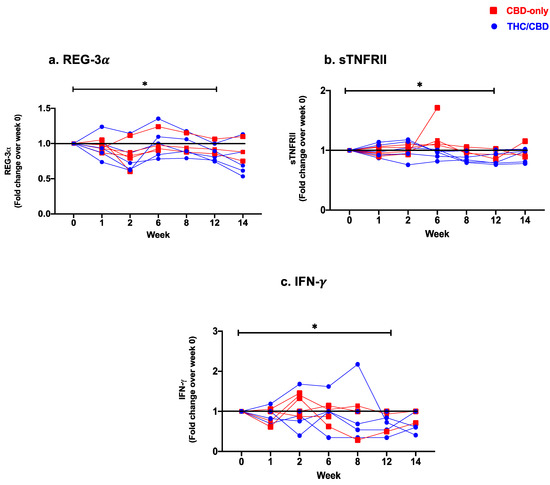
<p>Fold change expression over 12 weeks versus weeks 0 of CBD-only (red square) and THC/CBD combination (blue circle), (<b>a</b>) Regenerating islet derived protein 3 alpha (REG-3α), (<b>b</b>) Soluble receptor for tumor necrosis factor type II (sTNFRII), and (<b>c</b>) Interferon-gamma (IFN-γ). * <span class="html-italic">p</span> < 0.05.</p> Full article ">Figure 2
<p>Fold change expression over 12 weeks versus weeks 0 of CBD-only (red square) and THC/CBD combination (blue circle), (<b>a</b>) Ki-67+ memory CD4 T-cells, (<b>b</b>) CCR2+ non-classical monocytes, and (<b>c</b>) Myeloid dendritic cells. * <span class="html-italic">p</span> < 0.05.</p> Full article ">
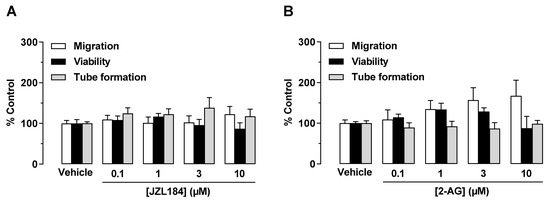
<p>Direct effect of JZL184 (<b>A</b>) and 2-AG (<b>B</b>) on migration, viability, and tube formation of HUVECs. Migration (Boyden chamber assays, white bars), viability (WST-1 assay, black bars), and tube formation (tube formation assays, gray bars) of HUVECs after incubation with JZL184 (<b>A</b>) or 2-AG (<b>B</b>). The incubation time of HUVECs was 24 h for the migration and viability assay and 2 h for the tube formation assay. All percentage values given refer to the respective vehicle control set to 100%. Data represent mean ± SEM of <span class="html-italic">n</span> = 6 per group. Statistically significant differences between vehicle- and test substance-treated groups were excluded using one-way ANOVA with Dunnett post hoc test.</p> Full article ">Figure 2
<p>Effects of conditioned medium (CM) obtained from A549 cells treated with MAGL inhibitor JZL184 (<b>A</b>), MAGL substrate 2-AG (<b>B</b>), additional MAGL inhibitors JW651 (<b>C</b>) and MJN110 (<b>D</b>), or DAGL inhibitor RHC 80267 (<b>E</b>) on migration, viability, and tube formation of HUVECs. Migration (Boyden chamber assay, white bars), viability (WST-1 assay, black bars), and tube formation (tube formation assays, gray bars) of HUVECs were determined after incubation with CM from A549 cells for 24 h (migration and viability assay) or 2 h (tube formation analysis). The CMs used were from A549 cells previously incubated for 48 h with vehicle (Veh) or the indicated concentrations of the test compounds. All percentage values given refer to serum-free DMEM (unconditioned medium, UCM) set to 100%. Data represent mean ± SEM of <span class="html-italic">n</span> = 6 ((<b>A</b>,<b>B</b>,<b>E</b>), migration and tube formation), <span class="html-italic">n</span> = 3–4 (<b>C</b>,<b>D</b>), or <span class="html-italic">n</span> = 8 ((<b>E</b>), viability) per group. ** <span class="html-italic">p</span> ≤ 0.01, *** <span class="html-italic">p</span> ≤ 0.001 vs. UCM; # <span class="html-italic">p</span> ≤ 0.05, ## <span class="html-italic">p</span> ≤ 0.01, ### <span class="html-italic">p</span> ≤ 0.001 vs. CM of vehicle-treated A549 cells; one-way ANOVA with Bonferroni post hoc test.</p> Full article ">Figure 3
<p>Evaluation of the role of the endocannabinoid system in the antiangiogenic effect of JZL184 (<b>A</b>) and 2-AG (<b>B</b>) on HUVECs by testing the effect of AM-251 (CB<sub>1</sub> antagonist), AM-630 (CB<sub>2</sub> antagonist), and capsazepine (Capsa, TRPV1 antagonist) on the antiangiogenic effect of CM from A549 cells treated with 1 µM JZL184 (<b>A</b>) or 2-AG (<b>B</b>). A549 cells were pre-incubated with the respective receptor antagonist (all tested at a final concentration of 1 µM) for 1 h and then incubated with vehicle, JZL184, or 2-AG for 48 h before CM was collected. Migration (Boyden chamber assay, white bars), viability (WST-1 assay, black bars), and tube formation (tube formation assays, gray bars) of HUVECs were determined after incubation with CM from A549 cells for 24 h (migration and viability assay) or 2 h (tube formation analysis). The control experiment shown in (<b>C</b>) demonstrates the effect of CM of A549 cells previously incubated with AM-251, AM-630, and capsazepine alone for 48 h on HUVEC migration, viability, and tube formation. In the experiment shown in (<b>D</b>), modulation of angiogenic properties by CM of A549 cells previously treated for 48 h with vehicle, JZL184 (1 µM), palmitic acid (PA, 10 µM), or the combination of JZL184 (1 µM) and PA (10 µM) was determined. PA was used to supplement potentially reduced free fatty acids due to MAGL inhibition. All percentage values given refer to HUVECs suspended in vehicle-containing CM set to 100%. Data represent mean ± SEM of <span class="html-italic">n</span> = 9 (<b>A</b>), <span class="html-italic">n</span> = 3 ((<b>B</b>,<b>D</b>), tube formation), <span class="html-italic">n</span> = 6 ((<b>C</b>), migration, tube formation; (<b>D</b>), migration), <span class="html-italic">n</span> = 7 ((<b>C</b>), viability), or <span class="html-italic">n</span> = 4 ((<b>D</b>), viability) per group. * <span class="html-italic">p</span> ≤ 0.05, *** <span class="html-italic">p</span> ≤ 0.001 vs. CM of vehicle-treated A549 cells; # <span class="html-italic">p</span> ≤ 0.05, ## <span class="html-italic">p</span> ≤ 0.01, ### <span class="html-italic">p</span> ≤ 0.001 vs. CM of JZL184- or 2-AG-treated A549 cells; one-way ANOVA with Bonferroni (<b>A</b>,<b>B</b>,<b>D</b>) or Dunnett (<b>C</b>) post hoc test.</p> Full article ">Figure 4
<p>Effect of JZL184 (<b>A</b>,<b>B</b>) and 2-AG (<b>C</b>,<b>D</b>) on TIMP-1 protein expression in A549 cells and angiogenic abilities of HUVECs suspended in conditioned medium (CM) of vehicle- or JZL184-treated A549 cells in the presence or absence of TIMP-1 siRNA. In (<b>A</b>,<b>C</b>), the concentration-dependent effects of JZL184 (<b>A</b>) and 2-AG (<b>C</b>) on TIMP-1 protein expression are shown. A549 cells were incubated with vehicle and the respective concentration of JZL184 or 2-AG for 48 h followed by Western blot analysis. All percentage values given refer to vehicle-treated cells set to 100%. Data (<b>A</b>,<b>C</b>) represent mean ± SEM obtained from densitometric analysis of <span class="html-italic">n</span> = 4 experiments per group. In (<b>B</b>,<b>D</b>), A549 cells were incubated with transfection reagent in the absence of any siRNA (first and second triplets or bands) and transfected with TIMP-1 siRNA (TIMP-1 si; third and fourth triplets or bands) or non-silencing siRNA (nonsi; fifth and sixth triplet or bands) for 24 h in 10% FCS containing DMEM. Thereafter, A549 cells were washed and treated with vehicle, 1 μM JZL184 (<b>C</b>), or 1 µM 2-AG (<b>D</b>) for 48 h in serum-free DMEM prior to collection of CM. Migration (Boyden chamber assay, white bars), viability (WST-1 test, black bars), and tube formation (tube formation assays, gray bars) of HUVECs was measured after suspension in CM from A549-treated cells. The incubation time of HUVECs was 24 h for migration and viability testing and 2 h for tube formation analysis. Monitoring of TIMP-1 protein was performed in parallel using CM obtained from A549 cells. The Western blot images shown here are representative of a total of three (<b>B</b>) or four (<b>D</b>) experiments performed. For analysis of angiogenesis data in (<b>B</b>,<b>D</b>), vehicle-containing CM was set at 100%. Data represent mean ± SEM of <span class="html-italic">n</span> = 3 ((<b>B</b>), migration, tube formation; (<b>D</b>)) or <span class="html-italic">n</span> = 4 ((<b>B</b>), viability) per group. ** <span class="html-italic">p</span> ≤ 0.01, *** <span class="html-italic">p</span> ≤ 0.001 vs. corresponding vehicle control; ## <span class="html-italic">p</span> ≤ 0.01, ### <span class="html-italic">p</span> ≤ 0.001 vs. the respective JZL184 (<b>B</b>) or 2-AG (<b>D</b>) group without siRNA; one-way ANOVA with Dunnett (<b>A</b>,<b>C</b>) or Bonferroni (<b>B</b>,<b>D</b>) post hoc test.</p> Full article ">Figure 5
<p>Effect of conditioned medium (CM) derived from another lung cancer cell line (H358) and from a non-cancerous bronchial epithelial cell line (BEAS-2B) on the angiogenic capacities of HUVECs. Migration (Boyden chamber assay, white bars), viability (WST-1 assay, black bars), and tube formation (tube formation assays, gray bars) of HUVECs were determined after suspension in CM from vehicle-, JZL184-, and 2-AG-treated H358 (<b>A</b>,<b>B</b>) or BEAS-2B cells (<b>C</b>,<b>D</b>). To generate CM, H358 or BEAS-2B cells were incubated for 48 h with vehicle (Veh) or the indicated concentrations of test compounds. The exposure time of HUVECs to the indicated CM was 24 h for the migration and viability assay and 2 h for tube formation analysis. Vehicle-containing UCM was set at 100%. Data represent mean ± SEM of <span class="html-italic">n</span> = 3 ((<b>A</b>–<b>D</b>), tube formation; (<b>A</b>–<b>C</b>), migration; (<b>A</b>), viability), <span class="html-italic">n</span> = 4 ((<b>D</b>), migration), <span class="html-italic">n</span> = 5 ((<b>B</b>), viability), or <span class="html-italic">n</span> = 6 ((<b>C</b>), viability) per group. * <span class="html-italic">p</span> ≤ 0.05, ** <span class="html-italic">p</span> ≤ 0.01, *** <span class="html-italic">p</span> ≤ 0.001 vs. UCM; # <span class="html-italic">p</span> ≤ 0.05, ## <span class="html-italic">p</span> ≤ 0.01, ### <span class="html-italic">p</span> ≤ 0.001 vs. CM of vehicle-treated A549 cells; one-way ANOVA with Bonferroni post hoc test.</p> Full article ">Figure 6
<p>Angiogenic capabilities of HUVECs suspended in conditioned medium (CM) from vehicle- or JZL184-treated H358 cells in the presence or absence of TIMP-1 siRNA. H358 cells were incubated with transfection reagent in the absence of any siRNA (first and second triplets or bands) and transfected with TIMP-1 siRNA (TIMP-1 si; third and fourth triplets or bands) or non-silencing siRNA (nonsi, fifth and sixth triplet or bands) for 24 h in 10% FCS containing DMEM. Thereafter, H358 cells were washed and treated with vehicle, 1 μM JZL184 (<b>A</b>), or 1 µM 2-AG (<b>B</b>) for 48 h in serum-free DMEM prior to collection of CM. Migration (Boyden chamber assay, white bars), viability (WST-1 test, black bars), and tube formation (tube formation assays, gray bars) of HUVECs was measured after suspension in CM from H358-treated cells. The incubation time of HUVECs was 24 h for migration and viability testing and 2 h for tube formation analysis. Monitoring of TIMP-1 protein was performed in parallel using CM from H358 cells. The Western blot images shown here are representative of a total of four experiments performed in each case. For analysis of angiogenesis data, vehicle-containing CM was set at 100%. Data represent mean ± SEM of <span class="html-italic">n</span> = 6 ((<b>A</b>), migration; (<b>B</b>), migration), <span class="html-italic">n</span> = 3 ((<b>A</b>), viability, tube formation; (<b>B</b>), tube formation), or <span class="html-italic">n</span> = 4 ((<b>B</b>), viability) per group. * <span class="html-italic">p</span> ≤ 0.05, ** <span class="html-italic">p</span> ≤ 0.01, *** <span class="html-italic">p</span> ≤ 0.001 vs. corresponding vehicle control; ## <span class="html-italic">p</span> ≤ 0.01, ### <span class="html-italic">p</span> ≤ 0.001 vs. the respective JZL184 or 2-AG group without siRNA; one-way ANOVA with Bonferroni post hoc test.</p> Full article ">Figure 7
<p>Impact of MAGL inhibitor JZL184 on the growth of A549 xenografts from nude mice as well as on the number of CD31- (angiogenesis and vascularization marker) and TIMP-1-positive cells in xenografts. Tumors were generated by subcutaneous inoculation of 1 × 10<sup>7</sup> A549 cells into the right dorsal flank. Animals were treated with either vehicle or JZL184 (4, 8, or 16 mg/kg i.p.) every 72 h for 28 days. Tumor size was measured with an external caliper and calculated as described in Materials and Methods and are shown as tumor volumes over time in panel <b>A</b>. The images beside the time-course were taken from representative tumors on day 28. Quantification of CD31 (<b>B</b>) and TIMP-1 (<b>C</b>) was performed by counting the positively stained cells of xenograft-derived paraffine sections stained with the indicated antibodies and calculating the percentage relative to the total number of cells per field of view. Values are means ± SEM of <span class="html-italic">n</span> = 7–8 (<b>A</b>), <span class="html-italic">n</span> = 4 (<b>B</b>), or <span class="html-italic">n</span> = 5 (<b>C</b>) animals per group. * <span class="html-italic">p</span> ≤ 0.05, ** <span class="html-italic">p</span> ≤ 0.01, *** <span class="html-italic">p</span> ≤ 0.001 vs. vehicle; one-way ANOVA with Dunnett post hoc test.</p> Full article ">
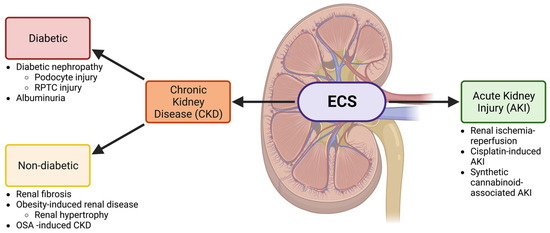
<p>The ECS is involved in both CKD and AKI. A schematic showing the involvement of the ECS in the kidney and the relationship between the nephropathies that will be discussed in this review. Both acute kidney injury (AKI) and chronic kidney disease (CKD) will be investigated. CKD is further divided into diabetic and non-diabetic chronic kidney disease and is associated with several conditions discussed throughout this review. Other abbreviations: renal proximal tubular cell (RPTC) and obstructive sleep apnea (OSA). Created with BioRender.com.</p> Full article ">Figure 2
<p>CB1 in the human body. Diagram highlighting the body systems in which CB1 is located and active within the human body. Organs and systems in which CB1 has been studied include the CNS, heart, blood vessels, skeletal muscle, gastrointestinal, liver, pancreas, adipose tissue, renal, and reproductive systems. Created with BioRender.com.</p> Full article ">Figure 3
<p>CB1 expression in the human nephron. CB1 is expressed within the glomerulus, efferent and afferent arterioles, proximal and distal convoluted tubules, the thick ascending limb, and the collecting duct. CB1 expression is indicated by purple hue. Created with BioRender.com.</p> Full article ">Figure 4
<p>Diagram of CB1 ligands and their degradative enzymes in the kidney. The endocannabinoids, AEA and 2-AG are found in varying levels within the renal cortex and renal medulla. Their degradative enzymes are found in an opposing relative amount within the cortex and medulla as well. Created with BioRender.com.</p> Full article ">Figure 5
<p>CB1 activity and involvement in cellular pathways. Simplified diagram of cannabinoid receptor 1 (CB1) and some of the cellular pathways in which it plays a role. CB1 is a G-protein coupled receptor that inhibits the activity of adenylyl cyclase and the subsequent cyclic AMP (cAMP) cascade, and it regulates both the mitogen-activated protein kinase (MAPK) and phosphoinositide 3-kinase/protein kinase B (PI3K/AKT) pathways. All three pathways play a role in cell fate and survival. Created with BioRender.com.</p> Full article ">Figure 6
<p>CB1 activity and associations in DKD. Endocannabinoid activity plays roles in podocytes and renal proximal tubule cell (RPTC) physiology. Created with BioRender.com.</p> Full article ">Figure 7
<p>The ECS and associations in NDCKD. Kidney diseases including renal fibrosis, obesity-induced CKD, and obstructive sleep apnea (OSA)-induced CKD are associated with activity alterations in the ECS. Created with BioRender.com.</p> Full article ">
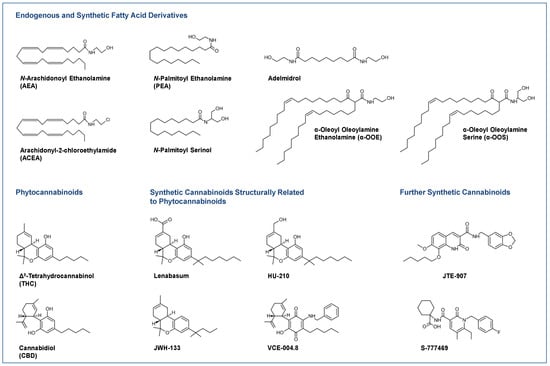
<p>Selected endocannabinoids and phytocannabinoids and their derivatives currently under investigation or in use for the treatment of skin diseases.</p> Full article ">Figure 2
<p>Distribution of the elements of the endocannabinoid system in the skin and their functional effects. In the text boxes, the regulations proven in the literature have been indicated. The term <span class="html-italic">deficiency</span> always refers to the fact that results from experiments with knockout animals are included here. ↑, upregulated; ↓, downregulated; AEA, <span class="html-italic">N</span>-arachidonoyl ethanolamine (anandamide); 2-AG, 2-arachidonoyl glycerol; CB<sub>1</sub>, cannabinoid receptor 1; CB<sub>2</sub>, cannabinoid receptor 2; DAGL, diacylglycerol lipase; DNFB, 1-fluoro-2,4-dinitrobenzene; Elovl 3, 5 and 6, elongation of very-long-chain fatty acids-like group of enzymes; GPR, G protein-coupled receptor; FAAH, fatty acid amide hydrolase; IL, interleukin; iNOS, inducible nitric oxide synthase; MAGL, monoacylglycerol lipase; MAPK, mitogen-activated protein kinases; MCP, monocyte chemoattractant protein; MITF, microphthalmus-associated transcription factor; mTOR, mammalian target of rapamycin; NAPE-PLD, <span class="html-italic">N</span>-acylphosphatidylethanolamine-hydrolysing phospholipase D; NF-κB, nuclear factor ‘kappa-light-chain-enhancer’ of activated B-cells; NRIP1, nuclear receptor interacting protein-1; PEX16, peroxin 16; PPAR, peroxisome proliferator-activated receptor; SDF-1, stromal cell-derived factor-1; Smad, small mothers against decapentaplegic homolog; TGF-β, transforming growth factor-β; TNF-α, tumour necrosis factor-α; TRIB3, tribbles homolog 3; TRP, tyrosinase-related protein; TRPV, transient receptor potential vanilloid; UVB, ultraviolet B radiation; VEGF, vascular endothelial growth factor.</p> Full article ">
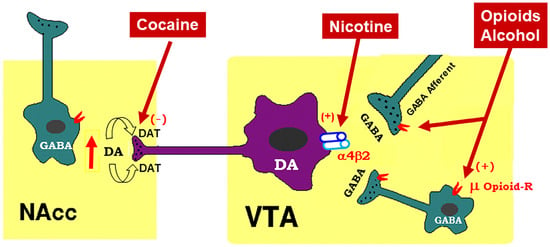
<p>Schematic diagram of the mesolimbic dopamine (DA) hypothesis, illustrating how drugs of abuse activate this system. The mesolimbic DA system originates in the midbrain ventral tegmental area (VTA) and projects predominantly to the forebrain nucleus accumbens (NAc) and the prefrontal cortex (not shown). The psychostimulant cocaine elevates extracellular NAc DA by blocking DA transporters (DAT) on DA axon terminals, while opioids (such as heroin) and alcohol bind to and activate mu opioid receptor (μ Opioid–R) located mainly on GABAergic afferents (less on VTA GABAergic interneurons) and inhibit GABA release. A reduction in GABA release leads to DA neuron disinhibition (activation). Nicotine has been thought to activate DA neurons mainly by activation of α4β2 nicotinic receptors located on DA neurons. (+), (-): indicate activation of opiate receptors or blockade of DAT.</p> Full article ">Figure 2
<p>A schematic diagram showing the neural mechanisms underlying cannabis reward <span class="html-italic">versus</span> aversion. Cannabinoid CB1Rs are expressed not only in VTA GABAergic interneurons or GABAergic afferents but also in VTA glutamatergic neurons or their afferents within the VTA, whereas CB2Rs are also expressed in VTA DA neurons. Both CB1Rs and CB2Rs are inhibitory G-protein (Gi)-coupled receptors, producing an inhibitory effect on neuronal firing or terminal neurotransmitter release after activation. Cannabinoids such as Δ<sup>9</sup>-THC, 2-AG, and AEA may produce rewarding effects by binding to CB1Rs on VTA GABAergic interneurons and/or their afferents as a reduction in GABA release causes an increase DA neuronal firing and enhanced DA release in the NAc. Conversely, cannabinoids may also produce aversive effects by activating CB1Rs on glutamatergic neurons and/or terminals in the VTA that decreases excitatory glutamate input on VTA DA neurons. In addition, activation of CB2Rs on VTA DA neurons also produce an inhibitory effect on DA neuron firing and DA release in the NAc. Thus, the subjective effects of cannabinoids may depend on the balance of both oppose actions. This hypothesis may well explain why cannabinoids are rewarding in some subjects or species, while ineffective or even aversive in others. ↑, ↓—indicate an increase or a decrease in neurotransmitter release.</p> Full article ">Figure 3
<p>Concepts of neutral antagonist vs. inverse agonist. A <b>full agonist</b> (such as WIN55,212-2 or CP55,940) binds to and activates a receptor, producing maximal (100%) biological effects. A <b>partial agonist</b> (such as Δ<sup>9</sup>-THC) produces an effect that is less than a full agonist. An <b>inverse agonist</b> (such as rimonabant in the absence of CB1 receptor agonist) binds to the same receptor as an agonist but produces a biological effect opposite to that of an agonist. A <b>neutral antagonist</b> (such as AM4113 or PIMSR) binds to a receptor and blocks agonist binding to the same receptor, while itself does not produce any effect in the absence of an agonist. At basal conditions, a receptor has intrinsic activity or is under a balance between active and inactive states in the absence of endogenous ligands. An agonist increases the activity of a receptor above its basal level, whereas an inverse agonist decreases the activity below the basal level.</p> Full article ">Figure 4
<p>A schematic diagram of an endocannabinoid (eCB) hypothesis showing how a CB1R antagonist blocks actions produced by drugs of abuse. Growing evidence indicates that drugs of abuse (such as cocaine, opioid or nicotine) may stimulate endocannabinoid (such as 2-AG, AEA) release from postsynaptic neurons (such as VTA DA neurons), which subsequently activates CB1R on presynaptic CB1Rs and produces a reduction in GABA or glutamate release. A CB1R antagonist, including neutral antagonist, binds to CB1R and blocks eCB binding to the same receptor, therefore producing antagonism of drug reward and relapse. ↑: indicates an increase in eCB release; “×” indicates blockade of CB1 receptor.</p> Full article ">Figure 5
<p>Schematic diagrams of a working hypothesis showing how a CB1R agonist and an inverse agonist produce opposite subjective effects. (<b>A</b>): A CB1R agonist such as Δ<sup>9</sup>-THC may produce rewarding effects by decreasing VTA GABA release and increasing NAc DA release. (<b>B</b>): In contrast, an inverse CB1R agonist may produce an opposite aversive effect by increasing GABA release and decreasing DA release in the NAc. ↑, ↓: indicate an increase or a decrease in neurotransmitter release.</p> Full article ">
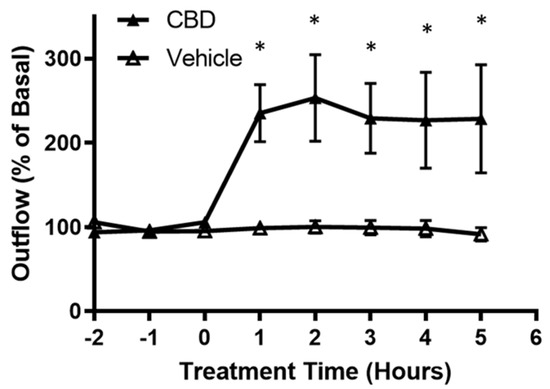
<p>Effects of cannabidiol on aqueous humor outflow. Application of 1 µM CBD caused a significant increase in aqueous humor outflow lasting from 1 h to 5 h. Basal outflow is defined as the average outflow of the three time points prior to CBD administration. Results are expressed as mean ± SEM; <span class="html-italic">n</span> = 10. * Significant differences between 1 µM CBD and vehicle (DMEM + 0.001% ethanol) determined by <span class="html-italic">t</span>-test, <span class="html-italic">p</span> < 0.05.</p> Full article ">Figure 2
<p>Effect of cannabidiol on collagen gel contraction mediated by trabecular meshwork cells. Cells grown embedded in collagen gels were treated with DMEM or DMEM containing 1 µM CBD for 48 h. Top: Representative photographs of collagen gel cultures of TM cells incubated for 48 h with the indicated drug treatment. Bottom: The mean ± SEM of results of five experiments are shown. Treatment with CBD significantly opposed the basal level of gel contraction. * Significant difference from vehicle determined by <span class="html-italic">t</span>-test, <span class="html-italic">p</span> < 0.05.</p> Full article ">Figure 3
<p>Inhibition of phosphorylation of myosin light chain protein by cannabidiol in trabecular meshwork cells. (<b>A</b>): Western blot representative of results obtained in three experiments. Cells were serum starved overnight and treated with vehicle or 1 µM CBD for 2 h, then phosphorylation of myosin light chain (MLC) was measured with anti-GAPDH and anti-phospho-MLC antibodies. (<b>B</b>): densitometry quantification of Western blot data from three experiments. MLC is constitutively phosphorylated in vehicle treated TM; following treatment with CBD, MLC phosphorylation significantly decreased. Results are expressed as mean ± SEM (<span class="html-italic">n</span> = 3). Vehicle treated phosphorylation of MLC levels are normalized to 100%. * Significant difference from vehicle determined by <span class="html-italic">t</span>-test, <span class="html-italic">p</span> < 0.05.</p> Full article ">Figure 4
<p>Effect of cannabidiol on myosin phosphatase targeting subunit 1 (MYPT1) phosphorylation. (<b>A</b>): Western blot representative of phosphorylation of myosin phosphatase targeting subunit 1 (MYPT1) at Thr853 for three experiments is shown. TM cells were serum starved overnight and treated with vehicle or 1 µM CBD for 2 h, then phosphorylation of MYPT1 at Thr853 was assessed. (<b>B</b>): densitometry quantification of phospho-MYPT1 from three experiments is shown. Following treatment with CBD, MYPT1 phosphorylation at Thr853 significantly decreased. Results are expressed as mean ± SEM (<span class="html-italic">n</span> = 3). Vehicle treated phosphorylation of MYPT1 levels are normalized to 100%. * Significant difference from vehicle determined by <span class="html-italic">t</span>-test, <span class="html-italic">p</span> < 0.05.</p> Full article ">Figure 5
<p>The effect of cannabidiol on RhoA activation. (<b>A</b>): representative Western blot of RhoA-GTP and Total RhoA for three experiments is shown. TM cells were serum starved overnight and treated with DMEM or DMEM containing 1 µM CBD for 2 h, then RhoA activation was assessed. (<b>B</b>): densitometry quantification of RhoA activation for three experiments is shown. RhoA-GTP significantly decreased following treatment with CBD compared to the vehicle in TM cells. Results are expressed as mean ± SEM (<span class="html-italic">n</span> = 3). Vehicle treated TM cell RhoA levels are normalized to 100%. * Significant difference from vehicle determined by <span class="html-italic">t</span>-test, <span class="html-italic">p</span> < 0.05.</p> Full article ">
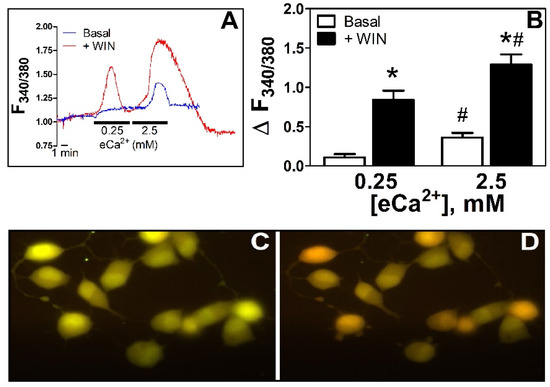
<p><b>WIN55212-2 increases [Ca<sup>2+</sup>]<sub>i</sub>: effect of eCa<sup>2+</sup></b>. (<b>A</b>). Time course of the changes in F<sub>340/380</sub> in N18TG2 cells incubated in 0.25 and 2.5 mM eCa<sup>2+</sup> in basal conditions (blue line) or the presence of WIN55212-2 5 µM (red line). (<b>B</b>). Relative changes in [Ca<sup>2+</sup>]<sub>i</sub> as ΔF<sub>340/380</sub> in basal conditions (Basal, □, <span class="html-italic">n</span> = 6) or in the presence of WIN55212-2 5 µM (+WIN, ■, <span class="html-italic">n</span> = 7). * <span class="html-italic">p</span> < 0.05 vs. basal; # <span class="html-italic">p</span> < 0.05 vs. 0.25 mM eCa<sup>2+</sup>. (<b>C</b>). Fluorescence image from a representative coverslip with N18TG2 cells observed under the imaging system used (see section Imaging in Materials and Methods) in eCa<sup>2+</sup> 0.25 mM. 40× amplification. (<b>D</b>). Same cells as in C after 2 min treatment (approximately at peak response) with WIN55212-2 5 µM in eCa<sup>2+</sup> 0.25 mM, 40x amplification. Changes in pseudo color from green to red represent the increase in emission after excitation at 340 nm and decrease in emission after excitation at 380 nm of Fura-2 upon binding to Ca<sup>2+</sup>, the basis of the ratiometric (F<sub>340/380</sub>) system for determinations of relative changes in [Ca<sup>2+</sup>]<sub>i</sub> [<a href="#B17-cells-11-02947" class="html-bibr">17</a>].</p> Full article ">Figure 2
<p><b>Increases in [Ca<sup>2+</sup>]<sub>i</sub> depend on the CaSR.</b> (<b>A</b>). Effects of the CaSR inhibitor NPS2314 3 µM (+NPS, diagonal stripes upward bars, <span class="html-italic">n</span> = 7) on [Ca<sup>2+</sup>]<sub>i</sub> in basal conditions (open bars, <span class="html-italic">n</span> = 6). (<b>B</b>). Effects of the CaSR inhibitor NPS2314 3 µM (+NPS, diagonal stripes upward bars, <span class="html-italic">n</span> = 7) on [Ca<sup>2+</sup>]<sub>i</sub> in the presence of WIN55212-2 5 µM (black bars, <span class="html-italic">n</span> = 7). * <span class="html-italic">p</span> < 0.05 vs. basal or WIN55212-2 at the corresponding eCa<sup>2+</sup>.</p> Full article ">Figure 3
<p><b>Aminoalkylindole-specific increase in [Ca<sup>2+</sup>]<sub>i</sub> in N18TG2 cells.</b> Increases in [Ca<sup>2+</sup>]<sub>i</sub> in conditions of low (0.25 mM) and high (2.5 mM) eCa<sup>2+</sup> in the presence of WIN55212-2 5µM (+WIN, <span class="html-italic">n</span> = 7), the bicyclic mimetic of THC CP55940 5 µM (+CP, <span class="html-italic">n</span> = 4), or the arachidonoylethanolamine analog meth-anandamide 5 µM (+Me-AEA, <span class="html-italic">n</span> = 5) * <span class="html-italic">p</span> < 0.05 vs. basal; # <span class="html-italic">p</span> < 0.05 vs. WIN55212-2.</p> Full article ">Figure 4
<p><b>WIN55212-2-mediated increase in [Ca<sup>2+</sup>]<sub>i</sub> is dependent on store operated calcium entry.</b> Increases in [Ca<sup>2+</sup>]<sub>i</sub> in low (0.25 mM) and high (2.5 mM) eCa<sup>2+</sup> in basal conditions (Basal, <span class="html-italic">n</span> = 6), in the presence of WIN55212-2 (5 µM, <span class="html-italic">n</span> = 7) (+WIN), and in the presence of WIN55212-2 plus MRS1845 (+WIN + MRS, <span class="html-italic">n</span> = 4 or <span class="html-italic">n</span> = 7) (10 µM). * <span class="html-italic">p</span> < 0.05 vs. +WIN.</p> Full article ">Figure 5
<p><b>WIN55212-2-mediated increase in [Ca<sup>2+</sup>]<sub>i</sub> is dependent on the CB<sub>1</sub> receptor and on nonCB<sub>1</sub>/CB<sub>2</sub> receptors.</b> (<b>A</b>). Time course of the changes in F<sub>340/380</sub> in N18TG2 cells incubated in 0.25 and 2.5 mM eCa<sup>2+</sup> in the presence of WIN55212-2 5 µM (+WIN, red line), SR141716 1 µM (+WIN + SR, green line) and WIN55212-2 plus O-1918 10 µM (+WIN + O-1918, light blue line). (<b>B</b>). Increases in [Ca<sup>2+</sup>]<sub>i</sub> in low (0.25 mM) and high (2.5 mM) eCa<sup>2+</sup> in basal conditions (Basal, open bars, <span class="html-italic">n</span> = 6), in the presence of WIN55212-2 (5 µM) (+WIN, <span class="html-italic">n</span> = 7), in the presence of WIN55212-2 plus SR141716 (1 µM) (+WIN + SR, <span class="html-italic">n</span> = 7), and in the presence of WIN55212-2 plus O-1918 (10 µM) (+WIN + O-1918, <span class="html-italic">n</span> = 5). * <span class="html-italic">p</span> < 0.05 vs. +WIN.</p> Full article ">Figure 6
<p><b>Diagram illustrating potential functional interactions between cannabinoid receptors and CaSR in neuroblastoma cells in different levels of eCa<sup>2+</sup>.</b> The formation of different Gα<sub>q</sub>-PLC-G<sub>i/o</sub> βγ complexes depending on eCa<sup>2+</sup> and cellular proximity of the GPCRs involved is proposed. CB<sub>1</sub>: CB<sub>1</sub> receptor. CBx: putative ‘WIN55212-2’ receptor. CaSR: calcium sensing receptor. SOC: store operated calcium channels.</p> Full article ">
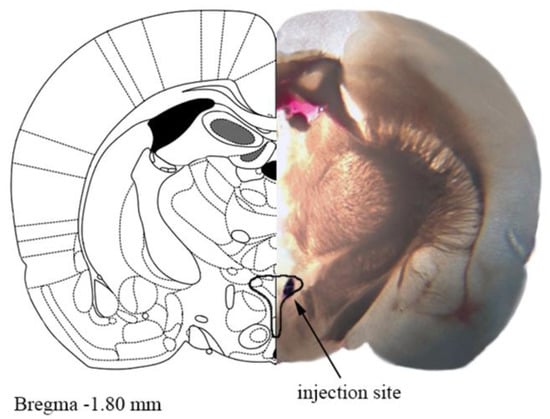
<p>A representative photograph of the microinjection site in the paraventricular nucleus of hypothalamus (PVN) coupled with the matching slide from the Paxinos and Watson rat brain atlas [<a href="#B24-cells-11-01542" class="html-bibr">24</a>]. One mm thick brain slice with the injection site shown by Evans blue dye. The drawn outline represents the confines of PVN.</p> Full article ">Figure 2
<p>Effects of AM251 and A-779 on basal systolic (SBP), diastolic (DBP) and mean (MBP) blood pressure in conscious Wistar Kyoto (WKY) and spontaneously hypertensive rats (SHR). CB<sub>1</sub> receptor antagonist AM251 was injected intravenously (<b>a</b>) or into the paraventricular nucleus of hypothalamus (PVN) (<b>b</b>). Mas receptor antagonist A-779 was injected into the PVN. Results are presented as mean ± SEM (<span class="html-italic">n</span> = 21–27 for A; <span class="html-italic">n</span> = 10 for B; <span class="html-italic">n</span> = 6–7 for (<b>c</b>) and (<b>d</b>). * <span class="html-italic">p</span> < 0.05 compared to WKY; ## <span class="html-italic">p</span> < 0.01, ### <span class="html-italic">p</span> <0.001 compared to A-779 in the absence of AM251.</p> Full article ">Figure 3
<p>Representative original traces of the pressor effects of angiotensin II (<b>a</b>), angiotensin 1–7 (<b>b</b>) and CP55940 (after i.v. administration of AM251) (<b>c</b>) injected into the paraventricular nucleus of hypothalamus (PVN) on blood pressure (BP) and mean blood pressure (MBP) in conscious Wistar Kyoto (WKY) and spontaneously in hypertensive rats (SHR). Arrows show the moment of application of the particular agonist.</p> Full article ">Figure 4
<p>Effect of angiotensin II (AT<sub>1/2</sub> receptor agonist) (<b>a</b>,<b>b</b>) and angiotensin 1–7 (Mas receptor agonist) (<b>c</b>,<b>d</b>) on systolic (SBP), diastolic (DBP) and mean (MBP) blood pressure, and their interaction with AT<sub>1</sub>, AT<sub>2</sub> and Mas receptor antagonists (losartan, PD123319 and A-779, respectively) injected into the paraventricular nucleus of hypothalamus (PVN) in conscious Wistar Kyoto (WKY) and spontaneously hypertensive rats (SHR). Results are presented as mean ± SEM (<span class="html-italic">n</span> = 7–8) and calculated as change in basal values determined before agonist injection. # <span class="html-italic">p</span> < 0.05, ## <span class="html-italic">p</span> < 0.01, ### <span class="html-italic">p</span> < 0.001 compared to the corresponding control group; * <span class="html-italic">p</span> < 0.05, ** <span class="html-italic">p</span> < 0.01, *** <span class="html-italic">p</span> < 0.001 compared to WKY.</p> Full article ">Figure 5
<p>Influence of the CB<sub>1</sub> receptor antagonist AM251 on the pressor effect of angiotensin II (AT<sub>1/2</sub> receptor agonist) (<b>a</b>,<b>b</b>) and angiotensin 1–7 (Mas receptor agonist) (<b>c</b>,<b>d</b>) injected into the paraventricular nucleus of hypothalamus (PVN) in conscious Wistar Kyoto (WKY) and spontaneously hypertensive rats (SHR). Results, presented as mean ± SEM (<span class="html-italic">n</span> = 7–8), are calculated as change in basal values determined before agonist/antagonist injection. # <span class="html-italic">p</span> < 0.05, ### <span class="html-italic">p</span> < 0.001 compared to the corresponding control group. * <span class="html-italic">p</span> < 0.05, ** <span class="html-italic">p</span> < 0.01, *** <span class="html-italic">p</span> < 0.001 compared to WKY.</p> Full article ">Figure 6
<p>Influence of AT<sub>1</sub> and AT<sub>2</sub> (losartan and PD123319; (<b>a</b>,<b>b</b>), and Mas (A-779; (<b>c</b>,<b>d</b>) receptor antagonists on the pressor effect of the CB<sub>1</sub> receptor agonist CP55940 injected into the paraventricular nucleus of hypothalamus (PVN) in conscious Wistar Kyoto (WKY) and spontaneously hypertensive rats (SHR). All experiments were performed after i.v. injection of the CB<sub>1</sub> receptor antagonist AM251. Results, presented as mean ± SEM (<span class="html-italic">n</span> = 5–7), are calculated as the change in basal values determined before agonist injection. <span class="html-italic"># p</span> < 0.05, #<span class="html-italic"># p</span> < 0.01, ##<span class="html-italic"># p</span> < 0.001 compared to the corresponding control group; <span class="html-italic">* p</span> < 0.05 compared to WKY.</p> Full article ">Figure 7
<p>Fold change of cannabinoid CB<sub>1</sub> (<b>a</b>), AT<sub>2</sub> (<b>b</b>) and Mas (<b>c</b>) receptors and representative Western blots of the paraventricular nucleus of hypothalamus (PVN), rostral ventrolateral medulla (RVLM) and nucleus tractus solitarii (NTS) in Wistar Kyoto (WKY) and spontaneously hypertensive rats (SHR). β-actin or glyceraldehyde-3-phosphate dehydrogenase (GAPDH) served as loading control. Results presented as mean ± SEM (<span class="html-italic">n</span> = 6). ** <span class="html-italic">p</span> < 0.01, *** <span class="html-italic">p</span> < 0.001 compared to WKY. Uncropped Western blot images can be seen in <a href="#app1-cells-11-01542" class="html-app">Supplementary Materials, file Figure S1</a>.</p> Full article ">Figure 8
<p>Mechanisms involved in the pressor response induced by Ang II and CP55940. Ang II, via AT<sub>1</sub> receptors, leads to endocannabinoid formation in the paraventricular nucleus of hypothalamus (PVN). Endocannabinoids in turn inhibit GABA release by activation of CB<sub>1</sub> receptors. Since little GABA is released, much glutamate (Glu) can be released, also since facilitatory AT<sub>1</sub> receptors on the glutamatergic neuron further increase Glu release. The extents of Glu release and of the pressor response are correlated. The pressor response in SHR increased since AT<sub>1</sub> and CB<sub>1</sub> receptor density in their PVN increased. On the other hand, the pressor response induced by Ang II can be attenuated by CB<sub>1</sub> receptor antagonist AM251. In addition, the pressor response induced by the CB<sub>1</sub> receptor agonist CP55940 can be antagonized by AT<sub>1</sub> receptor antagonist losartan.</p> Full article ">
<p>Effect of cannabinoids on the expression of NLRP3 inflammasome proteins in THP-1 macrophages. (<b>A</b>): CBD and THC decreased the expression of NLRP3 after LPS + ATP stimulation in THP-1 macrophages: Representative Western blots of NLRP3 and GAPDH bands and the quantification of the same using one-way ANOVA with Tukey’s multiple-comparison test. Four independent experiments (<span class="html-italic">n</span> = 3–4) of THP-1 cell lysates obtained after pre-treatment with CBD or THC for 30 min and LPS stimulation for 3 h followed by ATP for 1 h were analyzed, and data are expressed as means ± SD; * <span class="html-italic">p</span> < 0.05, ** <span class="html-italic">p</span> < 0.01. (Abbreviation: LA: LPS + ATP). (<b>B</b>): CBD and THC decreased the ratio of the expressions of caspase-1 p20/p45 after LPS + ATP stimulation in THP-1 macrophages: Representative Western blots of caspase-1 p45 (pro-caspase1), p20, and GAPDH bands and the quantification of caspase-1 p20/p45 ratio using one-way ANOVA with Tukey’s multiple-comparison test. Four independent experiments (<span class="html-italic">n</span> = 4) of THP-1 cell lysates obtained after pre-treatment with CBD or THC for 30 min and LPS stimulation for 3 h followed by ATP for 1 h were analyzed, and data are expressed as means ± SD; * <span class="html-italic">p</span> < 0.05, ** <span class="html-italic">p</span> < 0.01. (Abbreviation: LA: LPS + ATP). (<b>C</b>): CBD and THC decreased the expression of pro-IL-1β after LPS + ATP stimulation in THP-1 macrophages: Representative Western blots of pro-IL-1β and GAPDH bands and the quantification of the same using one-way ANOVA with Tukey’s multiple-comparison test. Four independent experiments (<span class="html-italic">n</span> = 4) of THP-1 cell lysates obtained after pre-treatment with CBD or THC for 30 min and LPS stimulation for 3 h followed by ATP for 1 h were analyzed, and data are expressed as means ± SD; ** <span class="html-italic">p</span> < 0.01, *** <span class="html-italic">p</span> < 0.001. (Abbreviation: LA: LPS + ATP). (<b>D</b>): CBD and THC decreased the expression of mature IL-1β after LPS + ATP stimulation in cell supernatants of THP-1 macrophages: Representative Western blots of mature-IL-1β and β-actin bands and the quantification of the same using one-way ANOVA with Tukey’s multiple-comparison test. Four independent experiments (<span class="html-italic">n</span> = 4) of THP-1 cell supernatants obtained after pre-treatment with CBD or THC for 30 min and LPS stimulation for 3 h followed by ATP for 1 h were analyzed, and data are expressed as means ± SD; ** <span class="html-italic">p</span> < 0.01, *** <span class="html-italic">p</span> < 0.001, **** <span class="html-italic">p</span> < 0.0001. (Abbreviation: LA: LPS + ATP).</p> Full article ">Figure 2
<p>Effect of cannabinoids on the expression of NLRP3 inflammasome proteins in primary human bronchial epithelial cells. (<b>A</b>): CBD and THC decreased the expression of NLRP3 after LPS + ATP stimulation in primary HBEC: Representative Western blots of NLRP3 and GAPDH bands and the quantification of the same using one-way ANOVA with Tukey’s multiple-comparison test. Four independent experiments (<span class="html-italic">n</span> = 4) of primary human bronchial epithelial cell lysates obtained after pre-treatment with CBD or THC for 30 min and LPS stimulation for 8 h followed by ATP for 1 h were analyzed, and data are expressed as means ± SD; * <span class="html-italic">p</span> < 0.05, ** <span class="html-italic">p</span> < 0.01. (Abbreviations: HBECs: Human bronchial epithelial cells; LA: LPS + ATP). (<b>B</b>): CBD and THC decreased the expression of pro-IL-1β after LPS + ATP stimulation in primary HBECs: Representative Western blots of pro-IL-1β and GAPDH bands and the quantification of the same using one-way ANOVA with Tukey’s multiple-comparison test. Four independent experiments (<span class="html-italic">n</span> = 4) of primary human bronchial epithelial cell lysates obtained after pre-treatment with CBD or THC for 30 min and LPS stimulation for 8 h followed by ATP for 1 h were analyzed, and data are expressed as means ± SD; * <span class="html-italic">p</span> < 0.05, ** <span class="html-italic">p</span> < 0.01, **** <span class="html-italic">p</span> < 0.0001. (Abbreviations: HBECs: Human bronchial epithelial cells; LA: LPS + ATP). (<b>C</b>): CBD and THC decreased the expression of mature IL-1β after LPS + ATP stimulation in cell supernatants of primary HBECs: Representative Western blots of mature-IL-1β and β-actin bands and the quantification of the same using one-way ANOVA with Tukey’s multiple-comparison test. Four independent experiments (<span class="html-italic">n</span> = 4) of primary human bronchial epithelial cell supernatants obtained after pre-treatment with CBD or THC for 30 min and LPS stimulation for 8 h followed by ATP for 1 h were analyzed, and data are expressed as means ± SD; * <span class="html-italic">p</span> < 0.05, ** <span class="html-italic">p</span> < 0.01. (Abbreviations: HBECs: Human bronchial epithelial cells; LA: LPS + ATP).</p> Full article ">Figure 3
<p>Effect of cannabinoids on the NFκB-mediated gene expression in THP-1 macrophages and primary human bronchial epithelial cells. (<b>A</b>): CBD, not THC, decreased the expression of phospho-NFκB p65 (Ser-536) after LPS stimulation in THP-1 macrophages: Representative Western blots of NFκB, p-NFκB, and GAPDH bands and the quantification of the same using one-way ANOVA with Tukey’s multiple-comparison test. Four independent experiments (<span class="html-italic">n</span> = 4) of THP-1 cell lysates obtained after pre-treatment with CBD or THC for 30 min and LPS stimulation for 3 h were analyzed, and data are expressed as means ± SD; * <span class="html-italic">p</span> < 0.05, ** <span class="html-italic">p</span> < 0.01, *** <span class="html-italic">p</span> < 0.001, **** <span class="html-italic">p</span> < 0.0001. (<b>B</b>): CBD, not THC, decreased the ratio of the expressions of phospho-NFκB p65 (Ser-536)/NFκB after LPS stimulation in primary HBECs: Representative Western blots of NFκB, <span class="html-italic">p</span>-NFκB, and GAPDH bands and the quantification of the same using one-way ANOVA with Tukey’s multiple-comparison test. Four independent experiments (<span class="html-italic">n</span> = 4) of primary human bronchial epithelial cell lysates obtained after pre-treatment with CBD or THC for 30 min and LPS stimulation for 8 h were analyzed, and data are expressed as means ± SD; * <span class="html-italic">p</span> < 0.05, *** <span class="html-italic">p</span> < 0.001, **** <span class="html-italic">p</span> < 0.0001. (Abbreviation: HBECs: Human bronchial epithelial cells). (<b>C</b>): CBD and THC decreased the gene expression of <span class="html-italic">Nlrp3</span> and <span class="html-italic">Il-1β</span> after LPS stimulation in THP-1 macrophages: The mRNA expression of <span class="html-italic">Nlrp3</span> and <span class="html-italic">Il-1β</span> relative to GAPDH normalized to vehicle quantified using one-way ANOVA with Tukey’s multiple-comparison test. Four independent experiments (<span class="html-italic">n</span> = 4) using total RNA isolated from THP-1 cells obtained after pre-treatment with CBD or THC for 30 min and LPS stimulation for 3 h were analyzed, and data are expressed as means ± SD; ** <span class="html-italic">p</span> < 0.01, *** <span class="html-italic">p</span> < 0.001, **** <span class="html-italic">p</span> < 0.0001. Each independent experiment was run in duplicates. (<b>D</b>): CBD and THC decreased the gene expression of <span class="html-italic">Nlrp3</span> and <span class="html-italic">Il-1β</span> after LPS stimulation in primary HBECs: The mRNA expression of <span class="html-italic">Nlrp3</span> and <span class="html-italic">Il-1β</span> relative to GAPDH normalized to vehicle was quantified using one-way ANOVA with Tukey’s multiple-comparison test. Four independent experiments (<span class="html-italic">n</span> = 4) using total RNA isolated from primary bronchial epithelial cells obtained after by pre-treatment with CBD or THC for 30 min and LPS stimulation for 8 h were analyzed, and data are expressed as means ± SD; * <span class="html-italic">p</span> < 0.05, ** <span class="html-italic">p</span> < 0.01, *** <span class="html-italic">p</span> < 0.001. Each independent experiment was run in duplicates. (Abbreviation: HBECs: Human bronchial epithelial cells).</p> Full article ">Figure 4
<p>Effect of cannabinoids on the levels of cytokines in THP-1 macrophages and primary human bronchial epithelial cells. (<b>A</b>): CBD and THC decreased the levels of IL-1β after LPS + ATP stimulation in THP-1 macrophages and primary HBECs: The levels of released IL-1β in the cell supernatants were measured using ELISA kit (R&D systems) and quantified using one-way ANOVA with Tukey’s multiple-comparison test. Four independent experiments (<span class="html-italic">n</span> = 4) from THP-1 and primary human bronchial epithelial cell supernatants obtained after pre-treatment with CBD or THC for 30 min and LPS stimulation (3 h for THP-1 cells and 8 h for primary HBECs) followed by ATP treatment for 1 h were performed, and data are expressed as means ± SD; *** <span class="html-italic">p</span> < 0.001, **** <span class="html-italic">p</span> < 0.0001. Each independent experiment was run in duplicates. (Abbreviation: LA: LPS + ATP; HBECs: Human bronchial epithelial cells). (<b>B</b>): CBD and THC decreased the levels of IL-6 after LPS stimulation in THP-1 macrophages and primary HBECs: The levels of released IL-6 in the cell supernatants were measured using multiplex ELISA and quantified using one-way ANOVA with Tukey’s multiple-comparison test. Four independent experiments (<span class="html-italic">n</span> = 4) from THP-1 and primary human bronchial epithelial cell supernatants obtained after pre-treatment with CBD or THC for 30 min and LPS stimulation (3 h for THP-1 cells and 8 h for primary HBECs) were performed, and data are expressed as means ± SD; * <span class="html-italic">p</span> < 0.05, ** <span class="html-italic">p</span> < 0.01, **** <span class="html-italic">p</span> < 0.0001. Each independent experiment was run in duplicates. (Abbreviation: HBECs: Human bronchial epithelial cells). (<b>C</b>): CBD and THC decreased the levels of IL-8 after LPS stimulation in THP-1 macrophages and primary HBECs: The levels of released IL-8 in the cell supernatants were measured using multiplex ELISA and quantified using one-way ANOVA with Tukey’s multiple-comparison test. Four independent experiments (<span class="html-italic">n</span> = 4) from THP-1 and primary human bronchial epithelial cell supernatants obtained after pre-treatment with CBD or THC for 30 min and LPS stimulation (3 h for THP-1 cells and 8 h for primary HBECs) were performed, and data are expressed as means ± SD; * <span class="html-italic">p</span> < 0.05, ** <span class="html-italic">p</span> < 0.01, **** <span class="html-italic">p</span> < 0.0001. Each independent experiment was run in duplicates. (Abbreviation: HBECs: Human bronchial epithelial cells). (<b>D</b>): CBD and THC decreased the levels of TNF-α after LPS stimulation in THP-1 macrophages and primary HBECs: The levels of released TNF-α in the cell supernatants were measured using multiplex ELISA and quantified using one-way ANOVA with Tukey’s multiple-comparison test. Four independent experiments (<span class="html-italic">n</span> = 4) from THP-1 and primary human bronchial epithelial cell supernatants obtained after pre-treatment with CBD or THC for 30 min and LPS stimulation (3 h for THP-1 cells and 8 h for primary HBECs) were performed, and data are expressed as means ± SD; ** <span class="html-italic">p</span> < 0.01, **** <span class="html-italic">p</span> < 0.0001. Each independent experiment was run in duplicates. (Abbreviation: HBECs: Human bronchial epithelial cells). (<b>E</b>): CBD decreased the levels of IL-10 after LPS stimulation in THP-1 macrophages whereas CBD and THC decreased the levels of GM-CSF after LPS stimulation in primary HBECs: The levels of released IL-10 and GM-CSF in the cell supernatants were measured using multiplex ELISA and quantified using one-way ANOVA with Tukey’s multiple-comparison test. Four independent experiments (<span class="html-italic">n</span> = 4) from THP-1 and primary human bronchial epithelial cell supernatants obtained after pre-treatment with CBD or THC for 30 min and LPS stimulation (3 h for THP-1 cells and 8 h for primary HBECs) were performed and data are expressed as means ± SD; ** <span class="html-italic">p</span> < 0.01, **** <span class="html-italic">p</span> < 0.0001. Each independent experiment was run in duplicates. (Abbreviation: HBECs: Human bronchial epithelial cells).</p> Full article ">Figure 5
<p>Effect of cannabinoids on ROS generation and cell viability in THP-1 macrophages and primary human bronchial epithelial cells. (<b>A</b>): CBD and THC decreased the cellular ROS levels after LPS + ATP stimulation without affecting cell viability in THP-1 macrophages: The ROS levels and % cell viability were measured using cellular ROS assay kit (Abcam) and trypan blue assay, respectively and quantified using one-way ANOVA with Tukey’s multiple-comparison test. Four independent experiments (<span class="html-italic">n</span> = 4) for ROS assay and three independent experiments (<span class="html-italic">n</span> = 3) for trypan blue assay from THP-1 cells obtained after pre-treatment with CBD or THC for 30 min and LPS stimulation for 3 h followed by ATP 1 h were performed, and data are expressed as means ± SD; * <span class="html-italic">p</span> < 0.05, *** <span class="html-italic">p</span> < 0.001. Each independent experiment was run in duplicates for both assays. (Abbreviation: LA: LPS + ATP). (<b>B</b>): CBD and THC decreased the cellular ROS levels after LPS + ATP stimulation without affecting cell viability in primary HBECs: The ROS levels and % cell viability were measured using cellular ROS assay kit (Abcam) and trypan blue assay, respectively and quantified using one-way ANOVA with Tukey’s multiple-comparison test. Four independent experiments (<span class="html-italic">n</span> = 4) for ROS assay and three independent experiments (<span class="html-italic">n</span> = 3) for trypan blue assay from primary HBECs obtained after pre-treatment with CBD or THC for 30 min and LPS stimulation for 8 h followed by ATP 1 h were performed, and data are expressed as means ± SD; ** <span class="html-italic">p</span> < 0.01, **** <span class="html-italic">p</span> < 0.0001. Each independent experiment was run in duplicates for both assays. (Abbreviation: LA: LPS + ATP; HBECs: Human bronchial epithelial cells).</p> Full article ">Figure 6
<p>Effect of cannabinoids on TYK-2-mediated phosphorylation of STAT3 in THP-1 macrophages and primary human bronchial epithelial cells. (<b>A</b>): CBD and THC decreased the ratio of the expressions of phospho-STAT3 (Tyr-705)/STAT3 after LPS stimulation in THP-1 macrophages: Representative Western blots of p-STAT3, STAT3, and GAPDH bands and the quantification of the ratio p-STAT3/STAT3 using one-way ANOVA with Tukey’s multiple-comparison test. Four independent experiments (<span class="html-italic">n</span> = 4) of primary human bronchial epithelial cell lysates obtained after pre-treatment with CBD or THC for 30 min and LPS stimulation for 3 h were analyzed, and data are expressed as means ± SD; * <span class="html-italic">p</span> < 0.05, ** <span class="html-italic">p</span> < 0.01, *** <span class="html-italic">p</span> < 0.001. (<b>B</b>): CBD and THC decreased ratio of the expressions of phospho-STAT3 (Tyr-705)/STAT3 after LPS stimulation in primary HBECs: Representative Western blots of p-STAT3, STAT3, and GAPDH bands and the quantification of the ratio p-STAT3/STAT3 using one-way ANOVA with Tukey’s multiple-comparison test. Four independent experiments (<span class="html-italic">n</span> = 4) of THP-1 cell lysates obtained after pre-treatment with CBD or THC for 30 min and LPS stimulation for 8 h were analyzed, and data are expressed as means ± SD; * <span class="html-italic">p</span> < 0.05, **** <span class="html-italic">p</span> < 0.0001. (Abbreviation: HBECs: Human bronchial epithelial cells). (<b>C</b>): CBD and THC decreased the gene expression of <span class="html-italic">Tyk2</span> after LPS stimulation in THP-1 macrophages and primary HBECs: The mRNA expression of <span class="html-italic">Tyk2</span> relative to GAPDH normalized to vehicle was quantified using one-way ANOVA with Tukey’s multiple-comparison test. Four independent experiments (<span class="html-italic">n</span> = 4) using total RNA isolated from THP-1 and primary bronchial epithelial cells obtained after by pre-treatment with CBD or THC for 30 min and LPS stimulation (3 h for THP-1 cells and 8 h for primary HBECs) were analyzed, and data are expressed as means ± SD; **** <span class="html-italic">p</span> < 0.0001. Each independent experiment was run in duplicates. (Abbreviation: HBECs: Human bronchial epithelial cells). (<b>D</b>): CBD and THC decreased the ratio of the expressions of phospho-TYK2 (Tyr1054/1055)/TYK2 after LPS stimulation in THP-1 macrophages: Representative Western blots of p-TYK2, TYK2, and GAPDH bands and the quantification of the ratio p-TYK2/TYK2 using one-way ANOVA with Tukey’s multiple-comparison test. Four independent experiments (<span class="html-italic">n</span> = 4) of THP-1 cell lysates obtained after pre-treatment with CBD or THC for 30 min and LPS stimulation for 3 h were analyzed, and data are expressed as means ± SD; * <span class="html-italic">p</span> < 0.05, *** <span class="html-italic">p</span> < 0.001, **** <span class="html-italic">p</span> < 0.0001. (<b>E</b>): CBD and THC decreased the ratio of the expressions of phospho-TYK2 (Tyr1054/1055)/TYK2 after LPS stimulation in primary HBECs: Representative Western blots of p-TYK2, TYK2, and GAPDH bands and the quantification of the ratio p-TYK2/TYK2 using one-way ANOVA with Tukey’s multiple-comparison test. Four independent experiments (<span class="html-italic">n</span> = 4) of primary human bronchial epithelial cell lysates obtained after pre-treatment with CBD or THC for 30 min and LPS stimulation for 8 h were analyzed, and data are expressed as means ± SD; ** <span class="html-italic">p</span> < 0.01, *** <span class="html-italic">p</span> < 0.001. (Abbreviation: HBECs: Human bronchial epithelial cells).</p> Full article ">Figure 7
<p>Summary of anti-inflammatory pathways activated by CBD and THC to curb LPS-induced cytokine storm: ①. LPS activates TLR4 receptors which in turn phosphorylates NF-κB. Phosphorylated NF-κB moieties translocate to the nucleus, thereby upregulating the expression of variety of pro-inflammatory genes. ②. This TLR4-NFκB-mediated “priming” (increased expression of NLRP3, pro-IL-1β, and pro-caspase-1) is the first step in the activation of NLRP3 inflammasome. ③. LPS also induces oxidative stress causing higher levels of ROS which in turn act as second “activation” signal leading to NLRP3 inflammasome assembly and activation. ④. The NLRP3 inflammasome activation causes the release of mature IL-1β leading to cell death via pyroptosis. ⑤. Along with inflammasome activation, NFκB activation also increases the levels of variety of other pro-inflammatory cytokines including IL-6. IL-6 binds to its receptors coupled to transmembrane protein, gp130, which in turn, in part, phosphorylates TYK2. ⑥. Phosphorylated TYK2, in turn, phosphorylates STAT3 leading to the translocation of the latter to the nucleus. Phosphorylated STAT3 furthermore potentiates NFκB activation. ⑦. Nuclear translocation of STAT3 and NFκB activate gene expression of various pro-inflammatory cytokines leading to cytokine release syndrome or cytokine storm. This cytokine storm activates vicious cycle of IL-6 amplification (IL-6 AMP) which is implicated in chronic inflammation, tissue injury, and organ damage. Our in vitro data revealed that CBD and THC block all the steps numbered in the figure above in both THP-1 macrophages (immune cells) and primary human bronchial epithelial cells (non-immune cells).</p> Full article ">
Full article ">Figure 1
<p>Cannabinoids and their affinities to the classical cannabinoid CB<sub>1</sub> and CB<sub>2</sub> receptors and to other receptors sensitive to cannabinoids, as well as to inhibitors of enzymes involved in the synthesis and/or degradation of AEA and 2-AG. Note that the numbers in the superscript indicate the appropriate reference [<a href="#B15-cells-11-01142" class="html-bibr">15</a>,<a href="#B16-cells-11-01142" class="html-bibr">16</a>,<a href="#B17-cells-11-01142" class="html-bibr">17</a>,<a href="#B18-cells-11-01142" class="html-bibr">18</a>,<a href="#B19-cells-11-01142" class="html-bibr">19</a>,<a href="#B20-cells-11-01142" class="html-bibr">20</a>,<a href="#B21-cells-11-01142" class="html-bibr">21</a>,<a href="#B22-cells-11-01142" class="html-bibr">22</a>,<a href="#B23-cells-11-01142" class="html-bibr">23</a>,<a href="#B24-cells-11-01142" class="html-bibr">24</a>,<a href="#B25-cells-11-01142" class="html-bibr">25</a>,<a href="#B26-cells-11-01142" class="html-bibr">26</a>,<a href="#B27-cells-11-01142" class="html-bibr">27</a>,<a href="#B28-cells-11-01142" class="html-bibr">28</a>,<a href="#B29-cells-11-01142" class="html-bibr">29</a>,<a href="#B30-cells-11-01142" class="html-bibr">30</a>,<a href="#B31-cells-11-01142" class="html-bibr">31</a>,<a href="#B32-cells-11-01142" class="html-bibr">32</a>,<a href="#B33-cells-11-01142" class="html-bibr">33</a>,<a href="#B34-cells-11-01142" class="html-bibr">34</a>,<a href="#B35-cells-11-01142" class="html-bibr">35</a>,<a href="#B36-cells-11-01142" class="html-bibr">36</a>,<a href="#B37-cells-11-01142" class="html-bibr">37</a>,<a href="#B38-cells-11-01142" class="html-bibr">38</a>]. The figure presents only phytocannabinoids (green font), synthetic cannabinoids and other compounds discussed in this article (black font), endogenous cannabinoids (pink font) and inhibitors of the endocannabinoid synthesis and degradation (blue font) that have been considered in this review. ECS, endocannabinoid system; the “plus sign” indicates agonism and the “minus sign” antagonism, inverse agonism or inhibition versus the respective receptors/enzymes. The intensity of blue color next to the compound is higher the lower the values of K<sub>i</sub>, IC<sub>50</sub> or EC<sub>50</sub> are (expressed in nM). Based on Pertwee et al. [<a href="#B39-cells-11-01142" class="html-bibr">39</a>] unless stated otherwise (superscript). WIN55212-3, inactive S(–)enantiomer of WIN55212-2 [<a href="#B40-cells-11-01142" class="html-bibr">40</a>]; AM404, an inhibitor of anandamide transport [<a href="#B41-cells-11-01142" class="html-bibr">41</a>]. Abbreviations: Δ<sup>9</sup>-THC, Δ<sup>9</sup>-tetrahydrocannabinol; 2-AG, 2-arachidonoylglycerol; abn-CBD, abnormal cannabidiol; ACEA, arachidonoyl-2’-chlorethylamide; ACPA, arachidonylcyclopropylamide; AEA, anandamide; CB<sub>1</sub>, cannabinoid CB<sub>1</sub> receptor; CB<sub>2</sub>, cannabinoid CB<sub>2</sub> receptor; CBD, cannabidiol; DAGL, diacylglycerol lipase; ECS, endocannabinoid system; FAAH, fatty-acid amide hydrolase; GPR18, G protein-coupled receptor 18; GPR55, G protein-coupled receptor 55; LPI, L-alpha-lysophosphatidylinositol; MethAEA, methanandamide; n.d., not determined; OEA, oleoylethanolamide; PEA, palmitoylethanolamide; TRPV1 transient receptor-potential cation-channel subfamily V member 1; URB597, inhibitor of fatty-acid amide hydrolase.</p> Full article ">Figure 2
<p>Effects of cannabinoids on the heart possibly implicated in myocardial infarction. ?, pathophysiological relevance plausible but not supported by appropriate studies; CB<sub>1</sub>-R, cannabinoid CB<sub>1</sub> receptor; MI, myocardial infarction.</p> Full article ">
Full article ">Figure 1
<p>Schematic overview of the development pipeline for the general deep-learning molecule generation model, g-DeepMGM (<b>a</b>), and the target-specific deep-learning molecule generation model, t-DeepMGM (<b>b</b>) in combination with supervised machine-learning discriminator of multilayer perceptron (<b>c</b>).</p> Full article ">Figure 2
<p>The training and sampling of the recurrent neural networks (RNN) model with long-short-term memory (LSTM) units. (<b>a</b>) The architecture of the neural network and the example sampling process with the indole ring as the input. (<b>b</b>) Training loss and validation loss at different training epochs. (<b>c</b>) Training accuracy and validation accuracy at different epochs.</p> Full article ">Figure 3
<p>Privileged scaffolds and sampling examples of g-DeepMGM on indole. (<b>a</b>) Privileged scaffolds and the illustrated drugs that are derived from them. (<b>b</b>) Randomly selected sampling outcome for the indole scaffold under four temperatures with the g-DeepMGM at epoch 40. Seven SMILES strings representing seven addition positions on the indole were fed as the initial input. Reported similar compounds to the generated molecules in the column “T = 1.5” are listed for comparison. Using both physical-chemical properties-based (<b>c</b>) and MACCS fingerprints-based (<b>d</b>) t-SNE analysis to compare generated indole molecules and training compounds.</p> Full article ">Figure 4
<p>Distribution and correlation of molecular weight (M.W.), topological polar surface area (TPSA), molecular refractivity (SMR), and log of the octanol/water partition coefficient (SlogP) for training compounds, generated indole compounds, and generated purine compounds.</p> Full article ">Figure 5
<p>Developing t-DeepMGM to sample CB2 target-specific molecules after the transfer learning. (<b>a</b>) Architecture of the t-DeepMGM in transfer learning. The transfer learning processes with either one LSTM layer locked (<b>b</b>,<b>d</b>) or both LSTM layers locked (<b>c</b>,<b>e</b>) are performed for comparison. The influence of using different sizes of mini-batches (128 and 512) was also evaluated. (<b>f</b>) Molecular sampling examples from the t-DeepMGM for four known CB2 scaffolds. (<b>g</b>) The distribution of the predicted likelihood of generated CB2 molecules by the MLP discriminator.</p> Full article ">Figure 6
<p>Identification of XIE9137 as a potential negative allosteric modulator for CB2. (<b>a</b>) Scheme of the in silico design-test circle. (<b>b</b>) Using chemistry synthesis and biological validation to evaluate generated molecules by the t-DeepMGM. (<b>c</b>) Synthetic route to obtain the target compound. (<b>d</b>,<b>e</b>) CB2 [<sup>35</sup>S]-GTPγS functional assay for CP55940 (<b>d</b>) and XIE9137 (<b>e</b>) alone. (<b>f</b>,<b>g</b>) CB2 [<sup>35</sup>S]-GTPγS functional assay for XIE9137 with the coexistence of CP55940 at EC<sub>20</sub> concentration (<b>f</b>) and EC<sub>80</sub> concentration (<b>g</b>). (<b>h</b>) Counts per minute in the CB2 [<sup>35</sup>S]-GTPγS functional assay for XIE9137 at different log concentrations.</p> Full article ">


