Tolleson, Arizona
Submit your own pictures of this city and show them to the world
- OSM Map
- General Map
- Google Map
- MSN Map
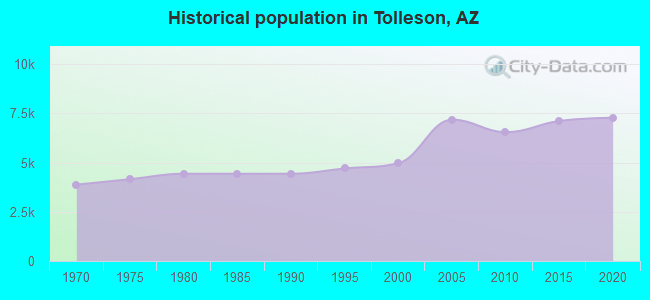
Population change since 2000: +45.9%
| Males: 3,500 | |
| Females: 3,758 |
| Median resident age: | 33.6 years |
| Arizona median age: | 38.8 years |
Zip codes: 85353.
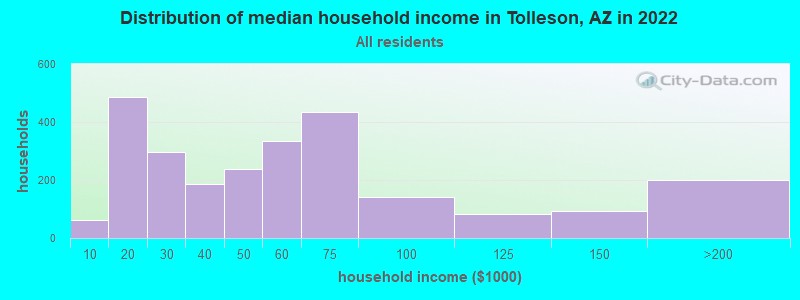
| Tolleson: | $49,698 |
| AZ: | $74,568 |
Estimated per capita income in 2022: $21,277 (it was $13,747 in 2000)
Tolleson city income, earnings, and wages data
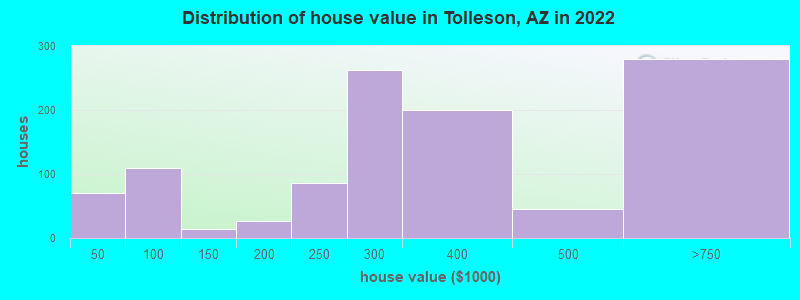
Estimated median house or condo value in 2022: $345,564 (it was $77,800 in 2000)
| Tolleson: | $345,564 |
| AZ: | $402,800 |
Mean prices in 2022: all housing units: $561,376; detached houses: $603,669; townhouses or other attached units: $425,635; in 2-unit structures: $555,372; in 3-to-4-unit structures: $326,563; in 5-or-more-unit structures: $397,708; mobile homes: $119,264; occupied boats, rvs, vans, etc.: $63,144
Median gross rent in 2022: $1,262.
(13.6% for White Non-Hispanic residents, 33.3% for Black residents, 18.9% for Hispanic or Latino residents, 100.0% for American Indian residents, 15.3% for other race residents, 31.5% for two or more races residents)
Detailed information about poverty and poor residents in Tolleson, AZ
Compare current foreclosures in Tolleson, AZ:
| Photo | Address | Area | Beds / Baths | Price | Details |
|---|---|---|---|---|---|

|
#1
S 99th Dr
Tolleson, AZ 85353
|
1,354 sq. feet
|
2 baths 3 beds |
show details | |

|
#2
W Washington St
Tolleson, AZ 85353
|
1,256 sq. feet
|
2 baths 3 beds |
show details | |

|
#3
W Wood St
Tolleson, AZ 85353
|
2,783 sq. feet
|
3 baths 5 beds |
show details | |

|
#4
W Hughes Dr
Tolleson, AZ 85353
|
2,102 sq. feet
|
3 baths 4 beds |
show details | |

|
#5
W Superior Ave
Tolleson, AZ 85353
|
2,912 sq. feet
|
2 baths 4 beds |
show details | |

|
#6
S 106th Ln
Tolleson, AZ 85353
|
3,472 sq. feet
|
2 baths 4 beds |
show details | |

|
#7
W Elwood St
Tolleson, AZ 85353
|
2,713 sq. feet
|
3 baths 5 beds |
show details | |

|
#8
S 107th Ln
Tolleson, AZ 85353
|
2,213 sq. feet
|
4 baths - beds |
show details | |

|
#9
W Odeum Ln
Tolleson, AZ 85353
|
1,953 sq. feet
|
3 baths - beds |
show details | |

|
#10
S 83rd Ln
Tolleson, AZ 85353
|
1,298 sq. feet
|
- baths - beds |
show details |
| Photo | Address | Area | Beds / Baths | Price | Details |
|---|---|---|---|---|---|

|
#11
W Cordes Rd
Tolleson, AZ 85353
|
1,323 sq. feet
|
- baths - beds |
show details | |

|
#12
W Wier Ave
Tolleson, AZ 85353
|
2,173 sq. feet
|
- baths - beds |
show details | |

|
#13
W Watkins St
Tolleson, AZ 85353
|
1,450 sq. feet
|
- baths - beds |
show details | |

|
#14
W Mohave St
Tolleson, AZ 85353
|
1,890 sq. feet
|
- baths - beds |
show details | |

|
#15
W Illini St
Tolleson, AZ 85353
|
- sq. feet
|
- baths - beds |
show details | |

|
#16
N 97th Ave
Tolleson, AZ 85353
|
- sq. feet
|
- baths - beds |
show details | |

|
#17
W Hilton
Tolleson, AZ 85353
|
1,741 sq. feet
|
- baths - beds |
show details | |

|
#18
S 95th Dr
Tolleson, AZ 85353
|
- sq. feet
|
- baths - beds |
show details | |

|
#19
W Veliana Way
Tolleson, AZ 85353
|
- sq. feet
|
- baths - beds |
show details | |

|
#20
W Taylor St
Tolleson, AZ 85353
|
1,467 sq. feet
|
- baths - beds |
show details |
| Photo | Address | Area | Beds / Baths | Price | Details |
|---|---|---|---|---|---|

|
#21
S 104th Gln
Tolleson, AZ 85353
|
- sq. feet
|
- baths - beds |
show details | |

|
#22
S 97th Dr
Tolleson, AZ 85353
|
- sq. feet
|
- baths - beds |
show details | |

|
#23
N 91st Ave # 2-223
Tolleson, AZ 85353
|
- sq. feet
|
- baths - beds |
show details | |

|
#24
W Florence Ave
Tolleson, AZ 85353
|
2,500 sq. feet
|
- baths - beds |
show details | |

|
#25
W Atlantis Way
Tolleson, AZ 85353
|
- sq. feet
|
- baths - beds |
show details | |

|
#26
S 103rd Dr
Tolleson, AZ 85353
|
- sq. feet
|
- baths - beds |
show details | |

|
#27
W Kingman St
Tolleson, AZ 85353
|
- sq. feet
|
- baths - beds |
show details | |

|
#28
W Hilton
Tolleson, AZ 85353
|
- sq. feet
|
- baths - beds |
show details | |

|
#29
S 106th Ln
Tolleson, AZ 85353
|
- sq. feet
|
- baths - beds |
show details | |

|
#30
W Atlantis Way
Tolleson, AZ 85353
|
- sq. feet
|
- baths - beds |
show details |
| Photo | Address | Area | Beds / Baths | Price | Details |
|---|---|---|---|---|---|

|
#31
W Encinas Ln
Tolleson, AZ 85353
|
- sq. feet
|
- baths - beds |
show details | |

|
#32
W Southgate Ave
Tolleson, AZ 85353
|
- sq. feet
|
- baths - beds |
show details | |

|
#33
W Wood St
Tolleson, AZ 85353
|
- sq. feet
|
- baths - beds |
show details | |

|
#34
S 99th Ave # 32
Tolleson, AZ 85353
|
- sq. feet
|
- baths - beds |
show details | |

|
#35
W Atlantis Way
Tolleson, AZ 85353
|
- sq. feet
|
- baths - beds |
show details | |

|
#36
S 94th Ln
Tolleson, AZ 85353
|
1,700 sq. feet
|
- baths - beds |
show details | |

|
#37
W Trumbull Rd
Tolleson, AZ 85353
|
- sq. feet
|
- baths - beds |
show details | |

|
#38
W Southgate Ave
Tolleson, AZ 85353
|
- sq. feet
|
- baths - beds |
show details | |

|
#39
W Hughes Dr
Tolleson, AZ 85353
|
1,687 sq. feet
|
- baths - beds |
show details | |

|
#40
W Kirby Ave
Tolleson, AZ 85353
|
- sq. feet
|
- baths - beds |
show details |
| Photo | Address | Area | Beds / Baths | Price | Details |
|---|---|---|---|---|---|

|
#41
W Southgate Ave
Tolleson, AZ 85353
|
- sq. feet
|
- baths - beds |
show details | |

|
#42
W Washington St
Tolleson, AZ 85353
|
1,174 sq. feet
|
- baths - beds |
show details | |

|
#43
W Superior Ave
Tolleson, AZ 85353
|
2,145 sq. feet
|
- baths - beds |
show details | |

|
#44
W Pioneer St
Tolleson, AZ 85353
|
1,271 sq. feet
|
- baths - beds |
show details | |

|
#45
W Mcdowell Rd # 2055
Tolleson, AZ 85353
|
- sq. feet
|
- baths - beds |
show details | |

|
#46
W Heber Rd
Tolleson, AZ 85353
|
2,719 sq. feet
|
- baths - beds |
show details | |

|
#47
W Van Buren St Apt 712
Tolleson, AZ 85353
|
- sq. feet
|
- baths - beds |
show details | |

|
#48
S 113th Ave
Tolleson, AZ 85353
|
- sq. feet
|
- baths - beds |
show details | |

|
#49
W Crown King Rd
Tolleson, AZ 85353
|
- sq. feet
|
- baths - beds |
show details | |

|
Check over 1 million property listings on Foreclosure.com!
|
browse all offers | |||


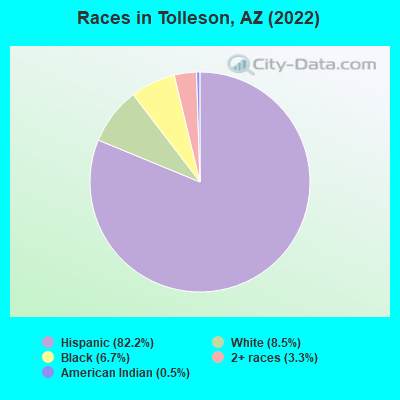
- 6,09882.2%Hispanic
- 6338.5%White alone
- 4956.7%Black alone
- 2483.3%Two or more races
- 380.5%American Indian alone
According to our research of Arizona and other state lists, there were 40 registered sex offenders living in Tolleson, Arizona as of March 04, 2025.
The ratio of all residents to sex offenders in Tolleson is 181 to 1.
Type |
2009 |
2010 |
2011 |
2012 |
2013 |
2014 |
2015 |
2016 |
2017 |
2018 |
2019 |
2020 |
2021 |
2022 |
|---|---|---|---|---|---|---|---|---|---|---|---|---|---|---|
| Murders (per 100,000) | 0 (0.0) | 0 (0.0) | 0 (0.0) | 1 (14.9) | 1 (14.8) | 2 (29.4) | 0 (0.0) | 0 (0.0) | 0 (0.0) | 3 (41.1) | 0 (0.0) | 0 (0.0) | 1 (13.6) | 0 (0.0) |
| Rapes (per 100,000) | 5 (66.7) | 2 (30.6) | 7 (105.5) | 2 (29.7) | 1 (14.8) | 2 (29.4) | 3 (42.7) | 0 (0.0) | 5 (68.6) | 3 (41.1) | 4 (54.1) | 4 (53.5) | 9 (122.4) | 0 (0.0) |
| Robberies (per 100,000) | 10 (133.4) | 16 (244.5) | 8 (120.5) | 13 (193.2) | 10 (148.1) | 13 (191.0) | 15 (213.4) | 1 (14.1) | 30 (411.6) | 23 (314.9) | 20 (270.3) | 18 (241.0) | 11 (149.6) | 7 (95.8) |
| Assaults (per 100,000) | 32 (426.8) | 31 (473.6) | 41 (617.7) | 38 (564.8) | 25 (370.2) | 22 (323.2) | 21 (298.8) | 1 (14.1) | 33 (452.7) | 32 (438.1) | 44 (594.7) | 68 (910.3) | 55 (748.2) | 27 (369.5) |
| Burglaries (per 100,000) | 210 (2,801) | 204 (3,117) | 210 (3,164) | 226 (3,359) | 194 (2,872) | 209 (3,070) | 219 (3,116) | 19 (267.4) | 250 (3,430) | 213 (2,916) | 206 (2,784) | 200 (2,677) | 49 (666.6) | 21 (287.4) |
| Thefts (per 100,000) | 535 (7,135) | 471 (7,196) | 526 (7,924) | 372 (5,529) | 441 (6,529) | 435 (6,390) | 399 (5,676) | 33 (464.5) | 453 (6,215) | 376 (5,147) | 390 (5,271) | 612 (8,193) | 661 (8,992) | 181 (2,477) |
| Auto thefts (per 100,000) | 63 (840.2) | 48 (733.4) | 39 (587.5) | 40 (594.5) | 41 (607.0) | 59 (866.8) | 51 (725.6) | 0 (0.0) | 70 (960.4) | 82 (1,123) | 70 (946.1) | 97 (1,299) | 97 (1,320) | 24 (328.4) |
| Arson (per 100,000) | 1 (13.3) | 2 (30.6) | 4 (60.3) | 1 (14.9) | 2 (29.6) | 2 (29.4) | 1 (14.2) | 0 (0.0) | 3 (41.2) | 3 (41.1) | 0 (0.0) | 2 (26.8) | 6 (81.6) | 0 (0.0) |
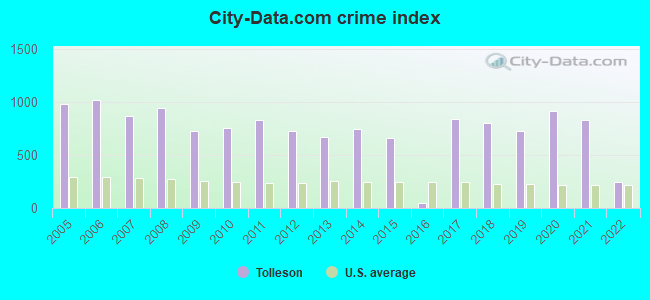
| City-Data.com crime index | 727.4 | 757.2 | 829.5 | 728.3 | 670.7 | 744.1 | 661.1 | 44.3 | 834.4 | 796.9 | 724.7 | 916.2 | 831.6 | 248.1 |
The City-Data.com crime index weighs serious crimes and violent crimes more heavily. Higher means more crime, U.S. average is 246.1. It adjusts for the number of visitors and daily workers commuting into cities.
Crime rate in Tolleson detailed stats: murders, rapes, robberies, assaults, burglaries, thefts, arson
Full-time law enforcement employees in 2020, including police officers: 46 (30 officers - 25 male; 5 female).
| Officers per 1,000 residents here: | 4.02 |
| Arizona average: | 1.73 |
 Recent articles from our blog. Our writers, many of them Ph.D. graduates or candidates, create easy-to-read articles on a wide variety of topics.
| Arizona City by City (224 replies) | |
| Rental Places near Tolleson (1 reply) | |
| Tolleson wannabe street racers (37 replies) | |
| Loop 202 South Mountain Freeway is OPEN! (74 replies) | |
| Tolleson (0 replies) | |
| Metropolitan Phoenix area photo thread (2047 replies) |
Latest news from Tolleson, AZ collected exclusively by city-data.com from local newspapers, TV, and radio stations
Tolleson, AZ City Guides:
Ancestries: Italian (7.5%), Nigerian (2.8%).
Current Local Time: MST (no DST) time zone
Incorporated in 1929
Land area: 5.56 square miles.
Population density: 1,305 people per square mile (low).
1,778 residents are foreign born (23.5% Latin America).
| This city: | 24.0% |
| Arizona: | 13.0% |
Median real estate property taxes paid for housing units with mortgages in 2022: $1,514 (0.4%)
Median real estate property taxes paid for housing units with no mortgage in 2022: $906 (0.3%)
Nearest city with pop. 50,000+: Glendale, AZ (9.6 miles
, pop. 218,812).
Nearest city with pop. 1,000,000+: Phoenix, AZ (11.7 miles
, pop. 1,321,045).
Nearest cities:
Latitude: 33.45 N, Longitude: 112.26 W
Daytime population change due to commuting: +13,039 (+175.8%)
Workers who live and work in this city: 714 (24.3%)
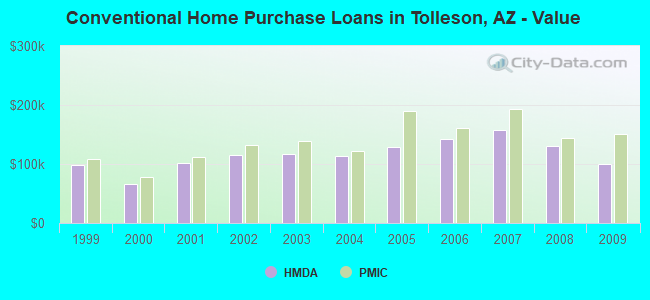
Property values in Tolleson, AZ

Tolleson, Arizona accommodation & food services, waste management - Economy and Business Data
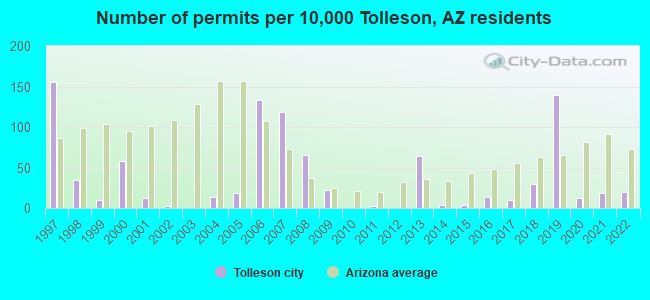
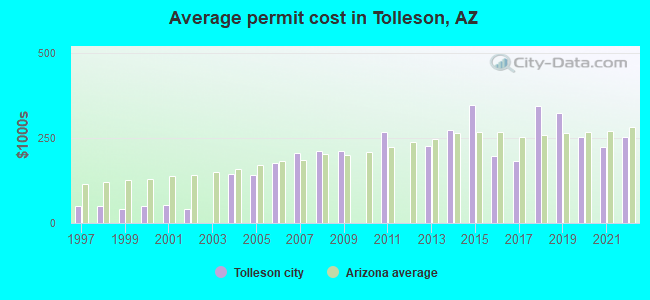
Single-family new house construction building permits:
- 2022: 10 buildings, average cost: $254,300
- 2021: 9 buildings, average cost: $222,700
- 2020: 6 buildings, average cost: $251,900
- 2019: 69 buildings, average cost: $322,600
- 2018: 15 buildings, average cost: $345,000
- 2017: 5 buildings, average cost: $182,400
- 2016: 7 buildings, average cost: $195,800
- 2015: 2 buildings, average cost: $347,800
- 2014: 2 buildings, average cost: $272,800
- 2013: 32 buildings, average cost: $227,400
- 2011: 1 building, cost: $266,800
- 2009: 11 buildings, average cost: $212,500
- 2008: 33 buildings, average cost: $213,300
- 2007: 59 buildings, average cost: $204,800
- 2006: 66 buildings, average cost: $174,600
- 2005: 9 buildings, average cost: $141,400
- 2004: 7 buildings, average cost: $144,400
- 2002: 1 building, cost: $40,000
- 2001: 6 buildings, average cost: $52,000
- 2000: 29 buildings, average cost: $48,600
- 1999: 5 buildings, average cost: $40,000
- 1998: 17 buildings, average cost: $49,900
- 1997: 77 buildings, average cost: $50,100
| Here: | 3.3% |
| Arizona: | 3.8% |
Population change in the 1990s: +475 (+10.6%).
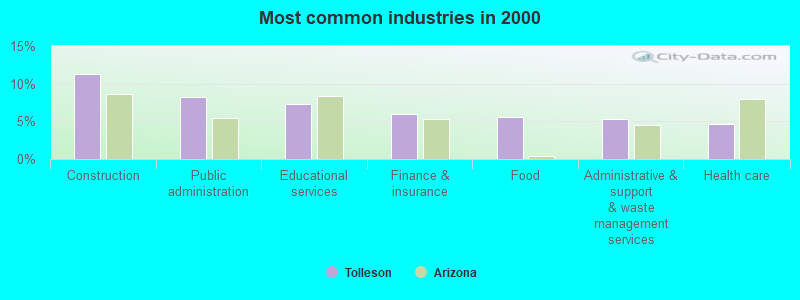
- Construction (11.3%)
- Public administration (8.2%)
- Educational services (7.3%)
- Finance & insurance (6.0%)
- Food (5.6%)
- Administrative & support & waste management services (5.3%)
- Health care (4.6%)
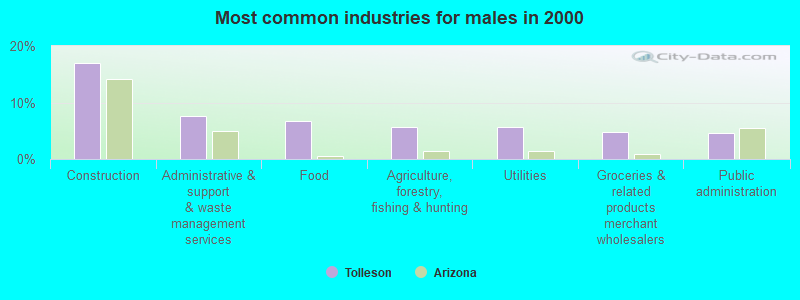
- Construction (17.0%)
- Administrative & support & waste management services (7.5%)
- Food (6.7%)
- Agriculture, forestry, fishing & hunting (5.6%)
- Utilities (5.6%)
- Groceries & related products merchant wholesalers (4.7%)
- Public administration (4.6%)
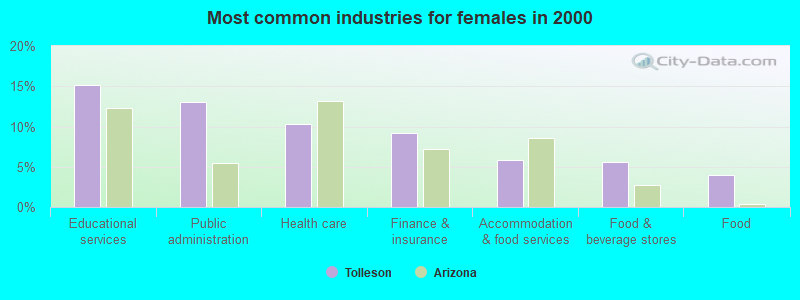
- Educational services (15.2%)
- Public administration (13.1%)
- Health care (10.3%)
- Finance & insurance (9.2%)
- Accommodation & food services (5.8%)
- Food & beverage stores (5.6%)
- Food (4.0%)
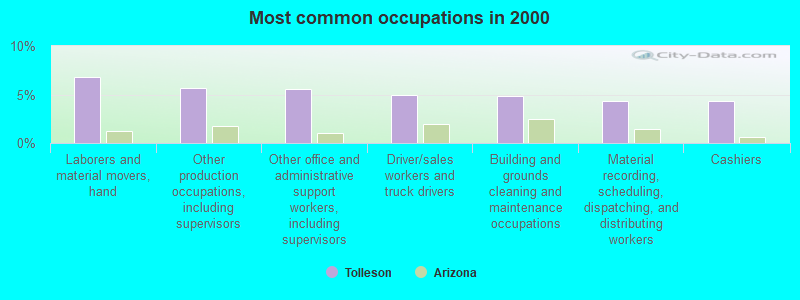
- Laborers and material movers, hand (6.8%)
- Other production occupations, including supervisors (5.7%)
- Other office and administrative support workers, including supervisors (5.6%)
- Driver/sales workers and truck drivers (5.0%)
- Building and grounds cleaning and maintenance occupations (4.9%)
- Material recording, scheduling, dispatching, and distributing workers (4.4%)
- Cashiers (4.3%)
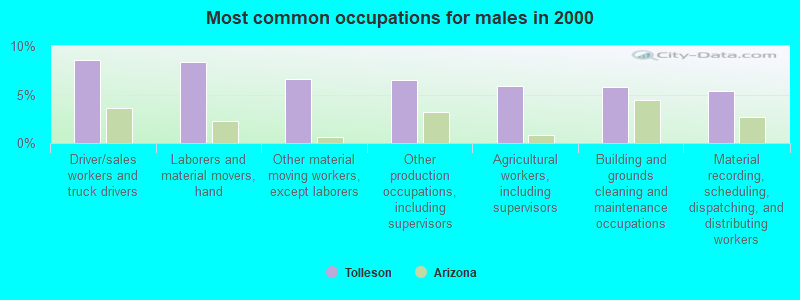
- Driver/sales workers and truck drivers (8.6%)
- Laborers and material movers, hand (8.3%)
- Other material moving workers, except laborers (6.6%)
- Other production occupations, including supervisors (6.5%)
- Agricultural workers, including supervisors (5.9%)
- Building and grounds cleaning and maintenance occupations (5.8%)
- Material recording, scheduling, dispatching, and distributing workers (5.4%)
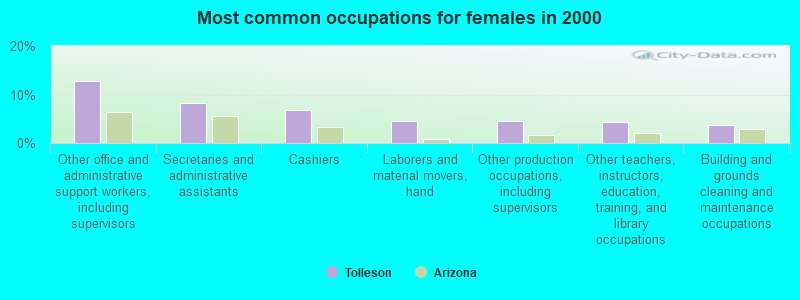
- Other office and administrative support workers, including supervisors (12.7%)
- Secretaries and administrative assistants (8.2%)
- Cashiers (6.8%)
- Laborers and material movers, hand (4.6%)
- Other production occupations, including supervisors (4.6%)
- Other teachers, instructors, education, training, and library occupations (4.4%)
- Building and grounds cleaning and maintenance occupations (3.6%)
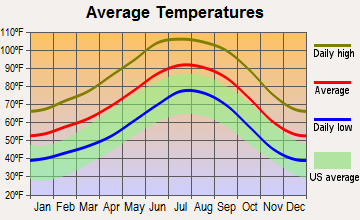
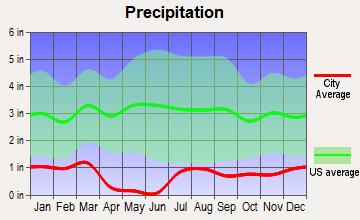
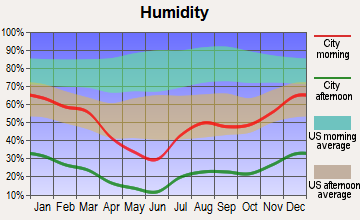
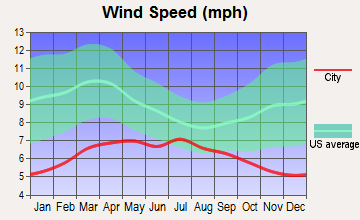
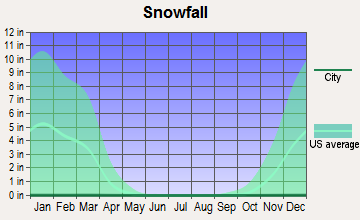
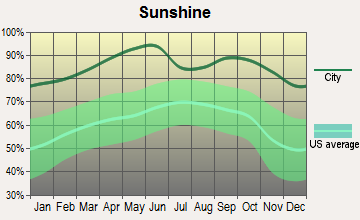
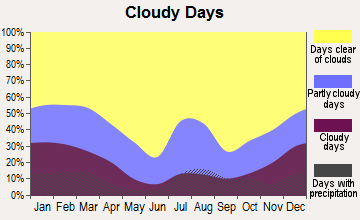
Average climate in Tolleson, Arizona
Based on data reported by over 4,000 weather stations
|
|

(lower is better)
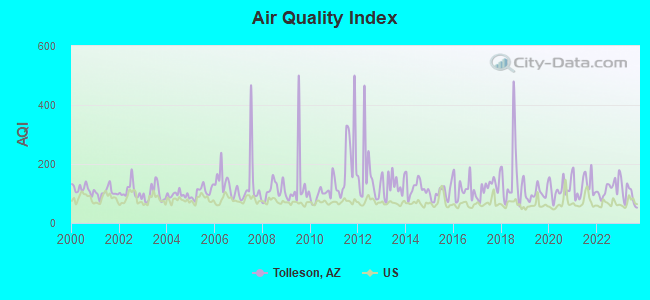
Air Quality Index (AQI) level in 2023 was 95.7. This is worse than average.
| City: | 95.7 |
| U.S.: | 72.6 |
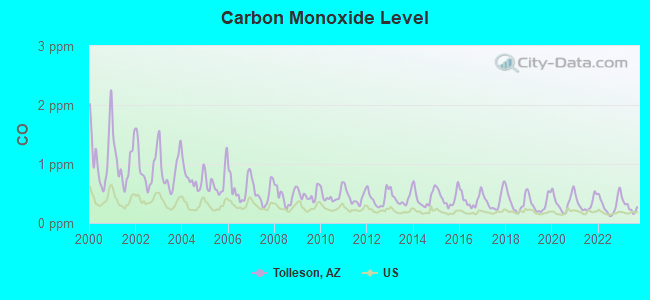
Carbon Monoxide (CO) [ppm] level in 2023 was 0.279. This is about average. Closest monitor was 4.0 miles away from the city center.
| City: | 0.279 |
| U.S.: | 0.251 |
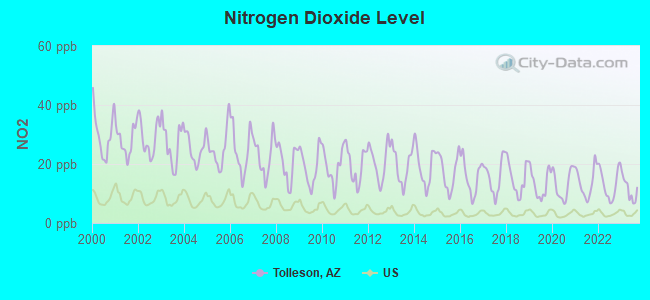
Nitrogen Dioxide (NO2) [ppb] level in 2023 was 11.4. This is significantly worse than average. Closest monitor was 6.0 miles away from the city center.
| City: | 11.4 |
| U.S.: | 5.1 |
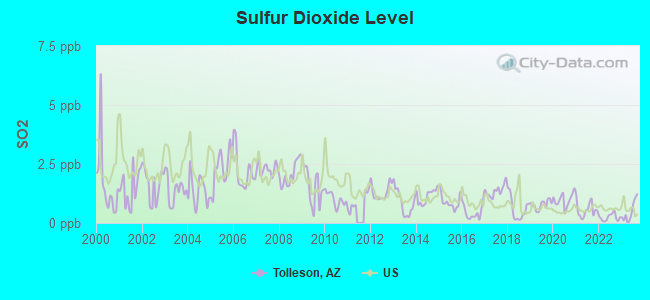
Sulfur Dioxide (SO2) [ppb] level in 2023 was 0.478. This is significantly better than average. Closest monitor was 6.9 miles away from the city center.
| City: | 0.478 |
| U.S.: | 1.515 |
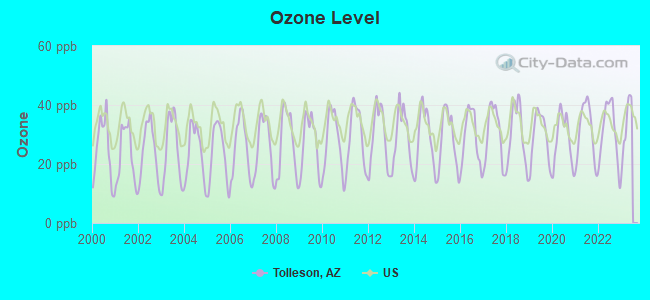
Ozone [ppb] level in 2022 was 30.7. This is about average. Closest monitor was 4.0 miles away from the city center.
| City: | 30.7 |
| U.S.: | 33.3 |
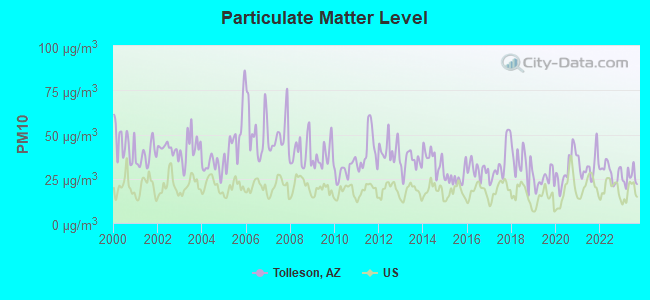
Particulate Matter (PM10) [µg/m3] level in 2023 was 25.6. This is worse than average. Closest monitor was 4.0 miles away from the city center.
| City: | 25.6 |
| U.S.: | 19.2 |
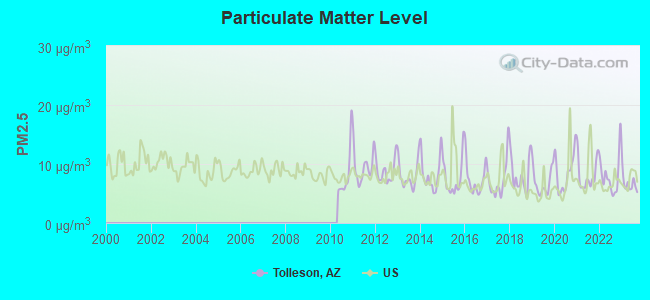
Particulate Matter (PM2.5) [µg/m3] level in 2023 was 6.67. This is better than average. Closest monitor was 3.7 miles away from the city center.
| City: | 6.67 |
| U.S.: | 8.11 |
Earthquake activity:
Tolleson-area historical earthquake activity is significantly above Arizona state average. It is 2601% greater than the overall U.S. average.On 6/28/1992 at 11:57:34, a magnitude 7.6 (6.2 MB, 7.6 MS, 7.3 MW, Depth: 0.7 mi, Class: Major, Intensity: VIII - XII) earthquake occurred 250.9 miles away from the city center, causing 3 deaths (1 shaking deaths, 2 other deaths) and 400 injuries, causing $100,000,000 total damage and $40,000,000 insured losses
On 5/19/1940 at 04:36:40, a magnitude 7.2 (7.2 UK) earthquake occurred 199.5 miles away from Tolleson center, causing $33,000,000 total damage
On 10/16/1999 at 09:46:44, a magnitude 7.4 (6.3 MB, 7.4 MS, 7.2 MW, 7.3 ML) earthquake occurred 250.8 miles away from Tolleson center
On 12/31/1934 at 18:45:56, a magnitude 7.1 (7.1 UK) earthquake occurred 209.9 miles away from Tolleson center
On 10/15/1979 at 23:16:54, a magnitude 7.0 (5.7 MB, 6.9 MS, 7.0 ML, 6.4 MW) earthquake occurred 200.8 miles away from the city center
On 7/21/1952 at 11:52:14, a magnitude 7.7 (7.7 UK) earthquake occurred 400.2 miles away from Tolleson center, causing $50,000,000 total damage
Magnitude types: body-wave magnitude (MB), local magnitude (ML), surface-wave magnitude (MS), moment magnitude (MW)
Natural disasters:
The number of natural disasters in Maricopa County (16) is near the US average (15).Major Disasters (Presidential) Declared: 11
Emergencies Declared: 1
Causes of natural disasters: Floods: 10, Storms: 9, Fires: 3, Flash Flood: 1, Heavy Rain: 1, Hurricane: 1, Tornado: 1, Wind: 1, Other: 1 (Note: some incidents may be assigned to more than one category).
Hospitals and medical centers near Tolleson:
- BANNER ESTRELLA MEDICAL CENTER Acute Care Hospitals (about 3 miles away; PHOENIX, AZ)
- AVONDALE DIALYSIS (FMC) (Dialysis Facility, about 3 miles away; AVONDALE, AZ)
- ESTRELLA DIALYSIS CENTER (FMC) (Dialysis Facility, about 5 miles away; PHOENIX, AZ)
- AVONDALE DIALYSIS (DSI) (Dialysis Facility, about 5 miles away; AVONDALE, AZ)
- SOUTHWEST KIDNEY DIALYSIS - MARYVALE (DVA) (Dialysis Facility, about 6 miles away; PHOENIX, AZ)
- PALM VALLEY REHAB AND CARE CTR (Nursing Home, about 6 miles away; GOODYEAR, AZ)
- PALM VALLEY DIALYSIS (FMC) (Dialysis Facility, about 6 miles away; GOODYEAR, AZ)
Heliports located in Tolleson:
Amtrak stations near Tolleson:
- 11 miles: PHOENIX (401 W. HARRISON ST.) - Bus Station . Services: ticket office, enclosed waiting area, public restrooms, public payphones, vending machines, free short-term parking, paid long-term parking, taxi stand.
- 12 miles: PHOENIX NORTHWEST (PHOENIX, 8101 BLACK CANYON FWY.) - Bus Station . Services: public payphones, call for taxi service.
- 15 miles: PHOENIX AIRPORT (PHOENIX, TERMINAL 2) - Bus Station . Services: enclosed waiting area, public restrooms, public payphones, full-service food facilities, paid short-term parking, paid long-term parking, car rental agency, taxi stand, intercity bus service, public transit connection.
Colleges/universities with over 2000 students nearest to Tolleson:
- Universal Technical Institute of Arizona Inc (about 2 miles; Avondale, AZ; Full-time enrollment: 3,860)
- Estrella Mountain Community College (about 6 miles; Avondale, AZ; FT enrollment: 4,932)
- Grand Canyon University (about 9 miles; Phoenix, AZ; FT enrollment: 44,186)
- Glendale Community College (about 10 miles; Glendale, AZ; FT enrollment: 12,533)
- Phoenix College (about 10 miles; Phoenix, AZ; FT enrollment: 7,001)
- Arizona State University-Downtown Phoenix (about 11 miles; Phoenix, AZ; FT enrollment: 9,515)
- Argosy University-Phoenix Online Division (about 12 miles; Phoenix, AZ; FT enrollment: 8,840)
Public schools in Tolleson:
- TOLLESON UNION HIGH SCHOOL (Students: 2,197, Location: 9419 WEST VAN BUREN)
- PORFIRIO H. GONZALES ELEMENTARY SCHOOL (Students: 958, Location: 9401 W. GARFIELD ST.)
- DOS RIOS ELEMENTARY (Students: 873, Location: 2150 S. 87TH AVENUE)
- ARTS ACADEMY AT ESTRELLA MOUNTAIN (Students: 813, Location: 2504 SOUTH 91ST AVE., Charter school)
- UNIVERSITY HIGH SCHOOL (Students: 796, Location: 9419 WEST VAN BUREN STREET)
- TRES RIOS ELEMENTARY SCHOOL (Students: 778, Location: 5025 S. 103RD AVENUE)
- HURLEY RANCH ELEMENTARY (Students: 774, Location: 8950 W. ILLINI ST.)
- SIERRA LINDA HIGH SCHOOL (Students: 623, Location: 9801 W. VAN BUREN STREET)
- ARIZONA DESERT ELEMENTARY SCHOOL (Students: 435, Location: 8803 W. VAN BUREN STREET)
- WEST-MEC - TOLLESON UNION HIGH SCHOOL (Location: 9419 W. VAN BUREN AVENUE)
- COUNTRY PLACE ELEMENTARY (Location: 10207 W. COUNTRY PLACE BLVD.)
- TOLLESON #206 (Location: 9801 WEST VAN BUREN STREET)
- UNION ELEMENTARY SCHOOL (Location: 3834 S. 91ST AVE.)
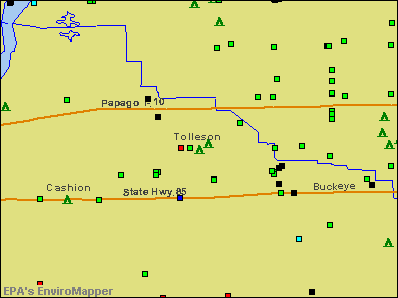
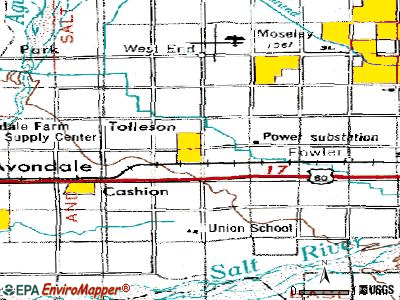
Points of interest:
Notable locations in Tolleson: Cashion Substation (A), Tolleson Town Hall (B), Tolleson Fire Department (C), Tolleson Police Department (D). Display/hide their locations on the map
Churches in Tolleson include: Blessed Sacrament Church (A), Tolleson Christian Church (B), Iglesia Fuente de Viva (C). Display/hide their locations on the map
Parks in Tolleson include: Tolleson Town Park Number Two (1), Tolleson Town Park Number One (2), Cowden City Park (3). Display/hide their locations on the map
Hotels: Comfort Suites Tolleson (8421 West McDowell Road), Econo Lodge Tolleson (1520 North 84th Drive), Candlewood Suites (1520 North 84th Drive).
Court: Maricopa County Government - Justice of the Peace- Tolleson Justice C (9550 West Van Buren Street Suite 6).
Birthplace of: Merle Keagle - Girls Professional Baseball League player.
| This city: | 3.3 people |
| Arizona: | 2.6 people |
| This city: | 79.5% |
| Whole state: | 66.2% |
| This city: | 9.3% |
| Whole state: | 7.8% |
Likely homosexual households (counted as self-reported same-sex unmarried-partner households)
- Lesbian couples: 0.4% of all households
- Gay men: 0.2% of all households
Banks with branches in Tolleson (2011 data):
- JPMorgan Chase Bank, National Association: Tolleson at 2715 99th Avenue, branch established on 2006/12/01. Info updated 2011/11/10: Bank assets: $1,811,678.0 mil, Deposits: $1,190,738.0 mil, headquarters in Columbus, OH, positive income, International Specialization, 5577 total offices, Holding Company: Jpmorgan Chase & Co.
- Bank of the West: Tolleson Branch at 9502 West Van Buren Street, branch established on 1946/11/01. Info updated 2009/11/16: Bank assets: $62,408.3 mil, Deposits: $43,995.2 mil, headquarters in San Francisco, CA, positive income, 647 total offices, Holding Company: Bnp Paribas
For population 15 years and over in Tolleson:
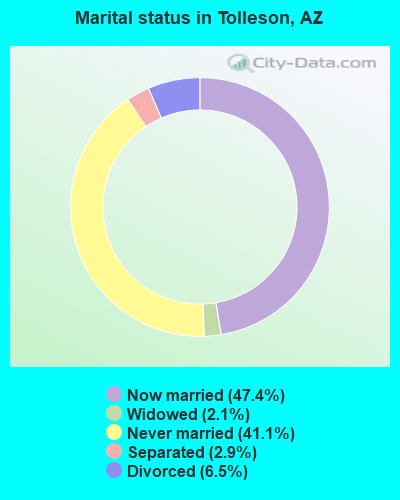
- Never married: 41.1%
- Now married: 47.4%
- Separated: 2.9%
- Widowed: 2.1%
- Divorced: 6.5%
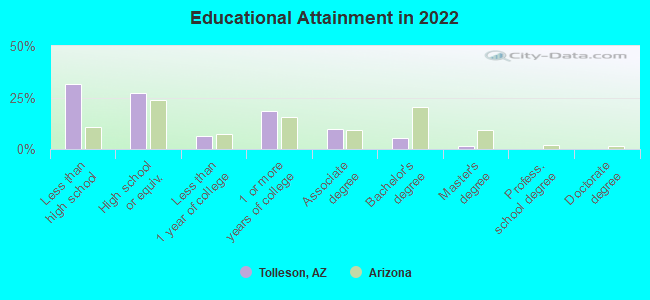
For population 25 years and over in Tolleson:
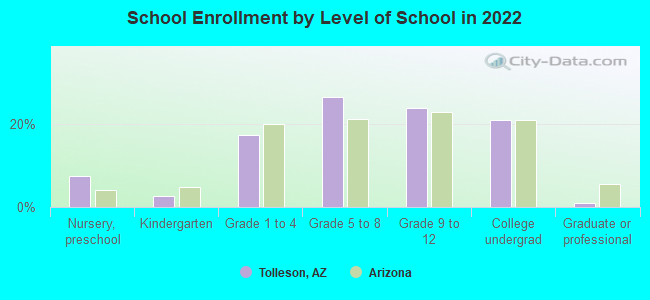
- High school or higher: 68.0%
- Bachelor's degree or higher: 6.4%
- Graduate or professional degree: 1.3%
- Unemployed: 4.3%
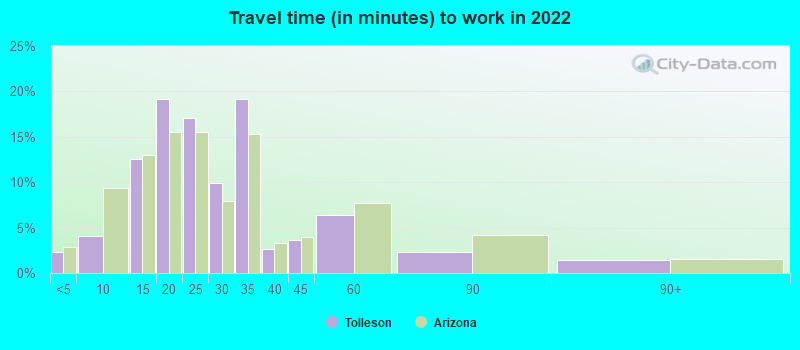
- Mean travel time to work (commute): 17.8 minutes
| Here: | 20.1 |
| Arizona average: | 12.2 |
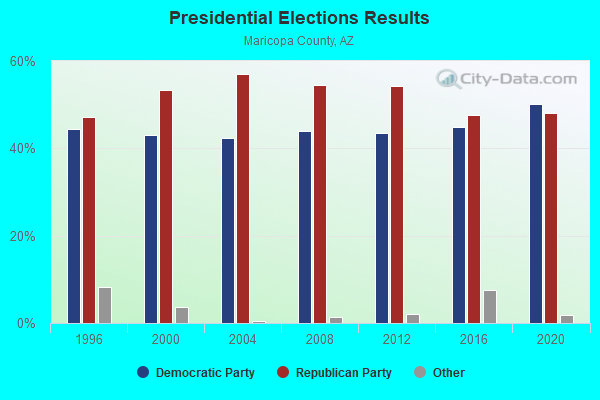
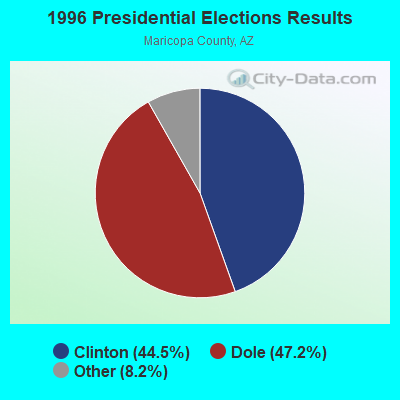
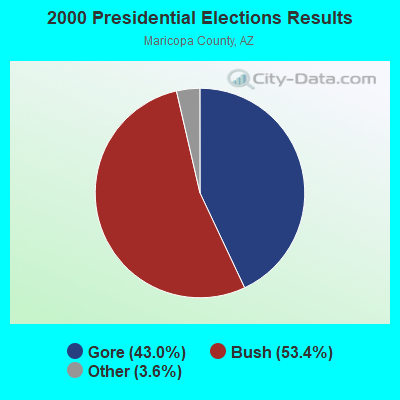
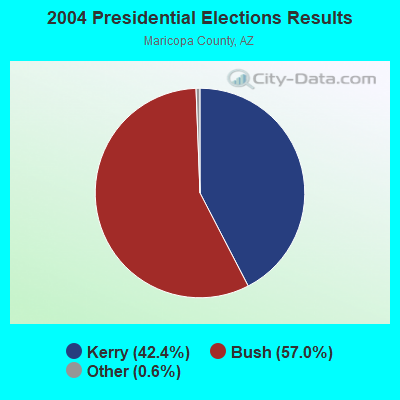
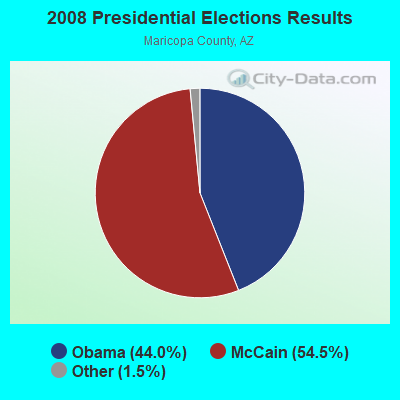
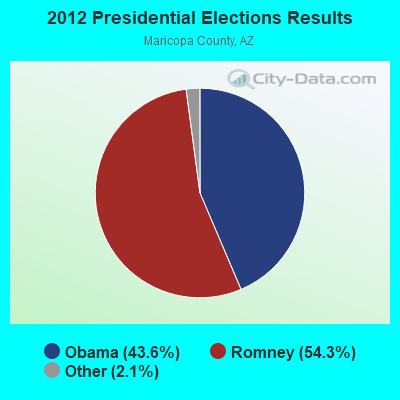
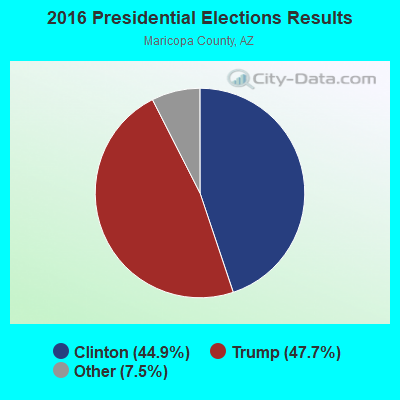
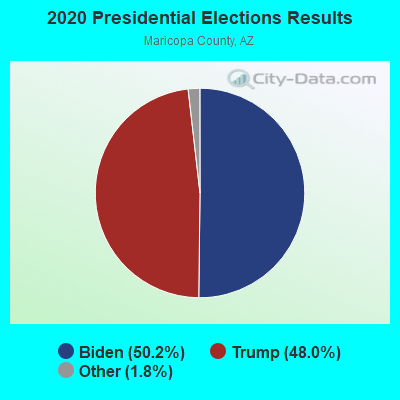
Graphs represent county-level data. Detailed 2008 Election Results
Religion statistics for Tolleson, AZ (based on Maricopa County data)
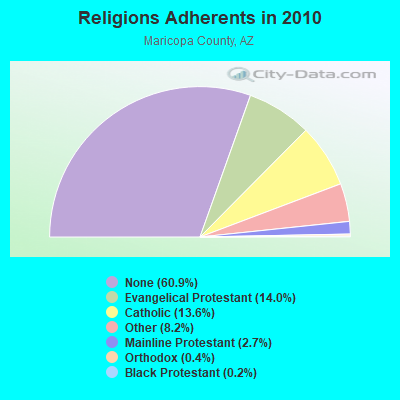
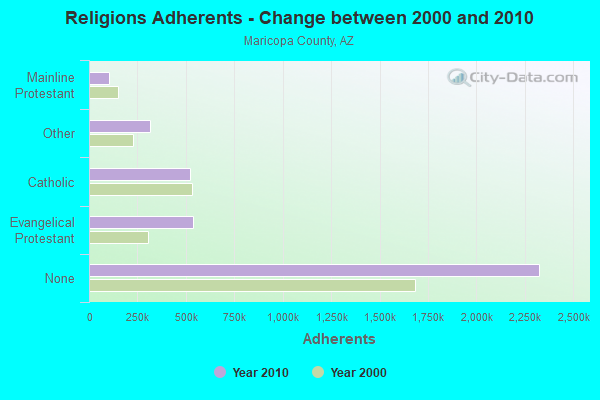
| Religion | Adherents | Congregations |
|---|---|---|
| Evangelical Protestant | 534,453 | 1,206 |
| Catholic | 520,651 | 100 |
| Other | 312,574 | 680 |
| Mainline Protestant | 104,145 | 241 |
| Orthodox | 13,379 | 24 |
| Black Protestant | 6,278 | 48 |
| None | 2,325,637 | - |
Food Environment Statistics:
| Maricopa County: | 1.30 / 10,000 pop. |
| Arizona: | 1.36 / 10,000 pop. |
| Maricopa County: | 0.16 / 10,000 pop. |
| State: | 0.14 / 10,000 pop. |
| Maricopa County: | 0.57 / 10,000 pop. |
| Arizona: | 0.55 / 10,000 pop. |
| This county: | 1.99 / 10,000 pop. |
| State: | 2.47 / 10,000 pop. |
| Maricopa County: | 5.86 / 10,000 pop. |
| State: | 6.21 / 10,000 pop. |
| This county: | 7.7% |
| Arizona: | 8.0% |
| Maricopa County: | 22.5% |
| Arizona: | 22.8% |
| This county: | 14.8% |
| Arizona: | 14.2% |
Health and Nutrition:
| Tolleson: | 46.5% |
| Arizona: | 49.0% |
| This city: | 46.4% |
| State: | 47.3% |
| This city: | 28.6 |
| State: | 28.5 |
| Tolleson: | 23.1% |
| Arizona: | 20.8% |
| Tolleson: | 9.1% |
| Arizona: | 10.2% |
| Tolleson: | 6.7 |
| State: | 6.8 |
| Tolleson: | 32.6% |
| State: | 33.5% |
| Tolleson: | 54.3% |
| State: | 56.1% |
| This city: | 80.8% |
| State: | 79.4% |
More about Health and Nutrition of Tolleson, AZ Residents
| Local government employment and payroll (March 2022) | |||||
| Function | Full-time employees | Monthly full-time payroll | Average yearly full-time wage | Part-time employees | Monthly part-time payroll |
|---|---|---|---|---|---|
| Police Protection - Officers | 33 | $268,355 | $97,584 | 0 | $0 |
| Firefighters | 28 | $289,482 | $124,064 | 0 | $0 |
| Streets and Highways | 25 | $149,824 | $71,916 | 0 | $0 |
| Police - Other | 19 | $104,082 | $65,736 | 0 | $0 |
| Sewerage | 17 | $129,052 | $91,096 | 0 | $0 |
| Other Government Administration | 16 | $120,190 | $90,143 | 0 | $0 |
| Water Supply | 12 | $87,660 | $87,660 | 0 | $0 |
| Judicial and Legal | 8 | $66,430 | $99,645 | 0 | $0 |
| Welfare | 7 | $41,078 | $70,419 | 2 | $4,697 |
| Financial Administration | 6 | $53,710 | $107,420 | 0 | $0 |
| Fire - Other | 4 | $42,795 | $128,385 | 0 | $0 |
| Housing and Community Development (Local) | 4 | $37,698 | $113,094 | 0 | $0 |
| Local Libraries | 4 | $25,147 | $75,441 | 1 | $1,906 |
| Parks and Recreation | 4 | $25,032 | $75,096 | 0 | $0 |
| Totals for Government | 187 | $1,440,535 | $92,441 | 3 | $6,603 |
Tolleson government finances - Expenditure in 2021 (per resident):
- Construction - General Public Buildings: $1,493,000 ($205.70)
- Current Operations - Police Protection: $7,559,000 ($1041.47)
General - Other: $7,221,000 ($994.90)
Sewerage: $6,649,000 ($916.09)
Water Utilities: $6,072,000 ($836.59)
Local Fire Protection: $5,578,000 ($768.53)
Central Staff Services: $3,005,000 ($414.03)
Parks and Recreation: $1,783,000 ($245.66)
Regular Highways: $1,427,000 ($196.61)
Health - Other: $1,201,000 ($165.47)
Judicial and Legal Services: $836,000 ($115.18)
Libraries: $787,000 ($108.43)
Financial Administration: $762,000 ($104.99)
Housing and Community Development: $499,000 ($68.75)
Solid Waste Management: $391,000 ($53.87)
Protective Inspection and Regulation - Other: $337,000 ($46.43)
Transit Utilities: $65,000 ($8.96)
- General - Interest on Debt: $1,626,000 ($224.03)
- Other Capital Outlay - Police Protection: $775,000 ($106.78)
General Public Building: $500,000 ($68.89)
Local Fire Protection: $142,000 ($19.56)
Central Staff Services: $132,000 ($18.19)
Regular Highways: $118,000 ($16.26)
- Total Salaries and Wages: $15,493,000 ($2134.61)
Tolleson government finances - Revenue in 2021 (per resident):
- Charges - Sewerage: $7,049,000 ($971.20)
Other: $2,946,000 ($405.90)
Solid Waste Management: $448,000 ($61.72)
Parks and Recreation: $5,000 ($0.69)
- Federal Intergovernmental - Other: $54,000 ($7.44)
- Local Intergovernmental - Other: $594,000 ($81.84)
- Miscellaneous - Donations From Private Sources: $1,271,000 ($175.12)
Fines and Forfeits: $183,000 ($25.21)
Rents: $126,000 ($17.36)
Interest Earnings: $122,000 ($16.81)
Sale of Property: $21,000 ($2.89)
- Revenue - Water Utilities: $8,144,000 ($1122.07)
- State Intergovernmental - General Local Government Support: $2,278,000 ($313.86)
Highways: $510,000 ($70.27)
Other: $207,000 ($28.52)
- Tax - General Sales and Gross Receipts: $34,054,000 ($4691.93)
Property: $9,092,000 ($1252.69)
Other License: $1,225,000 ($168.78)
Occupation and Business License - Other: $70,000 ($9.64)
Public Utilities Sales: $55,000 ($7.58)
Tolleson government finances - Debt in 2021 (per resident):
- Long Term Debt - Beginning Outstanding - Unspecified Public Purpose: $33,093,000 ($4559.52)
Outstanding Unspecified Public Purpose: $28,969,000 ($3991.32)
Retired Unspecified Public Purpose: $4,124,000 ($568.20)
Tolleson government finances - Cash and Securities in 2021 (per resident):
- Bond Funds - Cash and Securities: $14,595,000 ($2010.88)
- Other Funds - Cash and Securities: $87,392,000 ($12040.78)
5.80% of this county's 2021 resident taxpayers lived in other counties in 2020 ($92,013 average adjusted gross income)
| Here: | 5.80% |
| Arizona average: | 6.85% |
0.02% of residents moved from foreign countries ($227 average AGI)
Maricopa County: 0.02% Arizona average: 0.03%
Top counties from which taxpayers relocated into this county between 2020 and 2021:
| from Pinal County, AZ | |
| from Los Angeles County, CA | |
| from Pima County, AZ |
5.04% of this county's 2020 resident taxpayers moved to other counties in 2021 ($76,911 average adjusted gross income)
| Here: | 5.04% |
| Arizona average: | 5.72% |
0.02% of residents moved to foreign countries ($234 average AGI)
Maricopa County: 0.02% Arizona average: 0.03%
Top counties to which taxpayers relocated from this county between 2020 and 2021:
| to Pinal County, AZ | |
| to Pima County, AZ | |
| to Yavapai County, AZ |
| Businesses in Tolleson, AZ | ||||
| Name | Count | Name | Count | |
|---|---|---|---|---|
| Arby's | 1 | Kmart | 1 | |
| AutoZone | 1 | Kohl's | 1 | |
| CarMax | 1 | Payless | 1 | |
| Circle K | 4 | Pizza Hut | 1 | |
| Comfort Suites | 1 | SONIC Drive-In | 1 | |
| Cricket Wireless | 2 | Sears | 1 | |
| Famous Footwear | 1 | Sprint Nextel | 1 | |
| Fashion Bug | 1 | Starbucks | 1 | |
| FedEx | 1 | Taco Bell | 1 | |
| Firestone Complete Auto Care | 1 | Target | 1 | |
| GameStop | 1 | U-Haul | 1 | |
| Jack In The Box | 2 | Waffle House | 1 | |
Strongest AM radio stations in Tolleson:
- KMYL (1190 AM; 5 kW; TOLLESON, AZ; Owner: INTERSTATE B/C SYSTEM OF AZ, INC.)
- KXEM (1010 AM; 15 kW; TOLLESON, AZ; Owner: JAMES CRYSTAL ENTERPRISES OF PHOENIX, INC.)
- KPXQ (1360 AM; 50 kW; GLENDALE, AZ; Owner: COMMON GROUND BROADCASTING, INC.)
- KGME (910 AM; 5 kW; PHOENIX, AZ; Owner: AMFM RADIO LICENSES, L.L.C.)
- KASA (1540 AM; 10 kW; PHOENIX, AZ; Owner: KASA RADIO HOGAR, INC.)
- KFNX (1100 AM; 50 kW; CAVE CREEK, AZ; Owner: NORTH AMERICAN BROADCASTING CO., INC.)
- KMIK (1580 AM; 50 kW; TEMPE, AZ; Owner: ABC, INC.)
- KPHX (1480 AM; 5 kW; PHOENIX, AZ; Owner: CONTINENTAL BROADCASTING CORP. OF ARIZONA, INC.)
- KXEG (1280 AM; 2 kW; PHOENIX, AZ; Owner: MORTENSON BROADCASTING COMPANY OF ARIZONA, LLC)
- KFYI (550 AM; 5 kW; PHOENIX, AZ; Owner: AMFM RADIO LICENSES, L.L.C.)
- KTAR (620 AM; 5 kW; PHOENIX, AZ; Owner: EMMIS RADIO LICENSE CORPORATION)
- KMIA (710 AM; 50 kW; BLACK CANYON CITY, AZ; Owner: ENTRAVISION HOLDINGS, LLC)
- KFNN (1510 AM; 22 kW; MESA, AZ; Owner: CRC BROADCASTING COMPANY, INC.)
Strongest FM radio stations in Tolleson:
- KSLX-FM (100.7 FM; SCOTTSDALE, AZ; Owner: CACTUS RADIO, INC.)
- KKLT (98.7 FM; PHOENIX, AZ; Owner: EMMIS RADIO LICENSE CORPORATION)
- K220GO (91.9 FM; TEMPE, AZ; Owner: CALVARY CHAPEL OF TWIN FALLS, INC.)
- KZON (101.5 FM; PHOENIX, AZ; Owner: INFINITY RADIO OPERATIONS INC.)
- KKFR (92.3 FM; GLENDALE, AZ; Owner: EMMIS RADIO LICENSE CORPORATION)
- KMLE (107.9 FM; CHANDLER, AZ; Owner: INFINITY RADIO OPERATIONS INC.)
- KESZ (99.9 FM; PHOENIX, AZ; Owner: CLEAR CHANNEL BROADCASTING LICENSES, INC.)
- KOOL-FM (94.5 FM; PHOENIX, AZ; Owner: INFINITY RADIO OPERATIONS INC.)
- KNIX-FM (102.5 FM; PHOENIX, AZ; Owner: CLEAR CHANNEL BROADCASTING LICENSES, INC.)
- KUPD (97.9 FM; TEMPE, AZ; Owner: TEMPE RADIO, INC.)
- KJZZ (91.5 FM; PHOENIX, AZ; Owner: MARICOPA COUNTY COMM. COLLEGE DIST.)
- KFLR-FM (90.3 FM; PHOENIX, AZ; Owner: FAMILY LIFE BROADCASTING, INC.)
- KYOT-FM (95.5 FM; PHOENIX, AZ; Owner: AMFM RADIO LICENSES, L.L.C.)
- KMXP (96.9 FM; PHOENIX, AZ; Owner: CITICASTERS LICENSES, L.P.)
- K240CV (95.9 FM; PHOENIX, AZ; Owner: ZORBA RESOURCES, INC.)
- KZZP (104.7 FM; MESA, AZ; Owner: CITICASTERS LICENSES, L.P.)
- KDKB (93.3 FM; MESA, AZ; Owner: MESA RADIO, INC.)
- K207CO (89.3 FM; SUN LAKES, AZ; Owner: MARICOPA CNTY COMMUNITY COLLEGE DIST)
- K216FO (91.1 FM; GUADALUPE, AZ; Owner: WORLD RADIO NETWORK, INC.)
- KLNZ (103.5 FM; GLENDALE, AZ; Owner: ENTRAVISION HOLDINGS, LLC)
TV broadcast stations around Tolleson:
- KAET (Channel 8; PHOENIX, AZ; Owner: ARIZONA BOARD OF REGENTS)
- K43GV (Channel 43; PHOENIX, AZ; Owner: TELEVISION APOGEO DE PHOENIX, LLC)
- KPHO-TV (Channel 5; PHOENIX, AZ; Owner: MEREDITH CORPORATION)
- KTVK (Channel 3; PHOENIX, AZ; Owner: KTVK, INC.)
- KPPX (Channel 51; TOLLESON, AZ; Owner: AMERICA 51, L.P.)
- KPNX (Channel 12; MESA, AZ; Owner: MULTIMEDIA HOLDINGS CORPORATION)
- KUTP (Channel 45; PHOENIX, AZ; Owner: FOX TELEVISION STATIONS, INC.)
- KSAZ-TV (Channel 10; PHOENIX, AZ; Owner: KSAZ LICENSE, INC.)
- KASW (Channel 61; PHOENIX, AZ; Owner: KASW-TV, INC.)
- K55EH (Channel 55; PHOENIX, AZ; Owner: KAZT, L.L.C.)
- KNXV-TV (Channel 15; PHOENIX, AZ; Owner: SCRIPPS HOWARD BROADCASTING COMPANY)
- KTVW-TV (Channel 33; PHOENIX, AZ; Owner: KTVW LICENSE PARTNERSHIP, G.P.)
- K53GF (Channel 53; PHOENIX, AZ; Owner: SPANISH INDEPENDENT BROADCAST NETWORK, LLC)
- KDRX-CA (Channel 48; PHOENIX, AZ; Owner: NBC TELEMUNDO PHOENIX, INC.)
- KFPH-CA (Channel 39; PHOENIX, AZ; Owner: TELEFUTURA PARTNERSHIP OF PHOENIX)
- KTVP-LP (Channel 64; PHOENIX, AZ; Owner: MAKO COMMUNICATIONS, LLC)
- KAZT-CA (Channel 27; PHOENIX, AZ; Owner: KAZT, L.L.C.)
- KDTP (Channel 39; PHOENIX, AZ; Owner: COMMUNITY TELEVISION EDUCATORS, INC.)
- KPAZ-TV (Channel 21; PHOENIX, AZ; Owner: TRINITY BROADCASTING OF ARIZONA, INC.)
- K25DM (Channel 25; PHOENIX, AZ; Owner: KDMA CHANNEL 25, INC.)
- KPHZ-LP (Channel 58; PHOENIX, AZ; Owner: NBC TELEMUNDO PHOENIX, INC.)
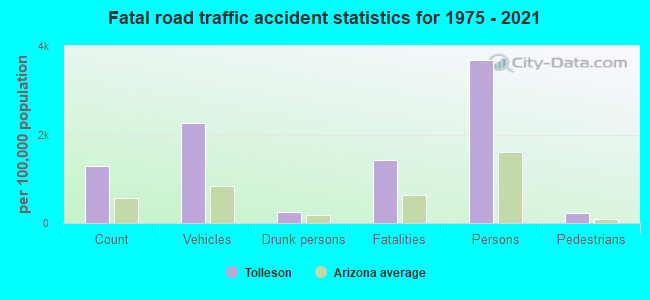
- National Bridge Inventory (NBI) Statistics
- 31Number of bridges
- 620ft / 189mTotal length
- $5,000Total costs
- 1,458,505Total average daily traffic
- 113,423Total average daily truck traffic
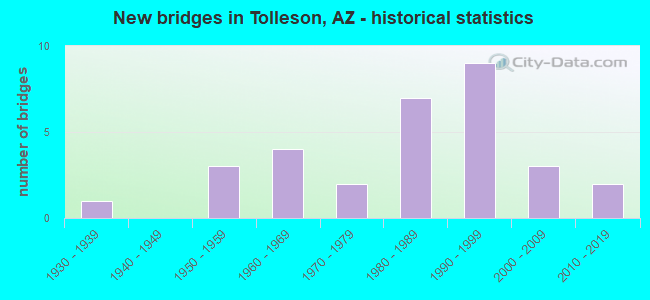
- New bridges - historical statistics
- 11930-1939
- 31950-1959
- 41960-1969
- 21970-1979
- 71980-1989
- 91990-1999
- 32000-2009
- 22010-2019
FCC Registered Antenna Towers: 41 (See the full list of FCC Registered Antenna Towers)
FCC Registered Commercial Land Mobile Towers: 1 (See the full list of FCC Registered Commercial Land Mobile Towers in Tolleson, AZ)
FCC Registered Broadcast Land Mobile Towers: 42 (See the full list of FCC Registered Broadcast Land Mobile Towers)
FCC Registered Microwave Towers: 32 (See the full list of FCC Registered Microwave Towers in this town)
FCC Registered Amateur Radio Licenses: 30 (See the full list of FCC Registered Amateur Radio Licenses in Tolleson)
FAA Registered Aircraft: 18 (See the full list of FAA Registered Aircraft in Tolleson)
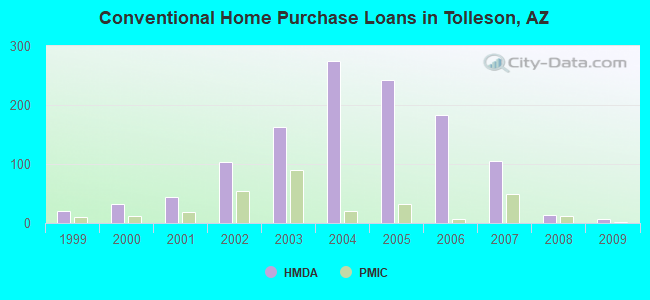
| Home Mortgage Disclosure Act Aggregated Statistics For Year 2009 (Based on 1 full tract) | ||||||||||||
| A) FHA, FSA/RHS & VA Home Purchase Loans | B) Conventional Home Purchase Loans | C) Refinancings | D) Home Improvement Loans | E) Loans on Dwellings For 5+ Families | F) Non-occupant Loans on < 5 Family Dwellings (A B C & D) | |||||||
|---|---|---|---|---|---|---|---|---|---|---|---|---|
| Number | Average Value | Number | Average Value | Number | Average Value | Number | Average Value | Number | Average Value | Number | Average Value | |
| LOANS ORIGINATED | 47 | $123,641 | 7 | $100,060 | 25 | $121,288 | 1 | $49,470 | 0 | $0 | 3 | $90,027 |
| APPLICATIONS APPROVED, NOT ACCEPTED | 1 | $80,130 | 0 | $0 | 8 | $184,999 | 0 | $0 | 0 | $0 | 1 | $48,480 |
| APPLICATIONS DENIED | 13 | $107,225 | 2 | $105,855 | 32 | $167,655 | 8 | $24,732 | 1 | $3,640,620 | 1 | $110,800 |
| APPLICATIONS WITHDRAWN | 15 | $131,445 | 2 | $105,855 | 6 | $131,412 | 2 | $14,840 | 0 | $0 | 1 | $63,320 |
| FILES CLOSED FOR INCOMPLETENESS | 5 | $92,994 | 0 | $0 | 2 | $98,435 | 0 | $0 | 0 | $0 | 1 | $173,130 |
Detailed HMDA statistics for the following Tracts: 0820.15 , 0821.00
| Private Mortgage Insurance Companies Aggregated Statistics For Year 2009 (Based on 1 full tract) | ||||
| A) Conventional Home Purchase Loans | B) Refinancings | |||
|---|---|---|---|---|
| Number | Average Value | Number | Average Value | |
| LOANS ORIGINATED | 1 | $150,370 | 1 | $95,960 |
| APPLICATIONS APPROVED, NOT ACCEPTED | 0 | $0 | 0 | $0 |
| APPLICATIONS DENIED | 0 | $0 | 1 | $106,840 |
| APPLICATIONS WITHDRAWN | 0 | $0 | 0 | $0 |
| FILES CLOSED FOR INCOMPLETENESS | 0 | $0 | 0 | $0 |
Detailed PMIC statistics for the following Tracts: 0821.00
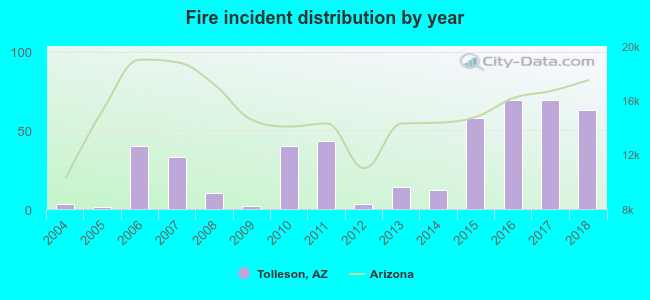
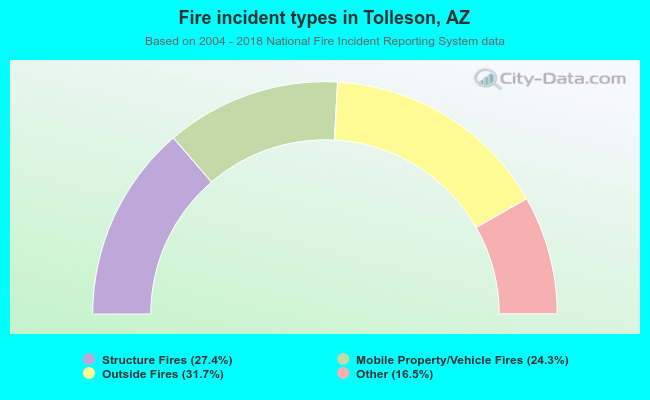
2004 - 2018 National Fire Incident Reporting System (NFIRS) incidents
- Fire incident types reported to NFIRS in Tolleson, AZ
- 14631.7%Outside Fires
- 12627.4%Structure Fires
- 11224.3%Mobile Property/Vehicle Fires
- 7616.5%Other
| Most common first names in Tolleson, AZ among deceased individuals | ||
| Name | Count | Lived (average) |
|---|---|---|
| William | 27 | 72.0 years |
| Jose | 21 | 70.9 years |
| Maria | 21 | 74.1 years |
| John | 19 | 72.3 years |
| James | 18 | 72.8 years |
| Mary | 18 | 71.1 years |
| Francisco | 13 | 74.9 years |
| Richard | 13 | 66.0 years |
| Joe | 13 | 70.5 years |
| Thomas | 12 | 68.9 years |
| Most common last names in Tolleson, AZ among deceased individuals | ||
| Last name | Count | Lived (average) |
|---|---|---|
| Martinez | 18 | 69.6 years |
| Hernandez | 17 | 69.8 years |
| Ramirez | 16 | 74.6 years |
| Garcia | 13 | 69.5 years |
| Gonzales | 12 | 73.1 years |
| Moreno | 11 | 74.9 years |
| Lopez | 10 | 72.7 years |
| Johnson | 10 | 74.9 years |
| Perez | 9 | 60.4 years |
| Camacho | 9 | 65.8 years |
Tolleson compared to Arizona state average:
- Median household income below state average.
- Unemployed percentage significantly below state average.
- Black race population percentage above state average.
- Hispanic race population percentage significantly above state average.
- Median age below state average.
- Foreign-born population percentage significantly above state average.
- Renting percentage above state average.
- Length of stay since moving in significantly above state average.
- Percentage of population with a bachelor's degree or higher significantly below state average.
Tolleson on our top lists:
- #3 on the list of "Top 101 cities with largest percentage of males in occupations: material moving occupations (population 5,000+)"
- #17 on the list of "Top 101 cities with the highest number of burglaries per 100,000 residents, excludes tourist destinations and others with a lot of outsiders visiting based on city industries data (population 5,000+)"
- #32 on the list of "Top 101 cities with largest percentage of females in occupations: material moving occupations (population 5,000+)"
- #45 on the list of "Top 101 cities with largest percentage of females in industries: other services, except public administration (population 5,000+)"
- #64 on the list of "Top 101 cities with largest percentage of males in industries: administrative and support and waste management services (population 5,000+)"
- #70 on the list of "Top 101 cities with largest percentage of females in occupations: building and grounds cleaning and maintenance occupations (population 5,000+)"
- #77 on the list of "Top 101 cities with the highest number of police officers per 1000 residents (population 5,000+)"
- #2 on the list of "Top 101 counties with the highest Nitrogen Dioxide air pollution readings in 2012 (ppm)"
- #3 on the list of "Top 101 counties with the highest total withdrawal of fresh water for public supply"
- #3 on the list of "Top 101 counties with the highest surface withdrawal of fresh water for public supply"
- #4 on the list of "Top 101 counties with the most Other congregations"
- #5 on the list of "Top 101 counties with the most Evangelical Protestant adherents (pop. 50,000+)"
|
|
Total of 21 patent applications in 2008-2025.