Eloy, Arizona
Eloy: The Bent Prop Restaurant in Eloy
Eloy: Eloy City Hall
Eloy: Pacacho Peak from over Eloy
Eloy: Local Eloy Golf Course
Eloy: Multi Family Housing in Eloy
Eloy: Lot in Eloy AZ
- add
your
Submit your own pictures of this city and show them to the world
- OSM Map
- General Map
- Google Map
- MSN Map
Population change since 2000: +64.3%
| Males: 12,151 | |
| Females: 4,891 |
| Median resident age: | 37.9 years |
| Arizona median age: | 38.8 years |
Zip codes: 85141.
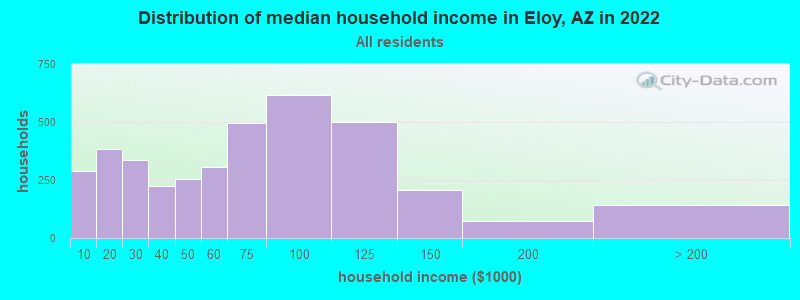
| Eloy: | $59,761 |
| AZ: | $74,568 |
Estimated per capita income in 2022: $17,919 (it was $9,194 in 2000)
Eloy city income, earnings, and wages data
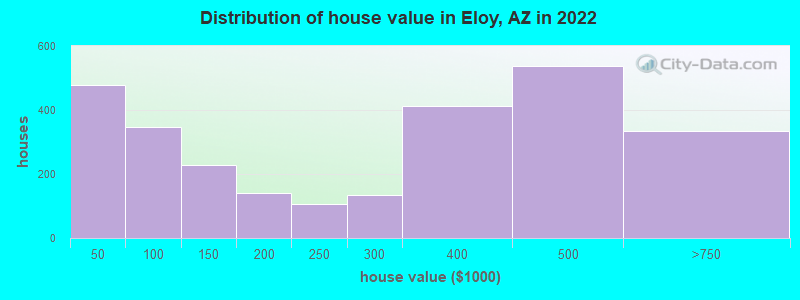
Estimated median house or condo value in 2022: $245,623 (it was $48,400 in 2000)
| Eloy: | $245,623 |
| AZ: | $402,800 |
Mean prices in 2022: all housing units: $190,649; detached houses: $223,565; townhouses or other attached units: $417,221; mobile homes: $44,341
Median gross rent in 2022: $1,073.
(5.7% for White Non-Hispanic residents, 49.6% for Black residents, 23.0% for Hispanic or Latino residents, 53.9% for American Indian residents, 32.8% for other race residents, 8.5% for two or more races residents)
Detailed information about poverty and poor residents in Eloy, AZ
Compare current foreclosures near Eloy, AZ:
| Photo | Address | Area | Beds / Baths | Price | Details |
|---|---|---|---|---|---|

|
#1
N Bandelier Dr
Eloy, AZ 85131
|
1,453 sq. feet
|
2 baths 3 beds |
show details | |

|
#2
N Main St
Eloy, AZ 85131
|
1,053 sq. feet
|
1 baths 2 beds |
show details | |

|
#3
S Picacho Heights Rd
Eloy, AZ 85131
|
1,013 sq. feet
|
2 baths 3 beds |
show details | |

|
#4
N Turquoise Dr
Eloy, AZ 85131
|
1,498 sq. feet
|
2 baths 3 beds |
show details | |

|
#5
W Cornman Rd
Eloy, AZ 85131
|
1,491 sq. feet
|
- baths - beds |
show details | |

|
#6
N Roble Cir
Eloy, AZ 85131
|
1,232 sq. feet
|
- baths - beds |
show details | |

|
#7
E 4th St
Eloy, AZ 85131
|
- sq. feet
|
- baths - beds |
show details | |

|
#8
W Paraiso Dr
Eloy, AZ 85131
|
- sq. feet
|
- baths - beds |
show details | |

|
#9
W Harmon Rd
Eloy, AZ 85131
|
- sq. feet
|
- baths - beds |
show details | |

|
#10
N La Siesta Dr
Eloy, AZ 85131
|
864 sq. feet
|
- baths - beds |
show details |
| Photo | Address | Area | Beds / Baths | Price | Details |
|---|---|---|---|---|---|

|
#11
N Kioha Dr
Eloy, AZ 85131
|
- sq. feet
|
- baths - beds |
show details | |

|
#12
E 7th St
Eloy, AZ 85131
|
- sq. feet
|
- baths - beds |
show details | |

|
#13
N Sunshine Blvd
Eloy, AZ 85131
|
1,064 sq. feet
|
- baths - beds |
show details | |

|
#14
W Posse Dr
Eloy, AZ 85131
|
- sq. feet
|
- baths - beds |
show details | |

|
#15
S Picacho Heights Rd
Eloy, AZ 85131
|
1,161 sq. feet
|
- baths - beds |
show details | |

|
#16
N Tewa Cir
Eloy, AZ 85131
|
- sq. feet
|
- baths - beds |
show details | |

|
#17
N Roble Cir
Eloy, AZ 85131
|
- sq. feet
|
- baths - beds |
show details | |

|
#18
N Paseo De Sonora
Casa Grande, AZ 85122
|
1,785 sq. feet
|
2 baths 3 beds |
show details | |

|
#19
N Sandalwood Dr
Casa Grande, AZ 85122
|
960 sq. feet
|
2 baths 2 beds |
show details | |

|
#20
E Dartmouth Dr
Casa Grande, AZ 85122
|
1,691 sq. feet
|
2 baths 4 beds |
show details |
| Photo | Address | Area | Beds / Baths | Price | Details |
|---|---|---|---|---|---|

|
#21
W Judi St
Casa Grande, AZ 85122
|
2,546 sq. feet
|
3 baths 3 beds |
show details | |

|
#22
W Almond Ave
Coolidge, AZ 85128
|
2,309 sq. feet
|
3 baths 4 beds |
show details | |

|
#23
W Basil Ave
Coolidge, AZ 85128
|
- sq. feet
|
2 baths 4 beds |
show details | |

|
#24
E Rosemary Trl
Casa Grande, AZ 85122
|
1,644 sq. feet
|
2 baths 4 beds |
show details | |

|
#25
W Basil Ave
Coolidge, AZ 85128
|
1,553 sq. feet
|
2 baths 3 beds |
show details | |

|
#26
E Autumn Sage Trl
Casa Grande, AZ 85122
|
1,360 sq. feet
|
2 baths 3 beds |
show details | |

|
#27
W Lemon Ave
Coolidge, AZ 85128
|
1,313 sq. feet
|
2 baths 2 beds |
show details | |

|
#28
N Wheeler Rd
Coolidge, AZ 85128
|
1,569 sq. feet
|
2 baths 4 beds |
show details | |

|
#29
N Coolidge Ave
Casa Grande, AZ 85122
|
1,898 sq. feet
|
2 baths 3 beds |
show details | |

|
#30
E Prickly Pear St
Casa Grande, AZ 85122
|
3,094 sq. feet
|
3 baths 4 beds |
show details |
| Photo | Address | Area | Beds / Baths | Price | Details |
|---|---|---|---|---|---|

|
#31
E Cholla St
Casa Grande, AZ 85122
|
1,961 sq. feet
|
2 baths 4 beds |
show details | |

|
#32
N Brown Ave
Casa Grande, AZ 85122
|
2,373 sq. feet
|
3 baths 3 beds |
show details | |

|
#33
E Palm Parke Blvd
Casa Grande, AZ 85122
|
1,562 sq. feet
|
2 baths 3 beds |
show details | |

|
#34
N Lake Superior Dr
Casa Grande, AZ 85194
|
1,064 sq. feet
|
1 baths 4 beds |
show details | |

|
#35
E Melrose Dr
Casa Grande, AZ 85122
|
1,275 sq. feet
|
2 baths 3 beds |
show details | |

|
#36
N Trekell Rd
Casa Grande, AZ 85122
|
1,607 sq. feet
|
3 baths 4 beds |
show details | |

|
#37
W Prickly Pear Dr
Casa Grande, AZ 85122
|
2,408 sq. feet
|
3 baths 4 beds |
show details | |

|
#38
W Roosevelt Ave
Coolidge, AZ 85128
|
1,687 sq. feet
|
2 baths 3 beds |
show details | |

|
#39
E Elegante Dr
Casa Grande, AZ 85122
|
1,458 sq. feet
|
2 baths 3 beds |
show details | |

|
#40
West Pima Avenue
Coolidge, AZ 85128
|
1,557 sq. feet
|
2 baths 4 beds |
show details |
| Photo | Address | Area | Beds / Baths | Price | Details |
|---|---|---|---|---|---|

|
#41
N Malachite Way
Casa Grande, AZ 85122
|
1,430 sq. feet
|
2 baths 3 beds |
show details | |

|
#42
S Mammoth Dr
Casa Grande, AZ 85193
|
1,522 sq. feet
|
2 baths 2 beds |
show details | |

|
#43
N Larat Ln
Coolidge, AZ 85128
|
1,844 sq. feet
|
2 baths 3 beds |
show details | |

|
#44
W Vah Ki Inn Rd
Coolidge, AZ 85128
|
816 sq. feet
|
1 baths 2 beds |
show details | |

|
#45
W Aztec Dr
Coolidge, AZ 85128
|
1,984 sq. feet
|
2 baths 4 beds |
show details | |

|
#46
W Pinkley Ave
Coolidge, AZ 85128
|
1,523 sq. feet
|
2 baths 3 beds |
show details | |

|
#47
W Central Ave
Coolidge, AZ 85128
|
3,905 sq. feet
|
4 baths 5 beds |
show details | |

|
#48
W Blue Lagoon Dr
Casa Grande, AZ 85122
|
2,099 sq. feet
|
2 baths 4 beds |
show details | |

|
#49
W Central Ave
Coolidge, AZ 85128
|
3,240 sq. feet
|
2 baths 5 beds |
show details | |

|
Check over 1 million property listings on Foreclosure.com!
|
browse all offers | |||


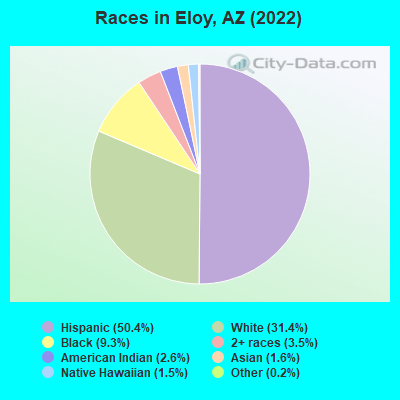
- 8,68550.4%Hispanic
- 5,40031.4%White alone
- 1,5999.3%Black alone
- 6093.5%Two or more races
- 4542.6%American Indian alone
- 2761.6%Asian alone
- 2531.5%Native Hawaiian and Other
Pacific Islander alone - 340.2%Other race alone
According to our research of Arizona and other state lists, there were 31 registered sex offenders living in Eloy, Arizona as of March 04, 2025.
The ratio of all residents to sex offenders in Eloy is 582 to 1.
The ratio of registered sex offenders to all residents in this city is near the state average.
Type |
2009 |
2010 |
2011 |
2012 |
2013 |
2014 |
2015 |
2016 |
2017 |
2018 |
2019 |
2020 |
2021 |
2022 |
|---|---|---|---|---|---|---|---|---|---|---|---|---|---|---|
| Murders (per 100,000) | 0 (0.0) | 4 (24.1) | 3 (17.8) | 1 (5.8) | 1 (5.7) | 2 (11.8) | 1 (6.0) | 0 (0.0) | 1 (5.7) | 0 (0.0) | 0 (0.0) | 0 (0.0) | 1 (5.8) | 0 (0.0) |
| Rapes (per 100,000) | 21 (160.9) | 3 (18.0) | 4 (23.7) | 7 (40.8) | 8 (45.4) | 4 (23.5) | 8 (48.0) | 3 (17.5) | 4 (22.8) | 8 (40.9) | 7 (35.4) | 0 (0.0) | 10 (57.6) | 10 (63.6) |
| Robberies (per 100,000) | 15 (115.0) | 8 (48.1) | 10 (59.3) | 9 (52.5) | 7 (39.8) | 8 (47.1) | 8 (48.0) | 6 (35.1) | 5 (28.5) | 2 (10.2) | 8 (40.5) | 0 (0.0) | 4 (23.1) | 0 (0.0) |
| Assaults (per 100,000) | 70 (536.4) | 73 (438.9) | 81 (480.3) | 67 (390.7) | 56 (318.1) | 71 (417.6) | 72 (431.7) | 53 (309.8) | 80 (455.8) | 71 (363.2) | 62 (313.8) | 0 (0.0) | 75 (432.4) | 99 (629.9) |
| Burglaries (per 100,000) | 217 (1,663) | 270 (1,623) | 162 (960.5) | 179 (1,044) | 156 (886.3) | 127 (747.0) | 97 (581.6) | 117 (683.8) | 154 (877.4) | 70 (358.1) | 75 (379.6) | 0 (0.0) | 57 (328.6) | 70 (445.4) |
| Thefts (per 100,000) | 328 (2,514) | 341 (2,050) | 284 (1,684) | 358 (2,088) | 311 (1,767) | 343 (2,018) | 331 (1,985) | 307 (1,794) | 326 (1,857) | 252 (1,289) | 263 (1,331) | 0 (0.0) | 180 (1,038) | 197 (1,253) |
| Auto thefts (per 100,000) | 45 (344.9) | 64 (384.8) | 33 (195.7) | 32 (186.6) | 39 (221.6) | 28 (164.7) | 29 (173.9) | 36 (210.4) | 28 (159.5) | 29 (148.3) | 25 (126.5) | 0 (0.0) | 30 (172.9) | 37 (235.4) |
| Arson (per 100,000) | 19 (145.6) | 9 (54.1) | 10 (59.3) | 22 (128.3) | 28 (159.1) | 7 (41.2) | 13 (77.9) | 10 (58.4) | 8 (45.6) | 6 (30.7) | 9 (45.6) | 0 (0.0) | 10 (57.6) | 8 (50.9) |
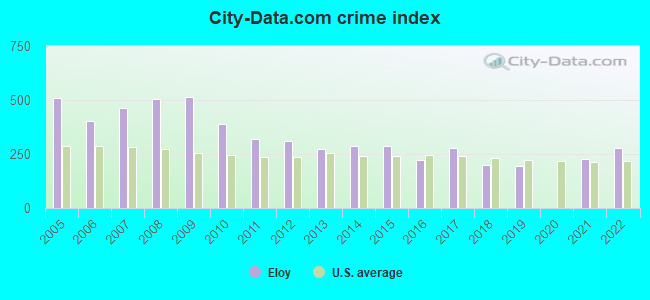
| City-Data.com crime index | 515.1 | 391.2 | 318.6 | 309.7 | 273.7 | 286.2 | 285.1 | 223.0 | 277.8 | 196.9 | 193.2 | 0.0 | 229.4 | 277.0 |
The City-Data.com crime index weighs serious crimes and violent crimes more heavily. Higher means more crime, U.S. average is 246.1. It adjusts for the number of visitors and daily workers commuting into cities.
Crime rate in Eloy detailed stats: murders, rapes, robberies, assaults, burglaries, thefts, arson
Full-time law enforcement employees in 2021, including police officers: 40 (31 officers - 25 male; 6 female).
| Officers per 1,000 residents here: | 1.79 |
| Arizona average: | 1.75 |
 Recent articles from our blog. Our writers, many of them Ph.D. graduates or candidates, create easy-to-read articles on a wide variety of topics.
| Buc-ee's coming to Arizona (69 replies) | |
| In 2022, Zillow Predicts That Phoenix housing market will climb ANOTHER 20%?! (709 replies) | |
| Eloy Arizona Boom or Bust? (10 replies) | |
| Midwest move to AZ (12 replies) | |
| Robson Ranch, Eloy (1 reply) | |
| Here we go again - Will a "theme park" work in AZ or not? (132 replies) |
Latest news from Eloy, AZ collected exclusively by city-data.com from local newspapers, TV, and radio stations
Eloy, AZ City Guides:
Ancestries: German (3.6%), European (3.4%), English (2.9%), Irish (2.5%), American (2.0%), African (1.6%).
Current Local Time: MST (no DST) time zone
Incorporated in 1949
Elevation: 1557 feet
Land area: 71.7 square miles.
Population density: 238 people per square mile (very low).
2,764 residents are foreign born (13.9% Latin America).
| This city: | 16.1% |
| Arizona: | 13.0% |
Median real estate property taxes paid for housing units with mortgages in 2022: $1,096 (0.4%)
Median real estate property taxes paid for housing units with no mortgage in 2022: $1,080 (0.4%)
Nearest city with pop. 50,000+: San Tan Valley, AZ (29.6 miles , pop. 81,321).
Nearest city with pop. 200,000+: Mesa, AZ (45.6 miles
, pop. 396,375).
Nearest city with pop. 1,000,000+: Phoenix, AZ (59.7 miles
, pop. 1,321,045).
Nearest cities:
Latitude: 32.76 N, Longitude: 111.60 W
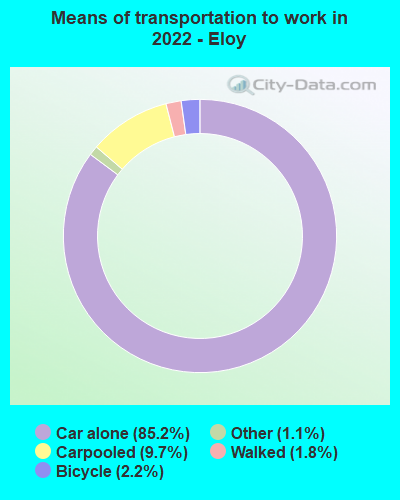
Daytime population change due to commuting: +181 (+1.1%)
Workers who live and work in this city: 1,356 (36.7%)
Area code commonly used in this area: 520

Eloy, Arizona accommodation & food services, waste management - Economy and Business Data
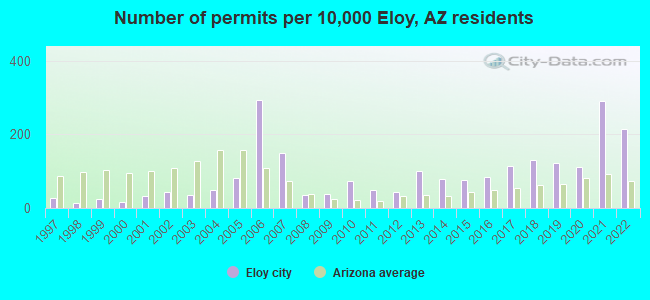
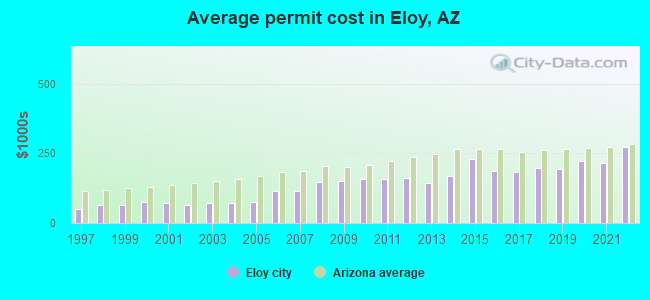
Single-family new house construction building permits:
- 2022: 221 buildings, average cost: $273,500
- 2021: 301 buildings, average cost: $215,900
- 2020: 116 buildings, average cost: $222,500
- 2019: 127 buildings, average cost: $191,900
- 2018: 135 buildings, average cost: $197,300
- 2017: 117 buildings, average cost: $183,000
- 2016: 87 buildings, average cost: $185,300
- 2015: 79 buildings, average cost: $229,700
- 2014: 83 buildings, average cost: $166,900
- 2013: 104 buildings, average cost: $142,900
- 2012: 45 buildings, average cost: $162,800
- 2011: 50 buildings, average cost: $156,000
- 2010: 77 buildings, average cost: $157,400
- 2009: 38 buildings, average cost: $148,700
- 2008: 37 buildings, average cost: $146,200
- 2007: 156 buildings, average cost: $113,200
- 2006: 305 buildings, average cost: $116,400
- 2005: 84 buildings, average cost: $74,300
- 2004: 51 buildings, average cost: $71,600
- 2003: 35 buildings, average cost: $72,000
- 2002: 45 buildings, average cost: $62,700
- 2001: 33 buildings, average cost: $69,800
- 2000: 18 buildings, average cost: $76,500
- 1999: 26 buildings, average cost: $65,600
- 1998: 13 buildings, average cost: $63,700
- 1997: 27 buildings, average cost: $50,300
| Here: | 4.0% |
| Arizona: | 3.8% |
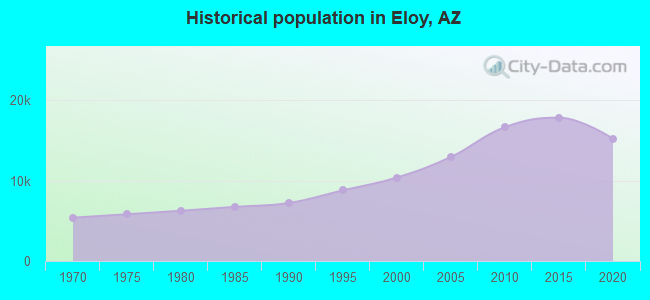

Population change in the 1990s: +3,192 (+44.4%).
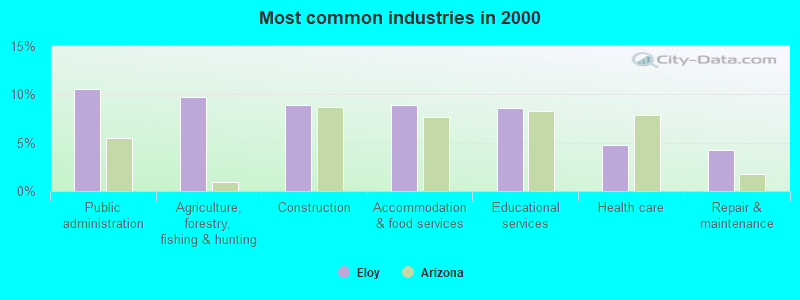
- Public administration (10.6%)
- Agriculture, forestry, fishing & hunting (9.7%)
- Construction (8.9%)
- Accommodation & food services (8.8%)
- Educational services (8.6%)
- Health care (4.8%)
- Repair & maintenance (4.3%)
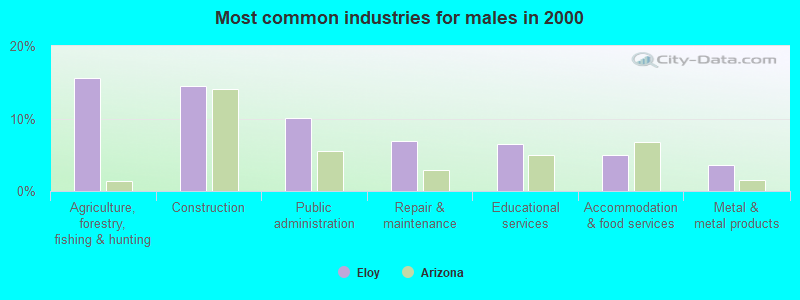
- Agriculture, forestry, fishing & hunting (15.5%)
- Construction (14.5%)
- Public administration (10.1%)
- Repair & maintenance (6.9%)
- Educational services (6.4%)
- Accommodation & food services (5.0%)
- Metal & metal products (3.6%)
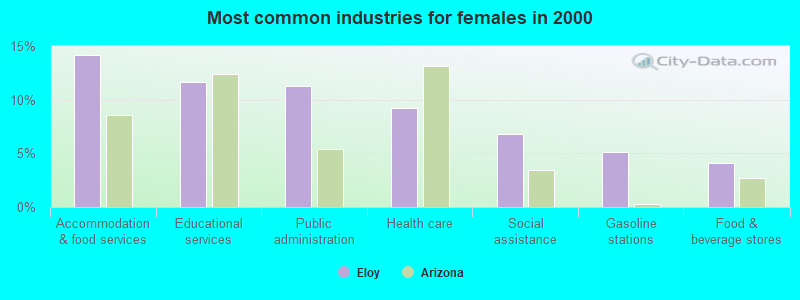
- Accommodation & food services (14.2%)
- Educational services (11.6%)
- Public administration (11.2%)
- Health care (9.2%)
- Social assistance (6.8%)
- Gasoline stations (5.1%)
- Food & beverage stores (4.1%)
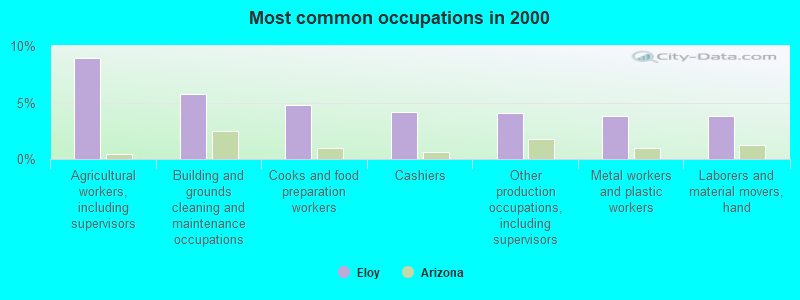
- Agricultural workers, including supervisors (8.9%)
- Building and grounds cleaning and maintenance occupations (5.7%)
- Cooks and food preparation workers (4.8%)
- Cashiers (4.2%)
- Other production occupations, including supervisors (4.1%)
- Metal workers and plastic workers (3.8%)
- Laborers and material movers, hand (3.8%)
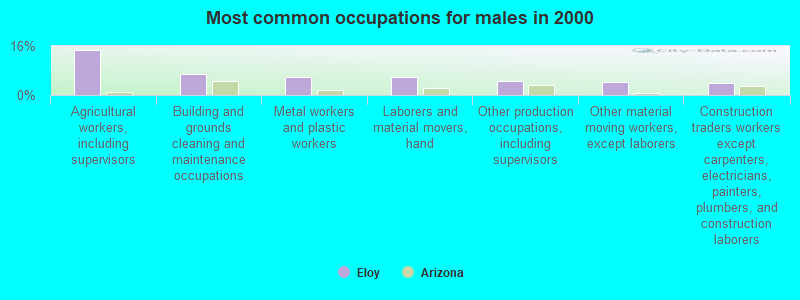
- Agricultural workers, including supervisors (14.6%)
- Building and grounds cleaning and maintenance occupations (6.9%)
- Metal workers and plastic workers (6.0%)
- Laborers and material movers, hand (5.7%)
- Other production occupations, including supervisors (4.6%)
- Other material moving workers, except laborers (4.4%)
- Construction traders workers except carpenters, electricians, painters, plumbers, and construction laborers (3.9%)

- Cashiers (10.0%)
- Cooks and food preparation workers (7.2%)
- Secretaries and administrative assistants (6.0%)
- Information and record clerks, except customer service representatives (5.4%)
- Waiters and waitresses (4.2%)
- Building and grounds cleaning and maintenance occupations (4.1%)
- Other teachers, instructors, education, training, and library occupations (3.5%)
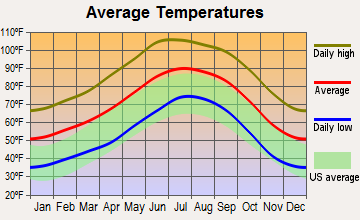
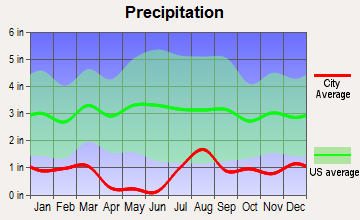
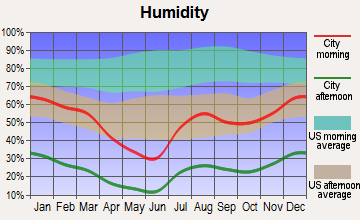
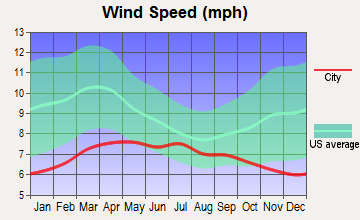
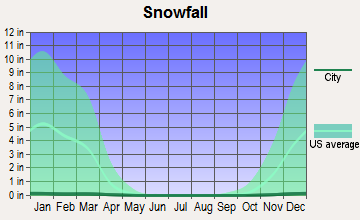
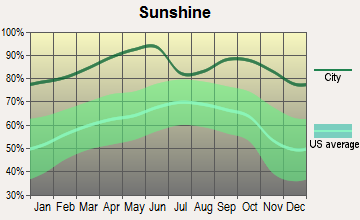
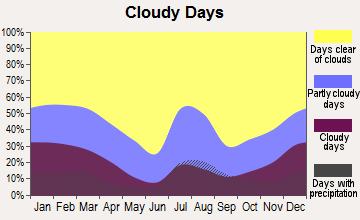
Average climate in Eloy, Arizona
Based on data reported by over 4,000 weather stations
|
|

(lower is better)
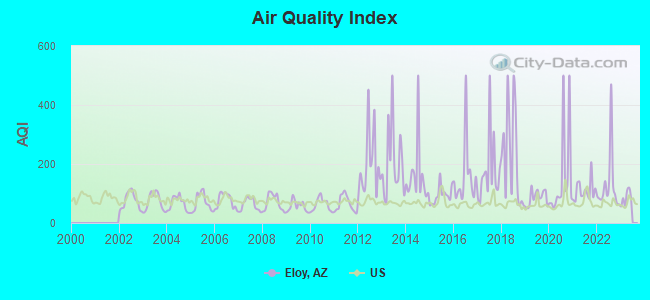
Air Quality Index (AQI) level in 2022 was 129. This is significantly worse than average.
| City: | 129 |
| U.S.: | 73 |
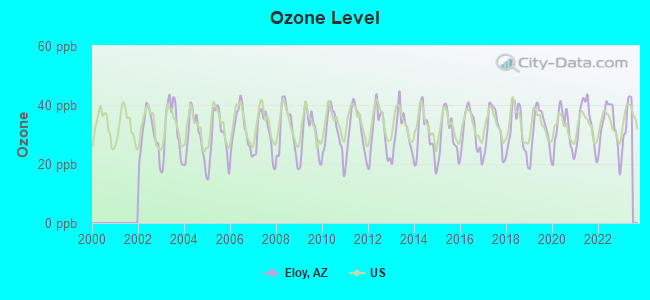
Ozone [ppb] level in 2022 was 32.6. This is about average. Closest monitor was 16.2 miles away from the city center.
| City: | 32.6 |
| U.S.: | 33.3 |
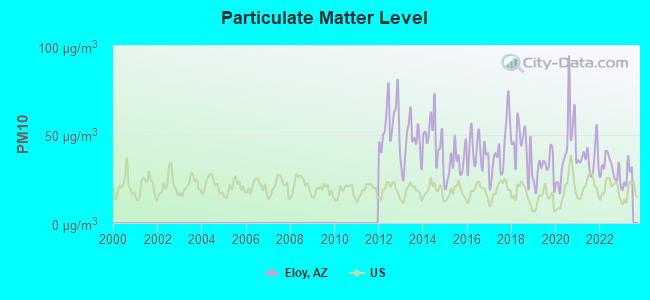
Particulate Matter (PM10) [µg/m3] level in 2022 was 31.0. This is significantly worse than average. Closest monitor was 2.7 miles away from the city center.
| City: | 31.0 |
| U.S.: | 19.2 |
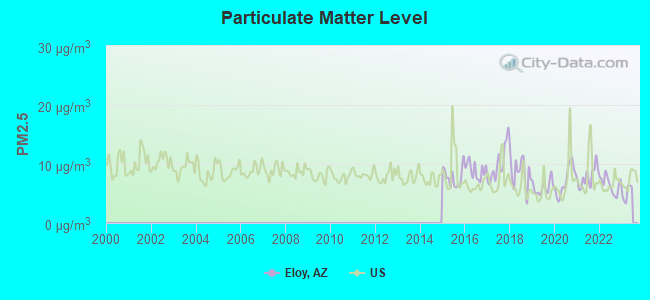
Particulate Matter (PM2.5) [µg/m3] level in 2022 was 6.54. This is better than average. Closest monitor was 11.9 miles away from the city center.
| City: | 6.54 |
| U.S.: | 8.11 |
Earthquake activity:
Eloy-area historical earthquake activity is significantly above Arizona state average. It is 1974% greater than the overall U.S. average.On 6/28/1992 at 11:57:34, a magnitude 7.6 (6.2 MB, 7.6 MS, 7.3 MW, Depth: 0.7 mi, Class: Major, Intensity: VIII - XII) earthquake occurred 301.0 miles away from the city center, causing 3 deaths (1 shaking deaths, 2 other deaths) and 400 injuries, causing $100,000,000 total damage and $40,000,000 insured losses
On 5/19/1940 at 04:36:40, a magnitude 7.2 (7.2 UK) earthquake occurred 239.8 miles away from Eloy center, causing $33,000,000 total damage
On 10/16/1999 at 09:46:44, a magnitude 7.4 (6.3 MB, 7.4 MS, 7.2 MW, 7.3 ML) earthquake occurred 303.6 miles away from Eloy center
On 12/31/1934 at 18:45:56, a magnitude 7.1 (7.1 UK) earthquake occurred 242.2 miles away from Eloy center
On 10/15/1979 at 23:16:54, a magnitude 7.0 (5.7 MB, 6.9 MS, 7.0 ML, 6.4 MW) earthquake occurred 234.9 miles away from the city center
On 11/24/1987 at 13:15:56, a magnitude 6.7 (6.0 MB, 6.6 MS, 6.7 ML, 6.1 ML, Class: Strong, Intensity: VII - IX) earthquake occurred 253.6 miles away from Eloy center
Magnitude types: body-wave magnitude (MB), local magnitude (ML), surface-wave magnitude (MS), moment magnitude (MW)
Natural disasters:
The number of natural disasters in Pinal County (15) is near the US average (15).Major Disasters (Presidential) Declared: 9
Emergencies Declared: 2
Causes of natural disasters: Floods: 9, Storms: 8, Fires: 3, Drought: 1, Hurricane: 1, Tornado: 1, Other: 1 (Note: some incidents may be assigned to more than one category).

Hospitals and medical centers near Eloy:
- CASA GRANDE REGIONAL MEDICAL CENTER Acute Care Hospitals (about 11 miles away; CASA GRANDE, AZ)
- WESTERN SKIES DIALYSIS INC. (Dialysis Facility, about 11 miles away; CASA GRANDE, AZ)
- EL SOL HOME HEALTH INC (Home Health Center, about 12 miles away; CASA GRANDE, AZ)
- OASIS HOME HEALTH CARE (Home Health Center, about 13 miles away; CASA GRANDE, AZ)
- CASA GRANDE DIALYSIS (FMC) (Dialysis Facility, about 13 miles away; CASA GRANDE, AZ)
- OASIS PAVILION NURSING AND REHABILITATION CENTER (Nursing Home, about 15 miles away; CASA GRANDE, AZ)
Airports located in Eloy:
- Eloy Municipal Airport (E60) (Runways: 1, Itinerant Ops: 1,500, Local Ops: 21,900, Military Ops: 50)
Colleges/universities with over 2000 students nearest to Eloy:
- Central Arizona College (about 14 miles; Coolidge, AZ; Full-time enrollment: 4,893)
- Arizona State University-Polytechnic (about 38 miles; Mesa, AZ; FT enrollment: 3,311)
- Chandler-Gilbert Community College (about 39 miles; Chandler, AZ; FT enrollment: 8,047)
- Mesa Community College (about 47 miles; Mesa, AZ; FT enrollment: 14,726)
- University of Phoenix-Phoenix Campus (about 50 miles; Tempe, AZ; FT enrollment: 3,862)
- Arizona State University-Tempe (about 50 miles; Tempe, AZ; FT enrollment: 45,951)
- University of Phoenix-Online Campus (about 50 miles; Phoenix, AZ; FT enrollment: 155,655)
Public schools in Eloy:
- TOLTEC ELEMENTARY SCHOOL (Students: 692, Location: 3315 N. TOLTEC RD.)
- CAVIT - SANTA CRUZ VALLEY UNION HIGH SCHOOL (Students: 458, Location: 900 W. MAIN ST.)
- CURIEL SCHOOL (Students: 392, Location: 1000 CURIEL STREET)
- ELOY INTERMEDIATE SCHOOL (Students: 383, Location: 1101 N. SUNSHINE BLVD.)
- ELOY JUNIOR HIGH SCHOOL (Students: 246, Location: 404 E. PHOENIX)
- VILLA OASIS INTERSCHOLASTIC CENTER FOR EDUCATION ( (Location: 3740 N TOLTEC RD)
- SANTA CRUZ VALLEY UNION HIGH SCHOOL (Location: 900 N MAIN ST)
- SANTA CRUZ VALLEY UNION HIGH ALTERNATIVE SCHOOL (Location: 900 MAIN STREET)
- ECAMBRIDGE (Location: 3315 N. TOLTEC RD.)
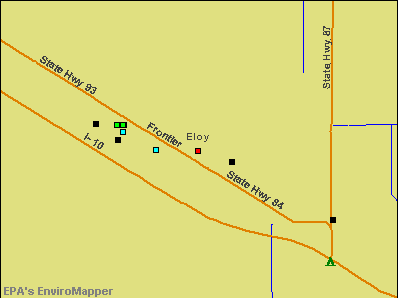
Points of interest:
Notable locations in Eloy: Eloy Landfill (A), Eloy Business Park (B), Eloy Railroad Station (C), Toltec Community Center (D), Toltec Railroad Station (E), Eloy Public Library (F), Eloy Fire District Station 522 (G), Eloy Fire District Station 521 (H), Eloy Police Department (I). Display/hide their locations on the map
Churches in Eloy include: First United Pentecostal Church (A), First United Methodist Church (B), First Assembly of God (C), Estrella Community Church (D), Church of Christ (E), Toltec Evangelical Methodist Church (F), Westside Church of God in Christ (G), Saint Helen of the Cross Roman Catholic Church (H), Iglesia Del Valle (I). Display/hide their locations on the map
Parks in Eloy include: Trekell Park (1), Jones Park (2), Washington Mini Park Site (3), Tumble Weed Park (4), Toltec Mini Park (5), Southwest Gas Site Mini Park (6), North Park (7), Curiel School Mini Park Site (8), City Park (9). Display/hide their locations on the map
Tourist attractions: Sunland Visitor Center Inc (3905 West Marsh Avenue) (1), High But Dry Balloons (1005 North Tumbleweed Road) (2). Display/hide their approximate locations on the map
Courts: Lorona Marie A Justice Of The Peace (801 North Main) (1), Eloy City - City Court (628 North Main Street) (2). Display/hide their approximate locations on the map
Birthplace of: Levi Jones - 2005 NFL player (Cincinnati Bengals, born: Aug 24, 1979), Mossy Cade - Football player, Ricky Nelson (baseball) - Baseball player.
Drinking water stations with addresses in Eloy and their reported violations in the past:
ELOY CITY OF (Address: 1137 W HOUSER RD , Population served: 9,700, Groundwater):Past health violations:Past monitoring violations:
- MCL, Average - Between JAN-2012 and MAR-2012, Contaminant: Nitrate. Follow-up actions: St Compliance achieved (MAR-14-2013)
- Follow-up Or Routine LCR Tap M/R - In OCT-01-2013, Contaminant: Lead and Copper Rule. Follow-up actions: St Violation/Reminder Notice (DEC-23-2013)
- Monitoring and Reporting (DBP) - Between JAN-2012 and DEC-2012, Contaminant: TTHM. Follow-up actions: St Violation/Reminder Notice (APR-23-2013), St Compliance achieved (SEP-13-2013)
- Monitoring and Reporting (DBP) - Between JAN-2012 and DEC-2012, Contaminant: Total Haloacetic Acids (HAA5). Follow-up actions: St Violation/Reminder Notice (APR-23-2013), St Compliance achieved (SEP-13-2013)
- Monitoring and Reporting (DBP) - Between JAN-2011 and DEC-2011, Contaminant: TTHM. Follow-up actions: St Formal NOV issued (MAR-22-2013), St Compliance achieved (MAY-15-2013)
- Monitoring and Reporting (DBP) - Between JAN-2011 and DEC-2011, Contaminant: Total Haloacetic Acids (HAA5). Follow-up actions: St Formal NOV issued (MAR-22-2013), St Compliance achieved (MAY-15-2013)
- 9 routine major monitoring violations
- 12 regular monitoring violations
- 19 other older monitoring violations
| This city: | 3.1 people |
| Arizona: | 2.6 people |
| This city: | 76.7% |
| Whole state: | 66.2% |
| This city: | 10.7% |
| Whole state: | 7.8% |
Likely homosexual households (counted as self-reported same-sex unmarried-partner households)
- Lesbian couples: 0.2% of all households
- Gay men: 0.2% of all households
5 people in group homes intended for adults in 2010
People in group quarters in Eloy in 2000:
- 957 people in other types of correctional institutions
- 525 people in federal prisons and detention centers
- 6 people in other noninstitutional group quarters
Banks with branches in Eloy (2011 data):
- Great Western Bank: Eloy Branch at 500 Main Street, branch established on 1949/09/19. Info updated 2010/06/08: Bank assets: $8,458.0 mil, Deposits: $6,362.5 mil, headquarters in Watertown, SD, positive income, Commercial Lending Specialization, 187 total offices, Holding Company: National Australia Bank Limited
For population 15 years and over in Eloy:
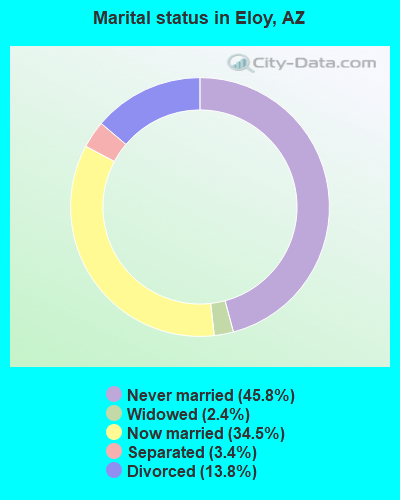
- Never married: 45.8%
- Now married: 34.5%
- Separated: 3.4%
- Widowed: 2.4%
- Divorced: 13.8%
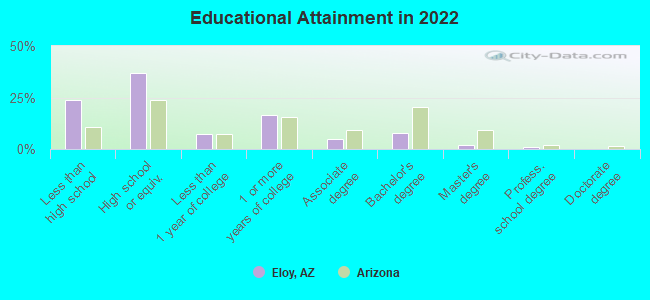
For population 25 years and over in Eloy:
- High school or higher: 74.9%
- Bachelor's degree or higher: 10.0%
- Graduate or professional degree: 2.4%
- Unemployed: 10.8%
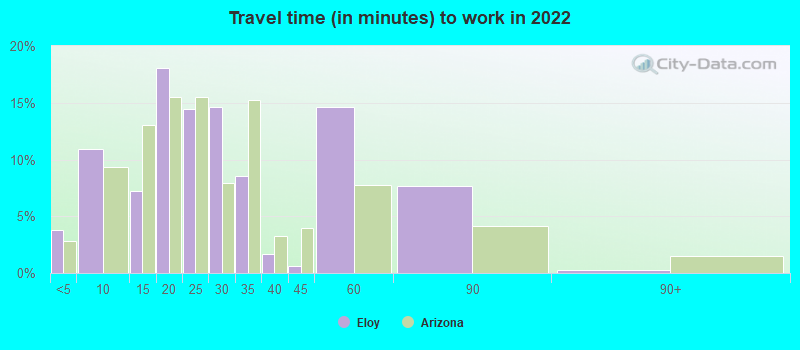
- Mean travel time to work (commute): 23.8 minutes
| Here: | 12.9 |
| Arizona average: | 12.2 |
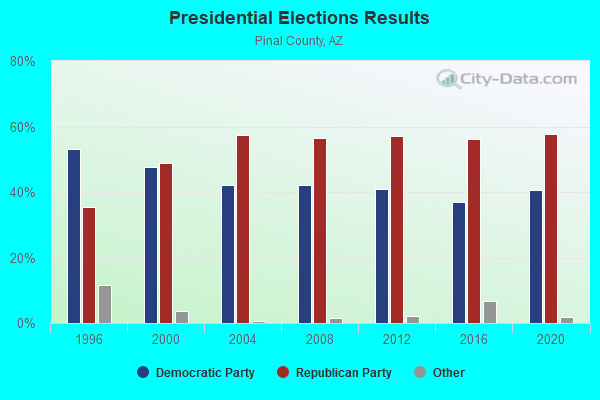
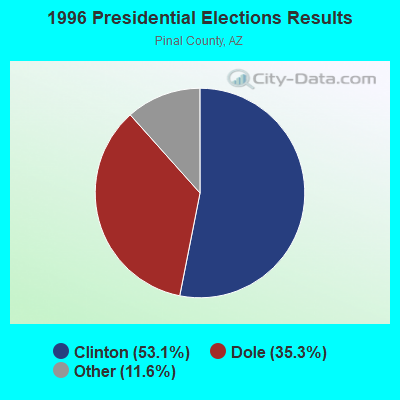
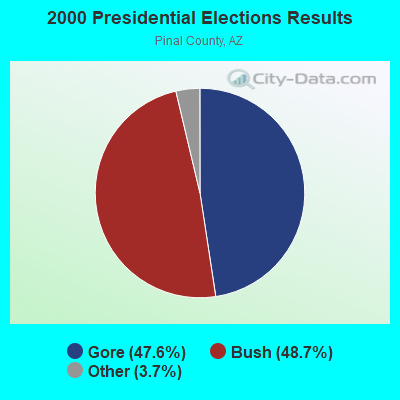

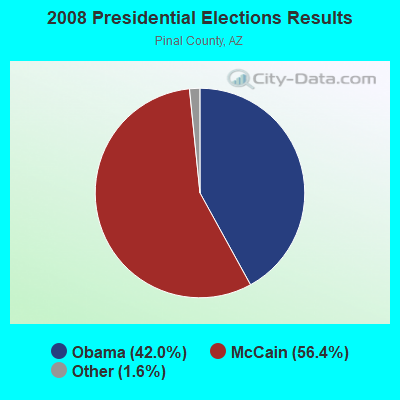
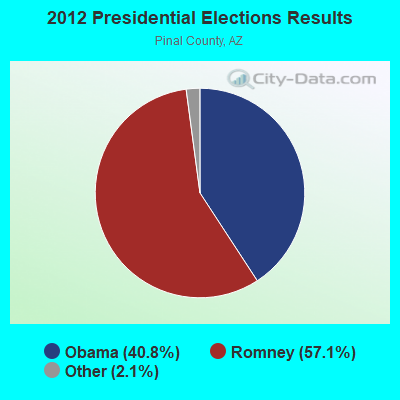
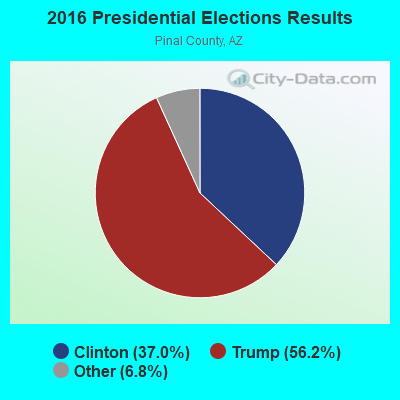
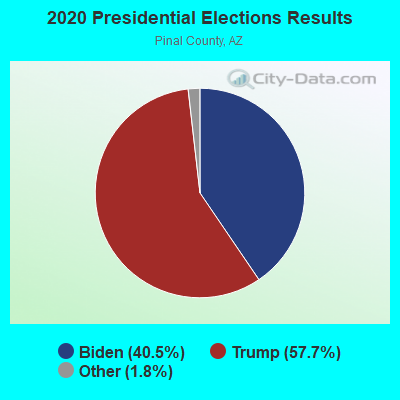
Graphs represent county-level data. Detailed 2008 Election Results
Religion statistics for Eloy, AZ (based on Pinal County data)
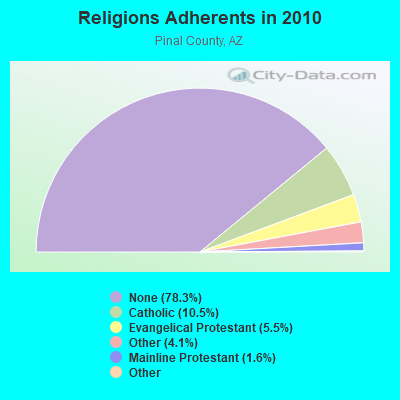
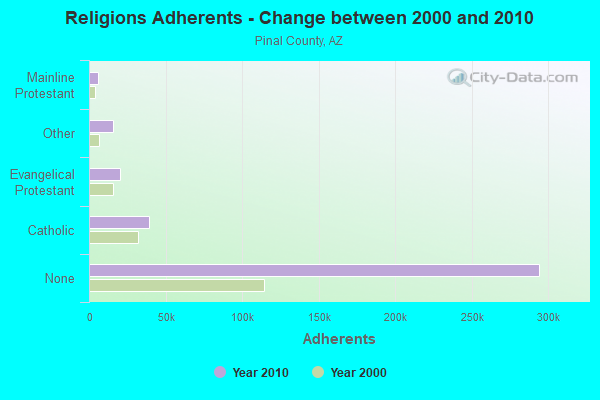
| Religion | Adherents | Congregations |
|---|---|---|
| Catholic | 39,268 | 20 |
| Evangelical Protestant | 20,514 | 155 |
| Other | 15,394 | 45 |
| Mainline Protestant | 5,869 | 21 |
| Black Protestant | 369 | 3 |
| Orthodox | 200 | 1 |
| None | 294,156 | - |
Food Environment Statistics:
| Here: | 1.13 / 10,000 pop. |
| Arizona: | 1.36 / 10,000 pop. |
| This county: | 0.10 / 10,000 pop. |
| Arizona: | 0.14 / 10,000 pop. |
| Pinal County: | 0.37 / 10,000 pop. |
| Arizona: | 0.55 / 10,000 pop. |
| This county: | 1.99 / 10,000 pop. |
| State: | 2.47 / 10,000 pop. |
| Here: | 3.56 / 10,000 pop. |
| State: | 6.21 / 10,000 pop. |
| This county: | 8.0% |
| State: | 8.0% |
| Pinal County: | 28.1% |
| Arizona: | 22.8% |
| Here: | 12.4% |
| Arizona: | 14.2% |
Health and Nutrition:
| Here: | 45.6% |
| State: | 49.0% |
| Eloy: | 45.3% |
| Arizona: | 47.3% |
| This city: | 28.6 |
| State: | 28.5 |
| This city: | 22.1% |
| Arizona: | 20.8% |
| Eloy: | 9.2% |
| Arizona: | 10.2% |
| Eloy: | 6.8 |
| Arizona: | 6.8 |
| This city: | 31.3% |
| Arizona: | 33.5% |
| This city: | 54.7% |
| Arizona: | 56.1% |
| Eloy: | 81.8% |
| State: | 79.4% |
More about Health and Nutrition of Eloy, AZ Residents
| Local government employment and payroll (March 2022) | |||||
| Function | Full-time employees | Monthly full-time payroll | Average yearly full-time wage | Part-time employees | Monthly part-time payroll |
|---|---|---|---|---|---|
| Police Protection - Officers | 27 | $173,294 | $77,020 | 0 | $0 |
| Other Government Administration | 20 | $116,146 | $69,688 | 0 | $0 |
| Parks and Recreation | 11 | $42,559 | $46,428 | 8 | $11,384 |
| Police - Other | 11 | $62,159 | $67,810 | 1 | $1,716 |
| Water Supply | 10 | $44,855 | $53,826 | 0 | $0 |
| Streets and Highways | 9 | $33,245 | $44,327 | 0 | $0 |
| Other and Unallocable | 7 | $30,522 | $52,323 | 0 | $0 |
| Financial Administration | 5 | $26,328 | $63,187 | 0 | $0 |
| Judicial and Legal | 4 | $17,991 | $53,973 | 0 | $0 |
| Local Libraries | 4 | $17,692 | $53,076 | 1 | $1,087 |
| Solid Waste Management | 3 | $9,411 | $37,644 | 0 | $0 |
| Totals for Government | 111 | $574,202 | $62,076 | 10 | $14,187 |
Eloy government finances - Expenditure in 2021 (per resident):
- Construction - Air Transportation: $5,924,000 ($347.61)
Police Protection: $5,839,000 ($342.62)
Regular Highways: $2,265,000 ($132.91)
Housing and Community Development: $496,000 ($29.10)
- Current Operations - Police Protection: $4,878,000 ($286.23)
Financial Administration: $3,003,000 ($176.21)
Water Utilities: $2,664,000 ($156.32)
Solid Waste Management: $1,748,000 ($102.57)
Regular Highways: $1,577,000 ($92.54)
Sewerage: $1,403,000 ($82.33)
Parks and Recreation: $1,365,000 ($80.10)
Judicial and Legal Services: $570,000 ($33.45)
General Public Buildings: $562,000 ($32.98)
Libraries: $195,000 ($11.44)
General - Other: $85,000 ($4.99)
Air Transportation: $52,000 ($3.05)
- General - Interest on Debt: $246,000 ($14.43)
- Other Capital Outlay - Parks and Recreation: $419,000 ($24.59)
Financial Administration: $352,000 ($20.65)
Police Protection: $320,000 ($18.78)
Water Utilities: $249,000 ($14.61)
Judicial and Legal Services: $40,000 ($2.35)
Regular Highways: $40,000 ($2.35)
Air Transportation: $22,000 ($1.29)
- Total Salaries and Wages: $15,676,000 ($919.85)
- Water Utilities - Interest on Debt: $67,000 ($3.93)
Eloy government finances - Revenue in 2021 (per resident):
- Charges - Solid Waste Management: $1,884,000 ($110.55)
Sewerage: $1,547,000 ($90.78)
Other: $688,000 ($40.37)
Air Transportation: $188,000 ($11.03)
Parks and Recreation: $28,000 ($1.64)
- Federal Intergovernmental - Other: $8,749,000 ($513.38)
Air Transportation: $4,513,000 ($264.82)
Housing and Community Development: $414,000 ($24.29)
- Local Intergovernmental - Highways: $1,107,000 ($64.96)
Other: $611,000 ($35.85)
- Miscellaneous - Fines and Forfeits: $309,000 ($18.13)
Interest Earnings: $68,000 ($3.99)
Rents: $27,000 ($1.58)
Sale of Property: $9,000 ($0.53)
- Revenue - Water Utilities: $2,818,000 ($165.36)
- State Intergovernmental - General Local Government Support: $6,553,000 ($384.52)
Highways: $1,683,000 ($98.76)
Other: $326,000 ($19.13)
- Tax - General Sales and Gross Receipts: $7,495,000 ($439.80)
Property: $1,168,000 ($68.54)
Other License: $631,000 ($37.03)
Public Utilities Sales: $179,000 ($10.50)
Occupation and Business License - Other: $36,000 ($2.11)
Eloy government finances - Debt in 2021 (per resident):
- Long Term Debt - Beginning Outstanding - Unspecified Public Purpose: $9,168,000 ($537.97)
Outstanding Unspecified Public Purpose: $8,415,000 ($493.78)
Retired Unspecified Public Purpose: $752,000 ($44.13)
Beginning Outstanding - Public Debt for Private Purpose: $305,000 ($17.90)
Outstanding Nonguaranteed - Industrial Revenue: $259,000 ($15.20)
Retired Nonguaranteed - Public Debt for Private Purpose: $46,000 ($2.70)
Eloy government finances - Cash and Securities in 2021 (per resident):
- Other Funds - Cash and Securities: $29,222,000 ($1714.70)
- Sinking Funds - Cash and Securities: $259,000 ($15.20)
14.18% of this county's 2021 resident taxpayers lived in other counties in 2020 ($62,767 average adjusted gross income)
| Here: | 14.18% |
| Arizona average: | 6.85% |
0.02% of residents moved from foreign countries ($82 average AGI)
Pinal County: 0.02% Arizona average: 0.03%
Top counties from which taxpayers relocated into this county between 2020 and 2021:
| from Maricopa County, AZ | |
| from Pima County, AZ | |
| from Los Angeles County, CA |
9.81% of this county's 2020 resident taxpayers moved to other counties in 2021 ($54,187 average adjusted gross income)
| Here: | 9.81% |
| Arizona average: | 5.72% |
0.02% of residents moved to foreign countries ($91 average AGI)
Pinal County: 0.02% Arizona average: 0.03%
Top counties to which taxpayers relocated from this county between 2020 and 2021:
| to Maricopa County, AZ | |
| to Pima County, AZ | |
| to Navajo County, AZ |
| Businesses in Eloy, AZ | ||||
| Name | Count | Name | Count | |
|---|---|---|---|---|
| Burger King | 1 | H&R Block | 1 | |
| Carl\s Jr. | 1 | McDonald's | 1 | |
| Circle K | 3 | Motel 6 | 1 | |
| Dairy Queen | 1 | Pizza Hut | 1 | |
| Days Inn | 1 | Subway | 2 | |
| Dennys | 1 | Travelodge | 1 | |
| FedEx | 2 | UPS | 4 | |
Strongest AM radio stations in Eloy:
- KFLT (830 AM; 50 kW; TUCSON, AZ; Owner: FAMILY LIFE B/CING SYSTEM, INC.)
- KUAZ (1550 AM; daytime; 50 kW; TUCSON, AZ; Owner: ARIZONA BOARD OF REGENTS)
- KCKY (1150 AM; 5 kW; COOLIDGE, AZ; Owner: CORTARO BROADCASTING CORPORATION)
- KMIK (1580 AM; 50 kW; TEMPE, AZ; Owner: ABC, INC.)
- KSAZ (580 AM; 5 kW; MARANA, AZ; Owner: OWL BROADCASTING & DEVELOPMENT, INC.)
- KPXQ (1360 AM; 50 kW; GLENDALE, AZ; Owner: COMMON GROUND BROADCASTING, INC.)
- KFNX (1100 AM; 50 kW; CAVE CREEK, AZ; Owner: NORTH AMERICAN BROADCASTING CO., INC.)
- KMIA (710 AM; 50 kW; BLACK CANYON CITY, AZ; Owner: ENTRAVISION HOLDINGS, LLC)
- KEVT (1030 AM; 10 kW; CORTARO, AZ; Owner: ONE MART CORP.)
- KXEM (1010 AM; 15 kW; TOLLESON, AZ; Owner: JAMES CRYSTAL ENTERPRISES OF PHOENIX, INC.)
- KTKT (990 AM; 10 kW; TUCSON, AZ; Owner: ARIZONA LOTUS CORP.)
- KFYI (550 AM; 5 kW; PHOENIX, AZ; Owner: AMFM RADIO LICENSES, L.L.C.)
- KFNN (1510 AM; 22 kW; MESA, AZ; Owner: CRC BROADCASTING COMPANY, INC.)
Strongest FM radio stations in Eloy:
- KCDX (103.1 FM; FLORENCE, AZ; Owner: DESERT WEST AIR RANCHERS CORPORATION)
- KKMR (106.5 FM; ARIZONA CITY, AZ; Owner: HBC LICENSE CORPORATION)
- KZLZ-FM2 (105.3 FM; TUCSON, AZ; Owner: ENTRAVISION HOLDINGS, LLC)
- K263AA (100.5 FM; TUCSON, AZ; Owner: EDUCATIONAL MEDIA FOUNDATION)
- K255AC (98.9 FM; TUCSON, AZ; Owner: MARICOPA COUNTY COMMUN. COLLEGE DIST)
- KUAT-FM (90.5 FM; TUCSON, AZ; Owner: ARIZONA BOARD OF REGENTS)
- KXCI (91.3 FM; TUCSON, AZ; Owner: FOUNDATION FOR CREATIVE BROADCASTING, INC.)
- K292CM (106.3 FM; SUMMERHAVEN, AZ; Owner: ARIZONA LOTUS CORPORATION)
- KZLZ-FM1 (105.3 FM; TUCSON, AZ; Owner: ENTRAVISION HOLDINGS, LLC)
- KMRR (100.3 FM; GLOBE, AZ; Owner: HBC LICENSE CORPORATION)
- KVJC (91.9 FM; GLOBE, AZ; Owner: CSN INTERNATIONAL)
- KGMG (106.3 FM; ORACLE, AZ; Owner: JOURNAL BROADCAST CORPORATION)
- KRXS-FM (97.3 FM; GLOBE, AZ; Owner: LINDA C. POTYKA)
- KIIM-FM (99.5 FM; TUCSON, AZ; Owner: CITADEL BROADCASTING COMPANY)
- KOYT (92.9 FM; TUCSON, AZ; Owner: CAPSTAR TX LIMITED PARTNERSHIP)
- KHYT (107.5 FM; TUCSON, AZ; Owner: CITADEL BROADCASTING COMPANY)
- KRQQ (93.7 FM; TUCSON, AZ; Owner: CAPSTAR TX LIMITED PARTNERSHIP)
- KEDJ (103.9 FM; GILBERT, AZ; Owner: NPR PHOENIX, LLC)
- KMXZ-FM (94.9 FM; TUCSON, AZ; Owner: JOURNAL BROADCAST CORPORATION)
- KLPX (96.1 FM; TUCSON, AZ; Owner: ARIZONA LOTUS CORPORATION)
TV broadcast stations around Eloy:
- KAET (Channel 8; PHOENIX, AZ; Owner: ARIZONA BOARD OF REGENTS)
- National Bridge Inventory (NBI) Statistics
- 38Number of bridges
- 285ft / 87.3mTotal length
- $8,000Total costs
- 491,063Total average daily traffic
- 94,050Total average daily truck traffic
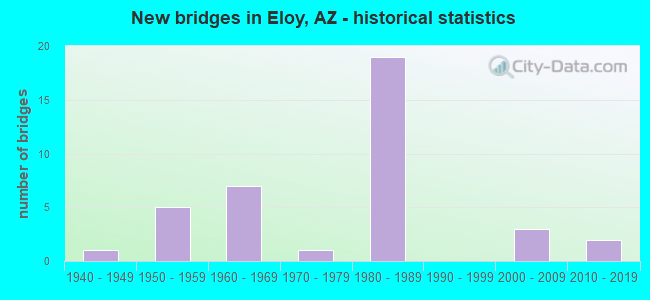
- New bridges - historical statistics
- 11940-1949
- 51950-1959
- 71960-1969
- 11970-1979
- 191980-1989
- 32000-2009
- 22010-2019
FCC Registered Antenna Towers: 117 (See the full list of FCC Registered Antenna Towers)
FCC Registered Broadcast Land Mobile Towers: 18 (See the full list of FCC Registered Broadcast Land Mobile Towers in Eloy, AZ)
FCC Registered Microwave Towers: 38 (See the full list of FCC Registered Microwave Towers in this town)
FCC Registered Maritime Coast & Aviation Ground Towers: 3 (See the full list of FCC Registered Maritime Coast & Aviation Ground Towers)
FCC Registered Amateur Radio Licenses: 31 (See the full list of FCC Registered Amateur Radio Licenses in Eloy)
FAA Registered Aircraft: 52 (See the full list of FAA Registered Aircraft in Eloy)
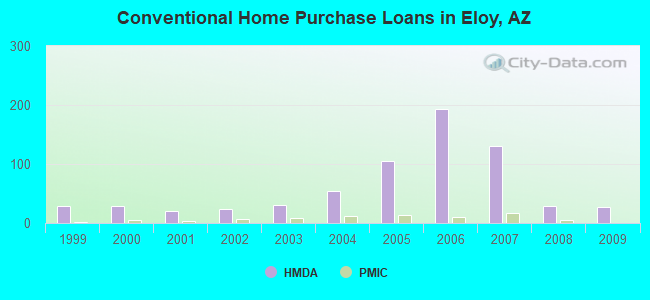
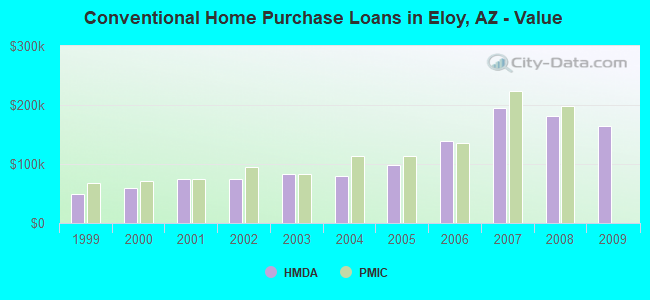
| Home Mortgage Disclosure Act Aggregated Statistics For Year 2009 (Based on 2 partial tracts) | ||||||||||||
| A) FHA, FSA/RHS & VA Home Purchase Loans | B) Conventional Home Purchase Loans | C) Refinancings | D) Home Improvement Loans | F) Non-occupant Loans on < 5 Family Dwellings (A B C & D) | G) Loans On Manufactured Home Dwelling (A B C & D) | |||||||
|---|---|---|---|---|---|---|---|---|---|---|---|---|
| Number | Average Value | Number | Average Value | Number | Average Value | Number | Average Value | Number | Average Value | Number | Average Value | |
| LOANS ORIGINATED | 12 | $107,733 | 27 | $164,100 | 28 | $160,432 | 0 | $0 | 20 | $166,493 | 3 | $93,207 |
| APPLICATIONS APPROVED, NOT ACCEPTED | 1 | $75,510 | 2 | $130,915 | 6 | $172,460 | 1 | $27,130 | 2 | $156,345 | 1 | $95,830 |
| APPLICATIONS DENIED | 2 | $55,880 | 6 | $95,803 | 31 | $160,734 | 5 | $31,458 | 7 | $186,240 | 6 | $67,443 |
| APPLICATIONS WITHDRAWN | 1 | $70,340 | 5 | $179,804 | 14 | $148,543 | 2 | $65,025 | 3 | $220,823 | 2 | $120,245 |
| FILES CLOSED FOR INCOMPLETENESS | 0 | $0 | 1 | $153,280 | 3 | $85,347 | 0 | $0 | 1 | $37,980 | 1 | $52,420 |
Detailed HMDA statistics for the following Tracts: 0019.00 , 0020.00
| Private Mortgage Insurance Companies Aggregated Statistics For Year 2009 (Based on 2 partial tracts) | ||
| A) Conventional Home Purchase Loans | ||
|---|---|---|
| Number | Average Value | |
| LOANS ORIGINATED | 0 | $0 |
| APPLICATIONS APPROVED, NOT ACCEPTED | 1 | $369,410 |
| APPLICATIONS DENIED | 0 | $0 |
| APPLICATIONS WITHDRAWN | 0 | $0 |
| FILES CLOSED FOR INCOMPLETENESS | 0 | $0 |
Detailed PMIC statistics for the following Tracts: 0019.00 , 0020.00
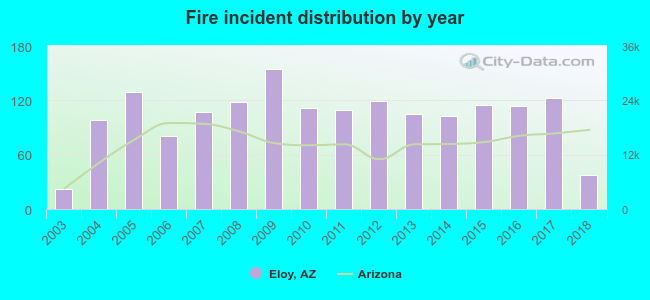
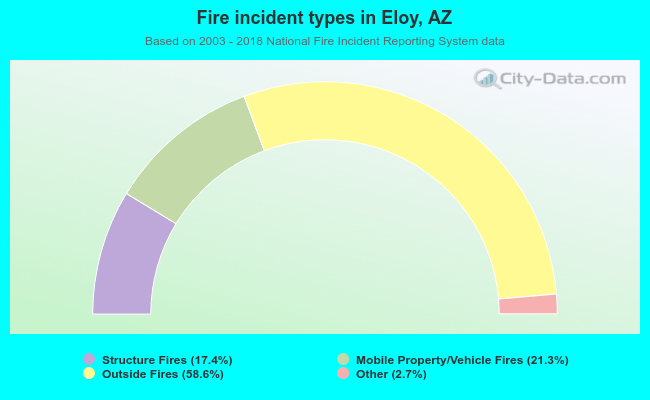
2003 - 2018 National Fire Incident Reporting System (NFIRS) incidents
- Fire incident types reported to NFIRS in Eloy, AZ
- 96458.6%Outside Fires
- 35121.3%Mobile Property/Vehicle Fires
- 28617.4%Structure Fires
- 452.7%Other
Fire-safe hotels and motels in Eloy, Arizona:
- Americas Best Value Inn, 3945 W Houser Rd, Eloy, Arizona 85231 , Phone: (520) 466-7804, Fax: (520) 466-3431
- Travelodge Eloy/Casa Grande, 7190 S Sunland Gin Rd, Eloy, Arizona 85231 , Phone: (520) 836-5000, Fax: (520) 836-3549
- Red Roof Inn, 4015 W Outer Dr, Eloy, Arizona 85131 , Phone: (520) 466-2522, Fax: (520) 466-2622
- Days Inn, 5300 S Sunland Gin Rd, Eloy, Arizona 85131 , Phone: (520) 426-9240
| Most common first names in Eloy, AZ among deceased individuals | ||
| Name | Count | Lived (average) |
|---|---|---|
| Jose | 30 | 70.7 years |
| John | 28 | 73.9 years |
| Maria | 28 | 75.6 years |
| William | 27 | 75.8 years |
| Mary | 26 | 75.0 years |
| James | 25 | 68.1 years |
| Robert | 19 | 67.6 years |
| Manuel | 16 | 65.6 years |
| Juan | 15 | 67.3 years |
| George | 15 | 74.0 years |
| Most common last names in Eloy, AZ among deceased individuals | ||
| Last name | Count | Lived (average) |
|---|---|---|
| Rodriguez | 25 | 70.0 years |
| Martinez | 18 | 69.3 years |
| Jones | 18 | 68.1 years |
| Williams | 17 | 74.6 years |
| Garcia | 16 | 72.6 years |
| Lopez | 15 | 62.8 years |
| Salazar | 14 | 72.8 years |
| Montijo | 14 | 68.1 years |
| Ramirez | 14 | 76.1 years |
| Hernandez | 12 | 75.3 years |
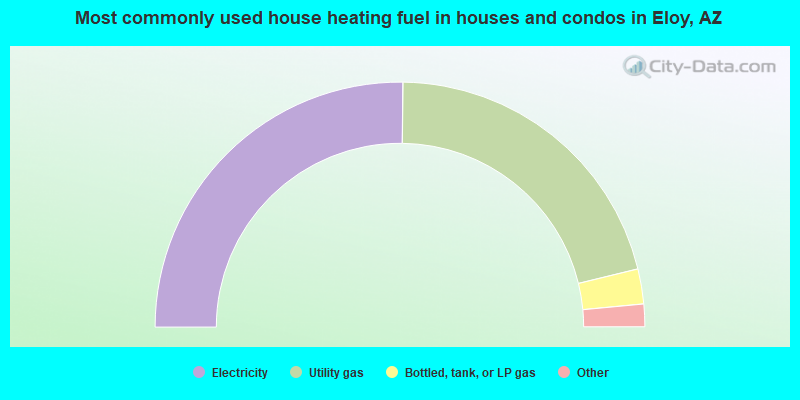
- 50.4%Electricity
- 42.0%Utility gas
- 4.6%Bottled, tank, or LP gas
- 0.9%Solar energy
- 0.9%Wood
- 0.8%No fuel used
- 0.4%Fuel oil, kerosene, etc.
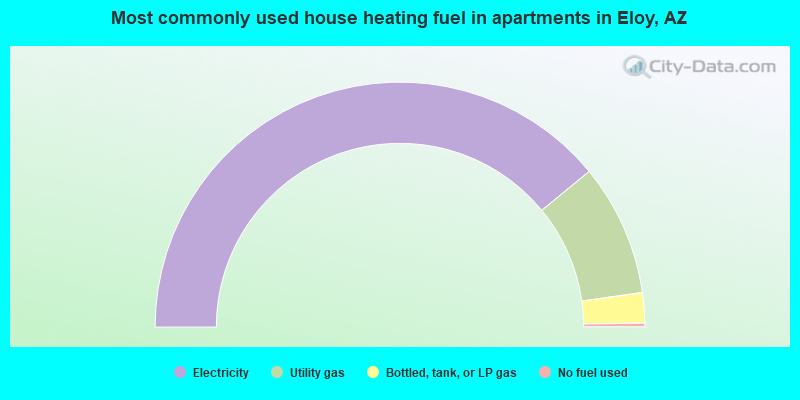
- 78.1%Electricity
- 17.4%Utility gas
- 4.0%Bottled, tank, or LP gas
- 0.5%No fuel used
Eloy compared to Arizona state average:
- Median house value below state average.
- Black race population percentage significantly above state average.
- Hispanic race population percentage above state average.
- Foreign-born population percentage above state average.
- Length of stay since moving in significantly above state average.
- Institutionalized population percentage significantly above state average.
- Percentage of population with a bachelor's degree or higher significantly below state average.
Eloy on our top lists:
- #16 on the list of "Top 101 cities with the largest percentage of people in other types of correctional institutions (population 1,000+)"
- #26 on the list of "Top 101 cities with the most people below 50% of the poverty level, excluding cities with 15% or more of residents in college and with the median age below 28 (population 5,000+)"
- #30 on the list of "Top 100 cities with the largest percentage of males (pop. 5,000+)"
- #39 on the list of "Top 101 cities with the most people below the poverty level, excluding cities with 15% or more of residents in college and with the median age below 28 (population 5,000+)"
- #39 on the list of "Top 101 cities with the largest percentage of people in federal prisons and detention centers (population 1,000+)"
- #46 on the list of "Top 101 cities with largest percentage of females in occupations: law enforcement workers including supervisors (population 5,000+)"
- #63 on the list of "Top 101 cities with the highest number of murders per 100,000 residents, excludes tourist destinations and others with a lot of outsiders visiting based on city industries data (population 5,000+)"
- #70 on the list of "Top 101 cities with largest percentage of females in occupations: fire fighting and prevention workers including supervisors (population 5,000+)"
- #85 on the list of "Top 101 cities with the largest positive percentage difference between never married males and females (15+ years) (with at least 1,000 males never married)"
- #2 on the list of "Top 101 counties with the largest decrease in the number of deaths per 1000 residents 2000-2006 to 2007-2013 (pop. 50,000+)"
- #3 on the list of "Top 101 counties with the highest Particulate Matter (PM10) Annual air pollution readings in 2012 (µg/m3)"
- #15 on the list of "Top 101 counties with the lowest percentage of residents that visited a dentist within the past year"
- #28 on the list of "Top 101 counties with the highest percentage of residents relocating to other counties in 2011 (pop. 50,000+)"
- #31 on the list of "Top 101 counties with the highest Ozone (1-hour) air pollution readings in 2012 (ppm)"
|
Total of 4 patent applications in 2008-2025.