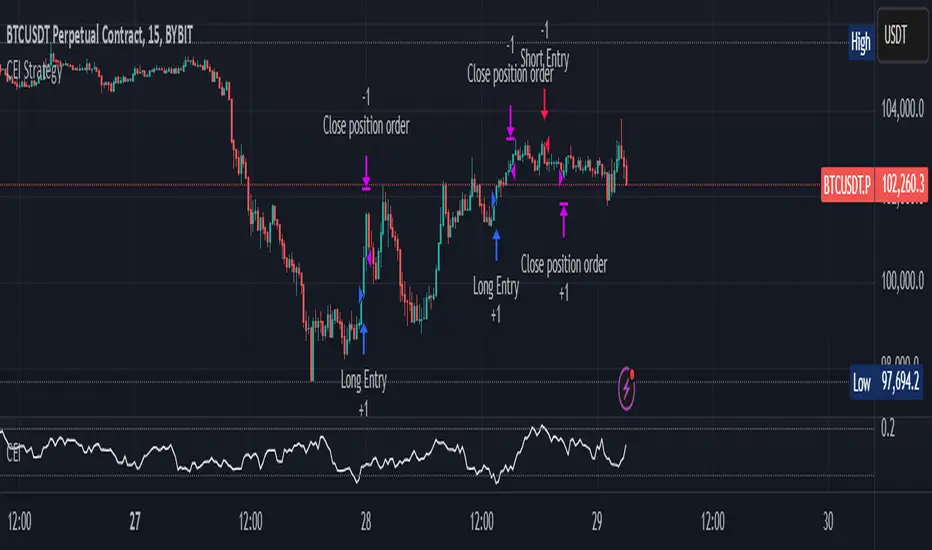
Candle Emotion Index (CEI) StrategyThe Candle Emotion Index (CEI) Strategy is an innovative sentiment-based trading approach designed to help traders identify and capitalize on market psychology. By analyzing candlestick patterns and combining them into a unified metric, the CEI Strategy provides clear entry and exit signals while dynamically managing risk. This strategy is ideal for traders looking to leverage market sentiment to identify high-probability trading opportunities.
How It Works
The CEI Strategy is built around three core oscillators that reflect key emotional states in the market:
Indecision Oscillator . Measures market uncertainty using patterns like Doji and Spinning Tops. High values indicate hesitation, signaling potential turning points.
Fear Oscillator . Tracks bearish sentiment through patterns like Shooting Star, Hanging Man, and Bearish Engulfing. Helps identify moments of intense selling pressure.
Greed Oscillator . Detects bullish sentiment using patterns like Marubozu, Hammer, Bullish Engulfing, and Three White Soldiers. Highlights periods of strong buying interest.
These oscillators are averaged into the Candle Emotion Index (CEI):
CEI = (Indecision + Fear + Greed) / 3
This single value quantifies overall market sentiment and drives the strategy’s trading decisions.
Key Features
Sentiment-Based Trading Signals . Long Entry: Triggered when the CEI crosses above a lower threshold (e.g., 0.1), indicating increasing bullish sentiment. Short Entry: Triggered when the CEI crosses above a higher threshold (e.g., 0.2), signaling rising bearish sentiment.
Volume Confirmation . Trades are validated only if volume exceeds a user-defined multiplier of the average volume over the lookback period. This ensures entries are backed by significant market activity.
Break-Even Recovery Mechanism . If a trade moves into a loss, the strategy attempts to recover to break-even instead of immediately exiting at a loss. This feature provides flexibility, allowing the market to recover while maintaining disciplined risk management.
Dynamic Risk Management . Maximum Holding Period: Trades are closed after a user-defined number of candles to avoid overexposure to prolonged uncertainty. Profit-Taking Conditions: Positions are exited when favorable price moves are confirmed by increased volume, locking in gains. Loss Threshold: Trades are exited early if the price moves unfavorably beyond a set percentage of the entry price, limiting potential losses.
Cooldown Period . After a trade is closed, a cooldown period prevents immediate re-entry, reducing overtrading and improving signal quality.
Why Use This Strategy?
The CEI Strategy combines advanced sentiment analysis with robust trade management, making it a powerful tool for traders seeking to understand market psychology and identify high-probability setups. Its unique features, such as the break-even recovery mechanism and volume confirmation, add an extra layer of discipline and reliability to trading decisions.
Best Practices
Combine with Other Indicators . Use trend-following tools (e.g., moving averages, ADX) and momentum oscillators (e.g., RSI, MACD) to confirm signals.
Align with Key Levels . Incorporate support and resistance levels for refined entries and exits.
Multi-Market Compatibility . Apply this strategy to forex, crypto, stocks, or any asset class with strong volume and price action.
Göstergeler ve stratejiler
D-LEVELS **FUTURECODE**The D-LEVELS indicator helps traders identify key price levels based on high-volume nodes and their relative positions to the current price. It visually displays these dynamic levels on the chart, offering insights into potential support, resistance, or zones of interest for trading decisions.
Key Features for Traders:
Dynamic Volume Nodes: Highlights high-volume price levels across different lookback periods, which can act as support or resistance.
Custom Alerts: Warns traders when price is within a specified percentage range of these levels.
Visual Cues: Uses labels and lines with customizable colors and widths for better chart clarity.
Table Display: Summarizes volume node price levels and their relative percentages for quick reference.
Customization: Flexible input options for text size, colors, and display settings to adapt to individual trading styles.
Use Case:
Traders can incorporate this indicator into their strategy to identify high-probability zones for entries, exits, or trade management by observing the interaction of price with these volume-based levels.

VFV Correction Levels
This Pine Script, "VFV Correction Levels," identifies significant daily price corrections and calculates corresponding investments based on fixed thresholds (paliers). Key features include:
Six predefined correction levels trigger investments between $150 and $600 based on the percentage drop.
Larger corrections correspond to higher investment amounts.
Graphical Indicators:
Visual labels mark correction levels and display investment amounts directly on the chart.
Investment Tracking:
Calculates total invested and tracks performance (yield percentage) relative to the initial correction price.

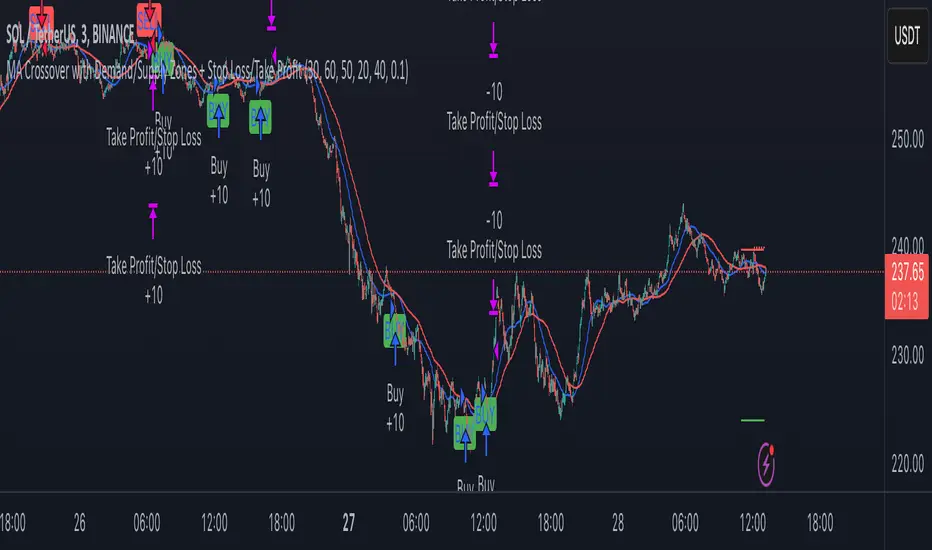
MA Crossover with Demand/Supply Zones + Stop Loss/Take ProfitStop Loss and Take Profit Inputs:
Added stopLossPerc and takeProfitPerc as inputs to allow the user to define the stop loss and take profit levels as a percentage of the entry price.
Stop Loss and Take Profit Calculation:
For long positions, the stop loss is calculated as strategy.position_avg_price * (1 - stopLossPerc), and the take profit is calculated as strategy.position_avg_price * (1 + takeProfitPerc).
For short positions, the stop loss is calculated as strategy.position_avg_price * (1 + stopLossPerc), and the take profit is calculated as strategy.position_avg_price * (1 - takeProfitPerc).
Exit Strategy:
Added strategy.exit to define the stop loss and take profit levels for each trade. The from_entry parameter ensures that the exit is tied to the specific entry order.
Flexibility:
The stop loss and take profit levels are dynamic and adjust based on the entry price of the trade.
How It Works:
When a buy signal is generated (MA crossover near a demand zone), the strategy enters a long position and sets a stop loss and take profit level based on the input percentages.
When a sell signal is generated (MA crossunder near a supply zone), the strategy enters a short position and sets a stop loss and take profit level based on the input percentages.
The trade will exit automatically if either the stop loss or take profit level is hit.
Example:
If the entry price for a long position is $100, and the stop loss is set to 1% while the take profit is set to 2%:
Stop loss level =
100
∗
(
1
−
0.01
)
=
100∗(1−0.01)=99
Take profit level =
100
∗
(
1
+
0.02
)
=
100∗(1+0.02)=102
Notes:
You can adjust the stopLossPerc and takeProfitPerc inputs to suit your risk management preferences.
Always backtest the strategy to ensure the stop loss and take profit levels are appropriate for your trading instrument and timeframe.
VWAP Suite by Augur - Multi PeriodOverview
The Multi-Timeframe VWAP Suite revolutionizes price analysis by combining institutional-grade volume-weighted pricing with multi-period deviation analytics. This professional toolkit simultaneously tracks VWAP across 5 time horizons (Daily to Yearly) with smart deviation bands, offering traders unparalleled insight into market structure and volatility dynamics.
Key Features
Multi-Timeframe VWAP Matrix
Simultaneous Daily/Weekly/Monthly/Quarterly/Yearly VWAP tracking
Institutional-level volume-weighted calculations
Independent timeframe toggles for focused analysis
Smart Deviation Architecture
Dual-layer standard deviation bands (1σ & 2σ)
Separate colors for upper/lower deviation zones
Adaptive 95% transparency fills for layered visualization
Professional Visual Design
Strategic color coding per timeframe (FIXED palette)
Dark Blue/Yellow/Purple/Pink/Red VWAP hierarchy
Orange-Green-Red-Blue deviation band system
Advanced Calculation Engine
HLC3 price source integration
Cumulative volume-weighting algorithm
Real-time standard deviation updates
Automatic Fibonacci retracement based on the highest high and loThe chart is fractal, meaning that what happens can always be broken down into smaller portions.
This is often seen in various AR (Algorithmic Rules) concepts, such as breakers, order blocks, etc., where the price reacts.
I’ve visualized this behavior with this indicator.
This indicator takes the highest high and the lowest low from the past 5 weeks, excluding the current week.
The lowest low will represent 0%, and the highest high will represent 100% (green lines).
It then divides this range into 25%, 50%, 75%, and 100% levels (red and blue lines).
The indicator works on all charts and all timeframes, automatically adjusting when you switch charts or timeframes. No manual input is required.
Additionally, above 100%, it will create levels at 125%, 150%, 175%, and 200%, while below 0%, it will create levels at -25%, -50%, -75%, and -100%.
Your chart will now be divided into these 25% levels, allowing you to observe how the price either respects or breaks through them.
Again, this isn’t something “groundbreaking,” but simply a visual aid to identify levels where the price finds support/resistance or breaks through.
It helps me gain a broader perspective and determine whether my trade is moving in the right direction or if I should remain cautious.

QT RSI [ W.ARITAS ]The QT RSI is an innovative technical analysis indicator designed to enhance precision in market trend identification and decision-making. Developed using advanced concepts in quantum mechanics, machine learning (LSTM), and signal processing, this indicator provides actionable insights for traders across multiple asset classes, including stocks, crypto, and forex.
Key Features:
Dynamic Color Gradient: Visualizes market conditions for intuitive interpretation:
Green: Strong buy signal indicating bullish momentum.
Blue: Neutral or observation zone, suggesting caution or lack of a clear trend.
Red: Strong sell signal indicating bearish momentum.
Quantum-Enhanced RSI: Integrates adaptive energy levels, dynamic smoothing, and quantum oscillators for precise trend detection.
Hybrid Machine Learning Model: Combines LSTM neural networks and wavelet transforms for accurate prediction and signal refinement.
Customizable Settings: Includes advanced parameters for dynamic thresholds, sensitivity adjustment, and noise reduction using Kalman and Jurik filters.
How to Use:
Interpret the Color Gradient:
Green Zone: Indicates bullish conditions and potential buy opportunities. Look for upward momentum in the RSI plot.
Blue Zone: Represents a neutral or consolidation phase. Monitor the market for trend confirmation.
Red Zone: Indicates bearish conditions and potential sell opportunities. Look for downward momentum in the RSI plot.
Follow Overbought/Oversold Boundaries:
Use the upper and lower RSI boundaries to identify overbought and oversold conditions.
Leverage Advanced Filtering:
The smoothed signals and quantum oscillator provide a robust framework for filtering false signals, making it suitable for volatile markets.
Application: Ideal for traders and analysts seeking high-precision tools for:
Identifying entry and exit points.
Detecting market reversals and momentum shifts.
Enhancing algorithmic trading strategies with cutting-edge analytics.

[COG]MTF RZP Heatmap MTF RZP Heatmap (Range Zone Pulse)
What It Does
This indicator creates three visual heatmaps that show how current price movement compares to the average range of different timeframes. It helps traders:
Identify when price moves are overextended
Compare momentum across different timeframes
Spot potential reversal points
Understand the relative strength of price movements
How It Works
Range Calculation:
For each selected timeframe, it calculates an average range based on the specified number of periods
The range is measured from high to low for each period
A moving average of these ranges creates a dynamic "normal" range for that timeframe
Position Calculation:
Measures how far price has moved from the period's opening price
Compares this movement to the average range
Converts the movement into a percentage (-100% to +100%)
Visual Display:
Shows three vertical heatmaps, one for each timeframe
Colors graduate from bearish (typically red) to bullish (typically green)
A dot indicator shows the current position within each range
Percentage labels show exact movement relative to average range
Trading Applications
Trend Trading:
Multiple timeframes aligned in the same color suggest strong trend
Use larger timeframes (Daily/Weekly) for trend direction
Use smaller timeframes (4H/1H) for entry timing
Mean Reversion:
Extreme readings (near +100% or -100%) suggest overextended moves
Look for divergences between timeframes
Use when shorter timeframes show extremes but larger timeframes don't
Volatility Trading:
Compare current moves to average ranges
Identify when markets are more volatile than usual
Adjust position sizes based on range expansion/contraction
Multi-Timeframe Analysis:
Compare price action across different time horizons
Identify conflicting signals between timeframes
Use for timeframe alignment in trading decisions
Best Practices for Usage
Timeframe Selection:
Set the first timeframe to your trading timeframe
Set the second timeframe to your trend timeframe
Set the third timeframe to your entry timeframe
Range Period Settings:
Default is 5 periods
Increase for more stable readings
Decrease for more responsive readings
Color Interpretation:
Darker colors indicate stronger moves
Look for alignment across timeframes
Watch for extremes in any timeframe
Trading Setups:
Wait for alignment in multiple timeframes
Use extreme readings for counter-trend trades
Combine with other indicators for confirmation

RSI & DPO support/resistanceThis indicator combines the Relative Strength Index (RSI) to identify overbought and oversold conditions with the Detrended Price Oscillator (DPO) to highlight support and resistance levels.
Unlike traditional indicators that display these metrics in a separate window, this tool integrates them directly onto the main price chart.
This allows for a more cohesive analysis, enabling traders to easily visualize the relationship between price movements and momentum indicators in one unified view.
How to Use It:
Identify Overbought and Oversold Conditions:
Look for RSI values above 70 to identify overbought conditions, suggesting a potential price reversal or pullback. Conversely, RSI values below 30 indicate oversold conditions, which may signal a potential price bounce or upward movement.
Analyze Support and Resistance Levels:
Observe the DPO lines on the main chart to identify key support and resistance levels. When the price approaches these levels, it can provide insights into potential price reversals or breakouts.
Combine Signals for Trading Decisions:
Use the RSI and DPO signals together to make informed trading decisions. For example, if the RSI indicates an overbought condition while the price is near a resistance level identified by the DPO, it may be a good opportunity to consider selling or taking profits.
Monitor Divergences:
Watch for divergences between the RSI and price movements. If the price is making new highs while the RSI is not, it could indicate weakening momentum and a potential reversal.
Set Alerts:
Consider setting alerts for when the RSI crosses above or below the overbought or oversold thresholds, or when the price approaches significant support or resistance levels indicated by the DPO.
Practice Risk Management:
Always use proper risk management techniques, such as setting stop-loss orders and position sizing, to protect your capital while trading based on these indicators.
By following these steps, traders can effectively utilize this indicator to enhance their market analysis and improve their trading strategies.

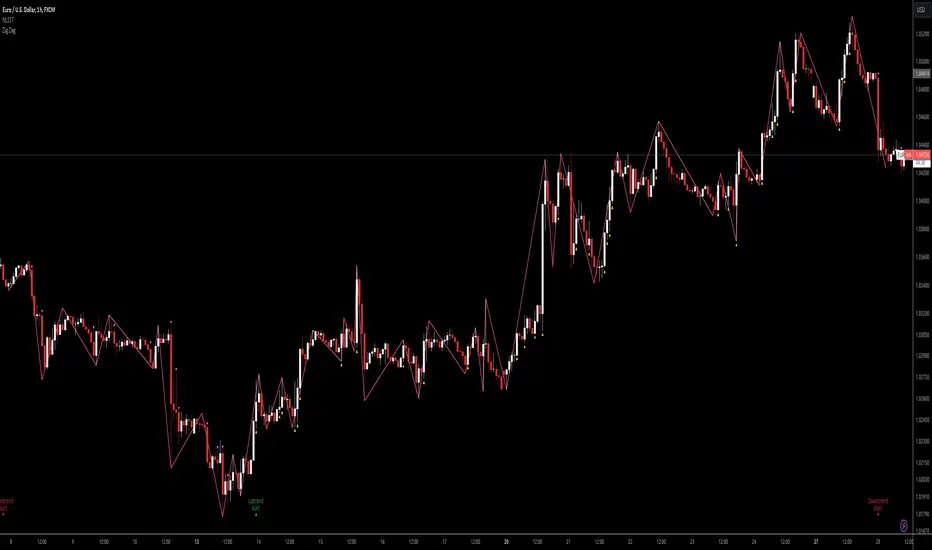
Next level scolilay swing timerThe "Next Level Scolilay Swing Timer" is an advanced TradingView indicator designed to help traders navigate trends, reversals, and swing opportunities with ease. It's built around several key concepts like ATR filtering, ZigZag analysis, and momentum-based trend detection, making it a powerful tool for identifying market direction and key trading opportunities.
One of the standout features is its ability to filter candles using the Average True Range (ATR). This ensures that the indicator focuses on meaningful price movements rather than noise. You can tweak the ATR settings to suit your trading style, deciding how much historical data to consider or even turning the filter off completely if you prefer.
The script also integrates a ZigZag algorithm to detect pivot points, which it uses to evaluate swings in price action. This feature comes with customizable settings for depth and sensitivity, allowing you to adjust how the script reacts to price fluctuations. By analyzing these swings, the indicator identifies key highs and lows, which play a big role in determining whether the market is trending up or down.
When it comes to trends, the script is smart and flexible. It doesn't just look for higher highs or lower lows; it also considers momentum and retracement levels to decide if a trend is gaining strength or reversing. For example, it uses one-third retracement logic to spot sudden shifts in market direction, which can be critical for catching reversals early. You can also enable features like fast trend switching, which reacts to single-candle events that might signal a trend break.
Visualization is another area where this script shines. It marks uptrends and downtrends directly on the chart with clear labels, so you can instantly see when a new trend starts. Pink arrows appear above candles to signal potential downtrends, while yellow arrows below candles indicate possible uptrends. These signals combine multiple layers of analysis, like swing validation, ATR filtering, and trend confirmation, to give you reliable insights.
What makes the Swing Timer especially useful is its flexibility. Whether you’re a trend trader looking to ride major market moves, a swing trader focused on pivot points, or someone hunting for reversals, you can customize the settings to fit your needs. You can adjust everything from ZigZag and ATR parameters to how trends are labeled and filtered. The result is a tool that adapts to your trading style while still providing clear and actionable signals.
In short, this script brings together a range of advanced trading concepts into one user-friendly package. It’s perfect for traders who want to see market trends clearly, identify opportunities with confidence, and stay ahead of sudden reversals—all without getting bogged down in unnecessary complexity.
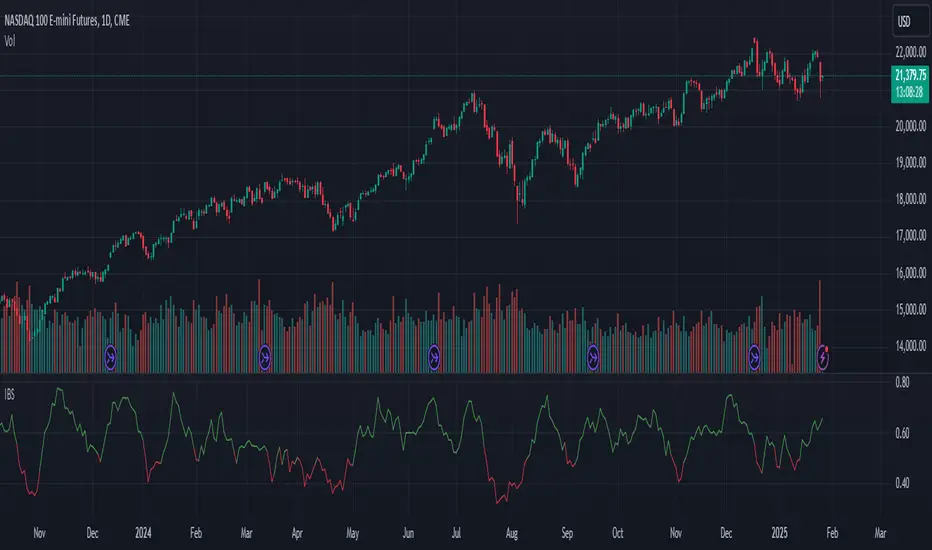
Internal Bar StrengthShort Description:
This indicator calculates the Internal Bar Strength (IBS) for each bar, which measures the close price’s relative position within that bar’s high-low range, and then optionally smooths that value with a selected moving average.
What Does It Measure?
Internal Bar Strength (IBS):
The IBS formula is (close-low)/(high-low)
. This ratio indicates where the closing price lies within a bar’s trading range:
A value near 0 means the close is near the bar’s low.
A value near 1 means the close is near the bar’s high.
A value of 0.5 means the close is exactly in the middle of the bar’s range.
Smoothing (Moving Averages):
You can choose to smooth the IBS value with one of five different moving average types: RMA, SMA, EMA, WMA, or VWMA. The default length for smoothing is 10, but this can be adjusted for more or less sensitivity.
Key Features
Multiple MA Options:
RMA: Also known as the Wilder’s moving average, it reacts slightly slower to changes than EMA.
SMA: Simple moving average, straightforward average of the last n values.
EMA: Exponential moving average, places more weight on recent data.
WMA: Weighted moving average, linear weighting from oldest to newest data.
VWMA: Volume-weighted moving average, weights price by trading volume.
Color Coding:
Green when IBS is greater than 0.5.
Red when IBS is less than or equal to 0.5.
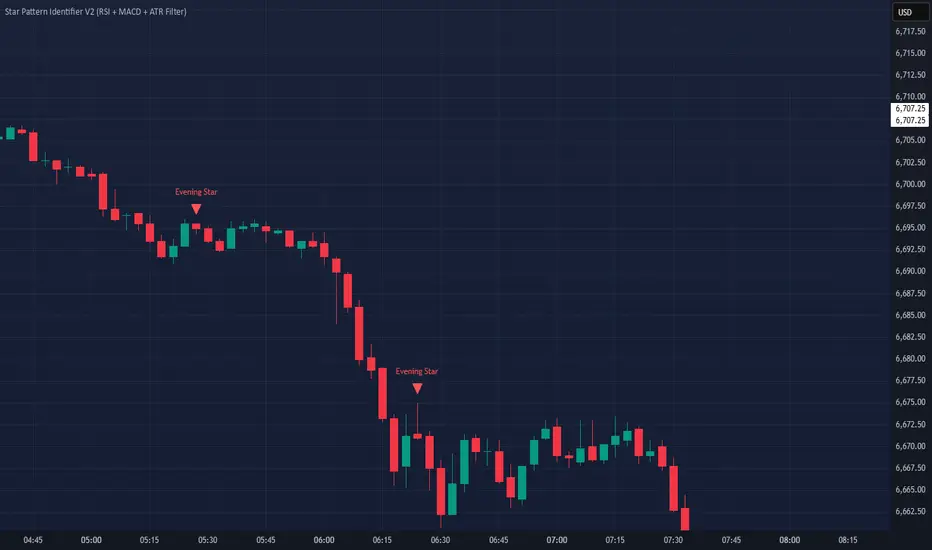
Star Pattern IdentifierThe Star Pattern Identifier is a custom TradingView indicator designed to detect and mark Morning Star (MS) and Evening Star (ES) candlestick patterns, which are powerful reversal signals. This indicator offers a flexible and customizable approach by incorporating adjustable parameters for both the size and volume of the third candle in the pattern.
Key Features:
Morning Star (MS) : A bullish reversal pattern that occurs after a downtrend.
Evening Star (ES) : A bearish reversal pattern that occurs after an uptrend.
Adjustable Parameters:
Third Candle Size Multiplier : Define how large the body of the third candle should be relative to the second candle (default is 2x).
Third Candle Volume Multiplier : Control the minimum volume of the third candle in relation to the second candle (default is 0.5x).
The script ensures that the third candle’s volume is at least 50% of the second candle's volume and that its body is at least twice the size of the second candle, to filter out weaker signals.
The patterns are marked directly on the chart with "MS" (Morning Star) or "ES" (Evening Star) labels for easy identification.
Practical Use:
Use this indicator to spot potential trend reversals with more confidence by ensuring strong candlestick body and volume conditions.
Customize the parameters to suit your trading strategy and preferences.
How it Works:
The indicator looks for a bearish first candle , followed by a bullish or indecisive second candle , and a bullish third candle for the Morning Star pattern.
For the Evening Star, the indicator looks for a bullish first candle , followed by a bearish or indecisive second candle , and a bearish third candle .
The size and volume of the third candle are checked to ensure it meets the set parameters, confirming the strength of the reversal signal.
This tool is perfect for traders seeking to spot reversal signals in the market.
Combo The "Combo" Indicator is a visual tool for TradingView that allows traders to clearly display their analysis based on OrderBloque concepts.
Key points to understand:
The indicator does NOT perform automatic market analysis
It serves as a configurable visualization tool for your personal analysis
Key Features:
Manual Configuration: You select a timeframe and function for each variable (V1 to V4)
Function Options:
VC (Volume Confirmation)
FP (Fractal Point)
LI (Liquidity)
EX (Execution)
Combinations like VC, VC, VC (EX)
Timeframe Range: Selectable from 5 minutes to 1 month
Tabular Display: Shows your inputs in a clear table on the chart
Customizable Appearance: Adjustable table position, colors, and text size

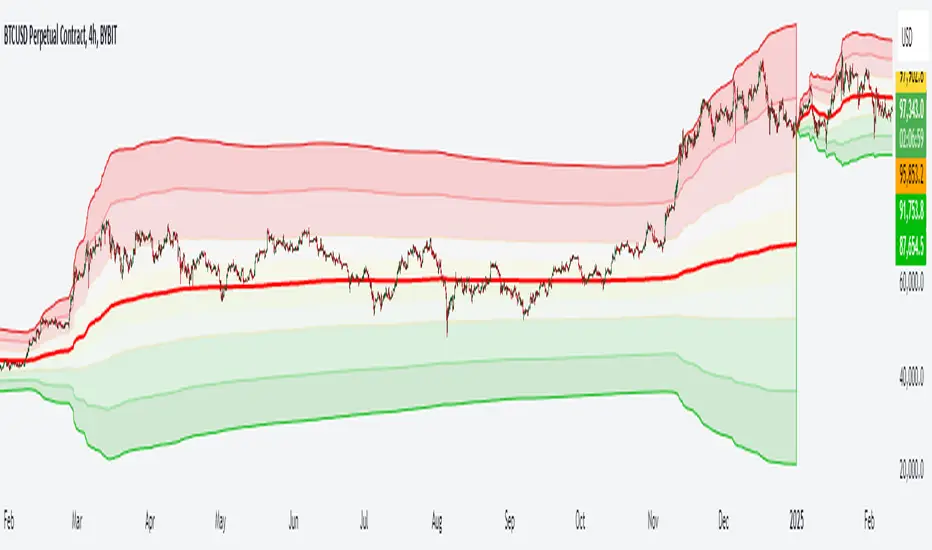
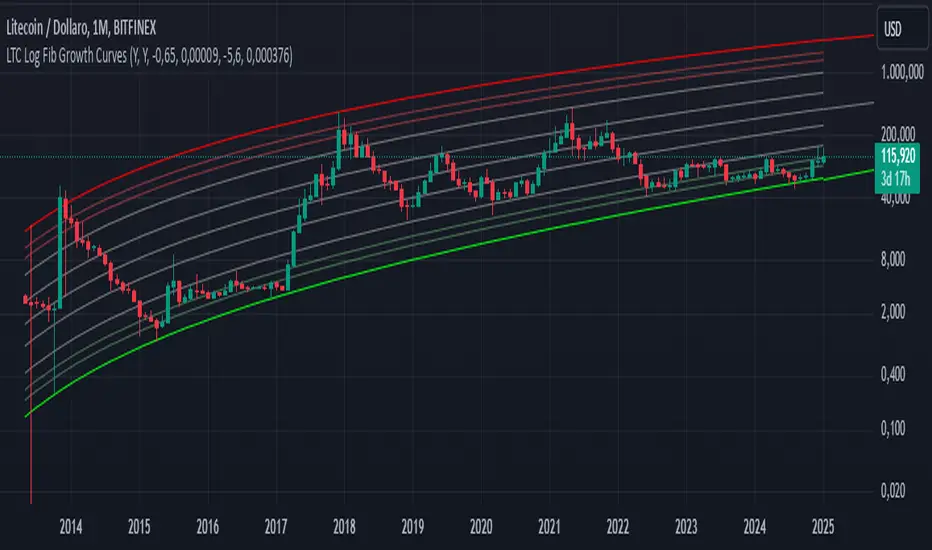
Litecoin LTC Logarithmic Fibonacci Growth CurvesHOW THIS SCRIPT IS ORIGINAL: there is no similar script dedicated to LTC, although there are similar ones dedicated to BTC. (This was created by modifying an old public and open source similar script dedicated to BTC.)
WHAT THIS SCRIPT DOES: draws a channel containing the price of LTC within which the Fibonacci extensions are highlighted. The reference chart to use is LTC/USD on Bitfinex (because it has the oldest data, given that Tradingview has not yet created an LTC index), suggested with weekly or monthly timeframe.
HOW IT DOES IT: starting from two basic curves that average the upper and lower peaks of the price, the relative Fibonacci extensions are then built on the basis of these: 0.9098, 0.8541, 0.7639, 0.618, 0.5, 0.382, 0.2361, 0.1459, 0.0902.
HOW TO USE IT: after activating the script you will notice the presence of two areas of particular interest, the upper area, delimited in red, which follows the upper peaks of the price, and the lower area, delimited in green, which follows the lower peaks of the price. Furthermore, the main curves, namely the two extremes and the median, are also projected into the future to predict an indicative trend. This script is therefore useful for understanding where the price will go in the future and can be useful for understanding when to buy (near the green lines) or when to sell (near the red lines). It is also possible to configure the script by choosing the colors and types of lines, as well as the main parameters to define the upper and lower curve, from which the script deduces all the other lines that are in the middle.
Very easy to read and interpret. I hope this description is sufficient, but it is certainly easier to use it than to describe it.
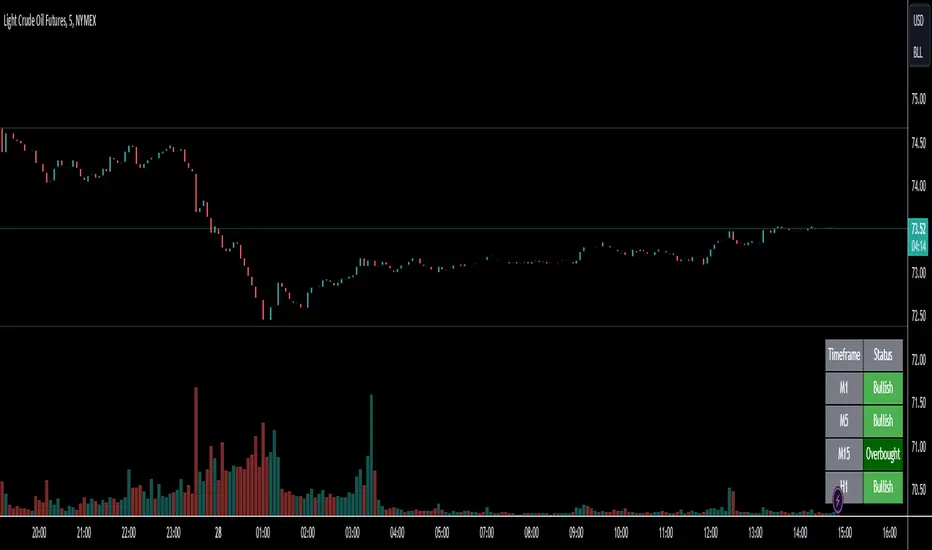
Multi-Timeframe Stochastic OverviewPurpose of the Multi-Timeframe Stochastic Indicator:
The Multi-Timeframe Stochastic Indicator provides a consolidated view of market conditions across multiple timeframes (M1, M5, M15, H1) based on the Stochastic Oscillator, a popular technical analysis tool. The main objective is to allow traders to quickly assess momentum and potential trend reversals across different timeframes on a single chart, helping to make informed trading decisions.
---
General Purpose of Stochastic Oscillator:
The Stochastic Oscillator measures the relationship between a security's closing price and its price range over a given period, aiming to identify momentum, overbought/oversold levels, and potential reversal points. It works on the assumption that:
1. In uptrends, prices tend to close near their highs.
2. In downtrends, prices tend to close near their lows.
It consists of two lines:
%K (fast line): Represents the raw Stochastic value.
%D (slow line): A moving average of %K, used to smooth the data for better signals.
The indicator is generally used to:
Identify Overbought (price above 80% threshold) and Oversold (price below 20% threshold) conditions.
Spot Bullish and Bearish divergences for potential trend reversals.
Evaluate momentum strength within a trend.
---
How This Multi-Timeframe Indicator Enhances Stochastic's Utility:
1. Multi-Timeframe Overview:
The indicator calculates Stochastic values for multiple timeframes (1-minute, 5-minute, 15-minute, and 1-hour) and displays their market conditions (e.g., Bullish, Bearish, Overbought, Oversold, or Indecision) in an organized table format.
This gives traders a broad perspective on short-term, mid-term, and long-term trends simultaneously.
2. Market Condition Summary:
Bullish: Indicates upward momentum (both %K and %D > 50%).
Bearish: Indicates downward momentum (both %K and %D < 50%).
Overbought: Suggests potential trend exhaustion (both %K and %D > 80%).
Oversold: Suggests a potential reversal to the upside (both %K and %D < 20%).
Indecision: Highlights uncertainty when %K and %D are on opposite sides of the 50% level.
3. Quick Decision-Making:
The color-coded table (green for Bullish/Overbought, red for Bearish/Oversold, orange for Indecision) allows traders to quickly identify dominant conditions and momentum alignment across timeframes, helping in trade confirmation.
4. Trend Analysis:
By observing alignment or divergence in market conditions across timeframes, traders can gauge the strength of a trend or anticipate reversals. For example:
If all timeframes show "Bullish," it suggests strong momentum.
If smaller timeframes are "Overbought" while larger ones are "Bearish," it warns of a possible pullback.
5. Customizable Parameters:
The indicator allows customization of Stochastic K, D, smoothing values, and overbought/oversold levels, enabling users to tailor the analysis to specific trading styles or market conditions.
---
Use Cases:
1. Scalping:
A scalper can use lower timeframes (e.g., M1, M5) to find overbought/oversold zones for quick trades.
2. Swing Trading:
Swing traders can align smaller timeframes with higher ones (e.g., M15 and H1) to confirm momentum before entering a trade.
3. Trend Reversals:
Overbought or oversold conditions across all timeframes may indicate a major reversal point, helping traders plan exits or countertrend entries.
4. Trend Continuation:
Consistent bullish or bearish conditions across all timeframes confirm the continuation of a trend, providing confidence to hold positions.
---
Summary:
This indicator enhances the traditional Stochastic Oscillator by giving a multi-timeframe snapshot of market momentum, overbought/oversold conditions, and trend direction. It enables traders to quickly assess the overall market state, spot opportunities, and make more informed trading decisions.
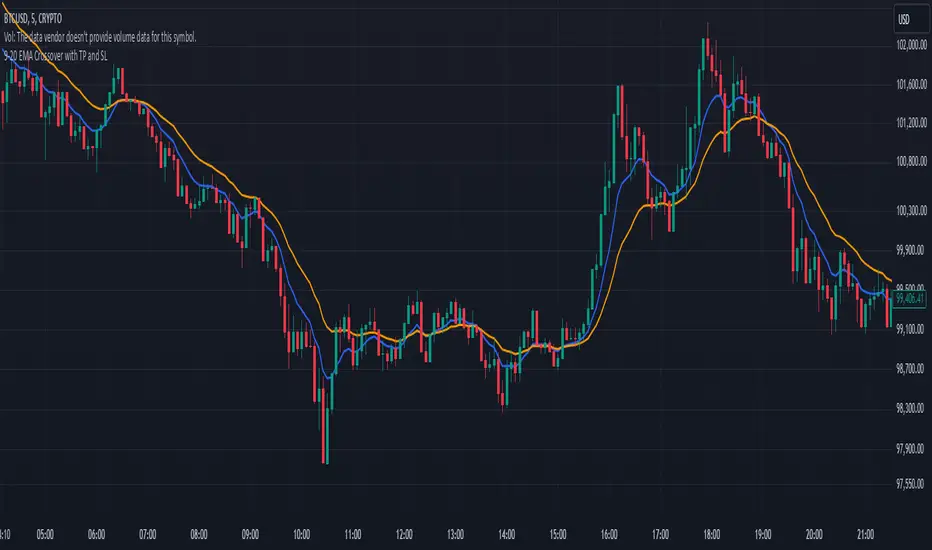
9-20 EMA Crossover with TP and SL9-20 EMA Crossover: This script tracks the crossover of the 9-period EMA and the 20-period EMA.
When the 9 EMA crosses above the 20 EMA, a buy signal is triggered.
When the 9 EMA crosses below the 20 EMA, a sell signal is triggered.
Take Profit and Stop Loss Levels:
The take profit for a long position is set at 3% above the entry price (close * 1.03).
The stop loss for a long position is set at 1% below the entry price (close * 0.99).
The take profit for a short position is set at 3% below the entry price (close * 0.97).
The stop loss for a short position is set at 1% above the entry price (close * 1.01).
Leverage: The strategy uses 20x leverage for both long and short positions (leverage=20).
Alerts: Alerts are set up for the buy signal when the 9 EMA crosses above the 20 EMA and the sell signal when the 9 EMA crosses below the 20 EMA. These alerts can be used with a webhook to trigger trades on Binance Futures.
Strategy:
For long trades: The strategy enters a long position and sets a take profit at 3% above the entry price and a stop loss at 1% below the entry price.
For short trades: The strategy enters a short position and sets a take profit at 3% below the entry price and a stop loss at 1% above the entry price.
Scalping trading system based on 4 ema linesScalping Trading System Based on 4 EMA Lines
Overview:
This is a scalping trading strategy built on signals from 4 EMA moving averages: EMA(8), EMA(12), EMA(24) and EMA(72).
Conditions:
- Time frame: H1 (1 hour).
- Trading assets: Applicable to major currency pairs with high volatility
- Risk management: Use a maximum of 1-2% of capital for each transaction. The order holding time can be from a few hours to a few days, depending on the price fluctuation amplitude.
Trading rules:
Determine the main trend:
Uptrend: EMA(8), EMA(12) and EMA(24) are above EMA(72).
Downtrend: EMA(8), EMA(12) and EMA(24) are below EMA(72).
Trade in the direction of the main trend** (buy in an uptrend and sell in a downtrend).
Entry conditions:
- Only trade in a clearly trending market.
Uptrend:
- Wait for the price to correct to the EMA(24).
- Enter a buy order when the price closes above the EMA(24).
- Place a stop loss below the bottom of the EMA(24) candle that has just been swept.
Downtrend:
- Wait for the price to correct to the EMA(24).
- Enter a sell order when the price closes below the EMA(24).
- Place a stop loss above the top of the EMA(24) candle that has just been swept.
Take profit and order management:
- Take profit when the price moves 20 to 40 pips in the direction of the trade.
Use Trailing Stop to optimize profits instead of setting a fixed Take Profit.
Note:
- Do not trade within 30 minutes before and after the announcement of important economic news, as the price may fluctuate abnormally.
Additional filters:
To increase the success rate and reduce noise, this strategy uses additional conditions:
1. The price is calculated only when the candle closes (no repaint).
2. When sweeping through EMA(24), the price needs to close above EMA(24).
3. The closing price must be higher than 50% of the candle's length.
4. **The bottom of the candle sweeping through EMA(24) must be lower than the bottom of the previous candle (liquidity sweep).
---
Alert function:
When the EMA(24) sweep conditions are met, the system will trigger an alert if you have set it up.
- Entry point: The closing price of the candle sweeping through EMA(24).
- Stop Loss:
- Buy Order: Place at the bottom of the sweep candle.
- Sell Order: Place at the top of the sweep candle.
---
Note:
This strategy is designed to help traders identify profitable trading opportunities based on trends. However, no strategy is 100% guaranteed to be successful. Please test it thoroughly on a demo account before using it.

Market Sessions and OverlapsMarket Sessions and Overlaps Indicator
This script, titled " Market Sessions and Overlaps ," provides a detailed visualization of major global trading sessions—Asia, Europe, and New York—along with the periods where these sessions overlap. It is designed to assist traders in understanding session timings and overlaps in their local time zone. Key features include:
Session Visualization: Highlights the Asia, Europe, and New York trading sessions directly on the chart with customizable colors and transparency for better clarity.
Overlap Identification: Marks the overlapping periods between Asia-Europe and Europe-New York sessions, where market activity often intensifies, with distinct candle colors.
Time Zone Support: The script allows users to select their local time zone, ensuring all session times are displayed accurately, no matter the user’s location.
Alerts for Key Events: Includes optional alerts to notify users of session openings, closings, and the start or end of overlap periods.
This indicator serves as a visual tool for tracking session-specific activity and liquidity. It is configurable to match individual preferences, enabling better alignment with trading strategies.
Disclaimer: This script is for informational purposes only and does not provide financial advice. Please consult a licensed financial advisor for personalized trading guidance.

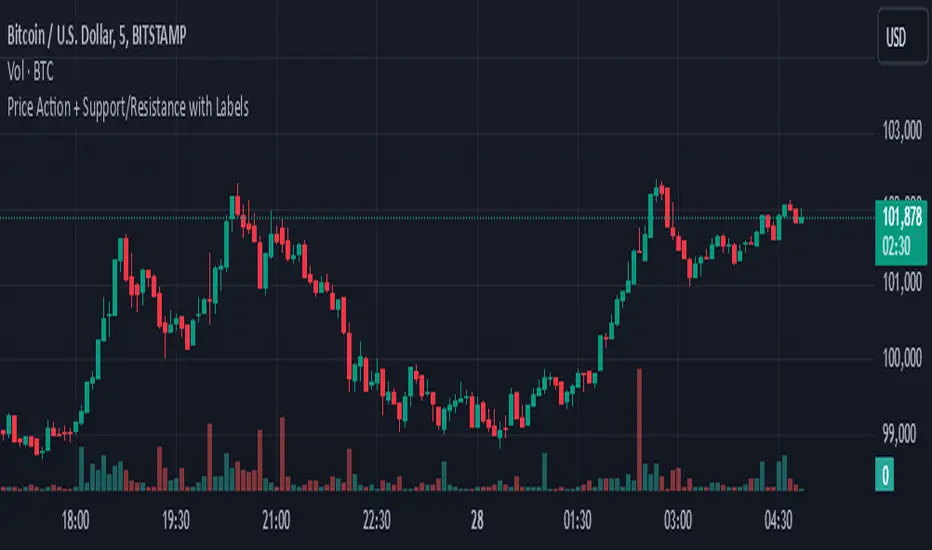
Price Action + Support/Resistance with LabelsEntry Conditions:
Long Entry (BUY): Based on the bullish engulfing pattern and price being above the resistance level.
Short Entry (SELL): For demonstration, the short entry condition is set as price being below the support level and a bullish candle in the previous bar. You can modify this logic for your own use case.
Stop Loss and Take Profit:
Stoploss is plotted at the calculated stop loss level.
Target is plotted at the calculated take profit level.
Labels:
For long trades, labels are added with "BUY", "STOPLOSS", and "TARGET".
For short trades (if enabled), labels are added with "SELL", "STOPLOSS", and "TARGET".
Labels are placed using label.new at specific locations on the chart (above or below bars).
Alert Conditions:
Alerts are created for both long and short entry signals so you can get notified when the entry conditions are met.
How it works:
BUY label will appear below the bar when a long entry condition is met.
SELL label will appear above the bar when a short entry condition is met.
STOPLOSS and TARGET labels will appear at their respective levels when an entry signal is triggered.
The labels will appear on the chart to give you a clear visual cue of the entry, stop loss, and take profit levels.
How to Use:
Copy the script into your Pine Editor on TradingView and apply it to your chart.
Observe the labels that show up on the chart:
"BUY" will appear below the bar when long conditions are met.
"SELL" will appear above the bar when short conditions are met (if using short logic).
"STOPLOSS" will be plotted at the stop loss level.
"TARGET" will be plotted at the take profit level.
Optional Customization:
You can modify the short entry condition based on your preferred method.
You can adjust the length for the support/resistance calculation, the stopLossRR, and other parameters to fine-tune the strategy for Nifty 50 or any other asset.
Let me know if you have any further questions or need additional modifications!
Auto Fibonacci Extension and Retracement with Visual AlertsThis indicator automatically calculates and plots Fibonacci retracement and extension levels based on recent swing highs and lows, making it a powerful tool for traders who use Fibonacci analysis in their strategies.
Key Features:
• Dynamic Fibonacci Levels: Automatically detects swing highs and lows over a user-defined lookback period to calculate key Fibonacci retracement (e.g., 0.236, 0.382, 0.618, etc.) and extension (e.g., 1.618, 2.618, etc.) levels.
• Visual Alerts: Displays intuitive visual alerts when the price crosses important Fibonacci levels.
• Blue dashed lines for retracement levels.
• Green dashed lines for extension levels.
• Labels with up or down arrows indicating price interactions with these levels.
• Swing High/Low Visualization: Marks recent swing highs and lows with crosses for better clarity.
• Customizable: Adjust the lookback period and Fibonacci levels to suit your trading style.
Who is it for?
This indicator is perfect for:
• Swing Traders: To identify potential reversal or continuation zones.
• Day Traders: For short-term setups based on Fibonacci levels.
• Fibonacci Enthusiasts: To automate the time-consuming process of manually plotting levels.
Usage Ideas:
1. Use retracement levels (e.g., 0.618) to identify areas of potential support or resistance.
2. Use extension levels (e.g., 1.618) to target potential breakout or continuation zones.
3. Combine this indicator with candlestick patterns, volume analysis, or other tools for confirmation.
Limitations:
• This is a standalone indicator and does not provide buy/sell signals. It’s recommended to combine it with other technical analysis tools for best results.
• The lookback period and swing detection rely on past data, so adjustments may be needed based on the asset or timeframe.
Whether you’re looking to streamline your Fibonacci analysis or explore new opportunities in your trading, this indicator is designed to save time, increase accuracy, and enhance your overall trading experience.

Strong Buy/Sell with Demand/Supply and Volume HighlightStrong Buy/Sell with Demand/Supply and Volume Highlight
This indicator combines key technical elements to provide traders with robust buy and sell signals while highlighting significant market zones and volume trends. It's designed for traders seeking clarity and precision in their decision-making process.
Features:
Dynamic Buy/Sell Signals:
Utilizes the crossover of a fast EMA (default: 9) and a slow EMA (default: 21) to generate reliable buy and sell signals.
Buy signals are marked with green upward labels, while sell signals are marked with red downward labels.
Demand and Supply Zone Detection:
Automatically plots demand (support) and supply (resistance) zones based on recent price movements when buy or sell signals are triggered.
Zones are visually marked with lines for quick identification of key price levels.
Volume Analysis:
Highlights candles with high volume relative to the average 20-period volume (adjustable via the volume multiplier input).
High-volume bullish candles are marked green, and bearish candles are marked red, allowing traders to spot significant market activity instantly.
Inputs:
EMA Periods: Customizable fast and slow EMA settings to adjust signal sensitivity.
Demand/Supply Zones: Option to toggle the visibility of demand and supply levels.
Volume Multiplier: Control the threshold for detecting high-volume candles.
How to Use:
Buy Opportunities: Look for buy signals when the fast EMA crosses above the slow EMA, supported by demand zones and high volume.
Sell Opportunities: Observe sell signals when the fast EMA crosses below the slow EMA, reinforced by supply zones and bearish high-volume candles.
Combine this indicator with your trading strategy to enhance decision-making and improve trade timing.
This indicator is suitable for multiple timeframes and markets, making it a versatile tool for scalpers, day traders, and swing traders.

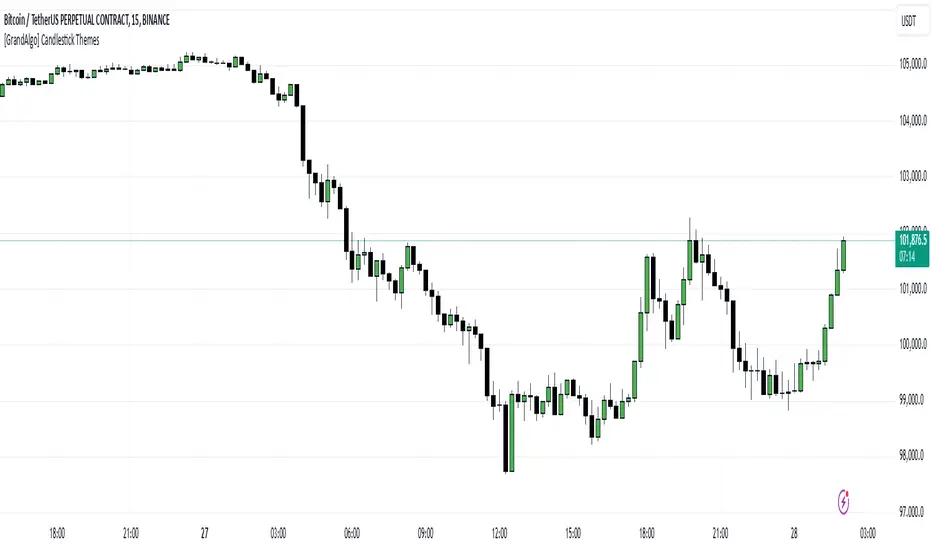
[GrandAlgo] Candlestick ThemesTransform your TradingView charts with Candlestick Themes, an indicator that customizes candlestick colors using a variety of stunning themes. Whether you’re seeking improved clarity, enhanced personalization, or a fresh visual appeal, this indicator has something for everyone.
Key Features
This indicator offers a wide selection of pre-defined themes:
TradingView Default: The classic, familiar look of TradingView charts.
GrandAlgo: Our exclusive brand theme, blending vibrancy and professionalism for an exceptional charting experience.
MetaTrader-Inspired Themes: Green on Black, Yellow on Black, and Black on White, designed to replicate the iconic MetaTrader aesthetics.
Green Black: A calming and balanced theme for focused trading.
Darkblue Red: A bold and impactful combination with rich tones.
Darkblue Black: A subtle, sleek palette perfect for minimalists.
Lightblue Red: A mix of warm and cool tones for balanced visuals.
Lightblue Red (Gradient): Adds smooth transitions for a modern feel.
Lightblue Black: Crisp and clean for improved readability.
Crimson to Calm: A gradient theme transitioning from bold to tranquil tones.
Robinhood: Inspired by the clean and vibrant look of the popular trading platform.
Warm & Cool Harmony: A seamless blend of warm and cool tones.
Valentine: Passionate reds and pinks for a romantic visual.
Christmas: Festive greens and reds to match the holiday spirit.
Grapes: A playful mix of purples and greens.
Desert: Warm, sandy hues inspired by desert landscapes.
Real Madrid: A sporty theme with iconic colors for fans.
This indicator ensures seamless integration with TradingView charts, offering personalized trading experience. Whether you're a seasoned trader or just starting, these themes will make your charts both functional and visually appealing.
New intraday high with weak barStrategy Logic:
The strategy checks if the current bar’s high is the highest high of the last 10 bar and if internal bar strength is less than 0.15.
Position is closed when close is greater than the previous bar’s high.
When a position is open, the script applies a light green background on the chart to signal that you are in a trade.
