Eagle Ford play.ppt
- 1. Eagle Ford play map
- 2. A Map of Eagle Ford Shale Play
- 3. Dallas-Fort Worth Eagle Ford dip cross section
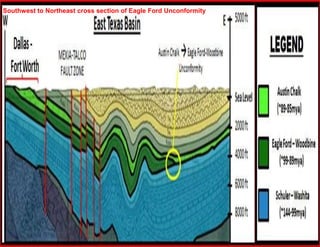
- 4. Southwest to Northeast cross section of Eagle Ford Unconformity
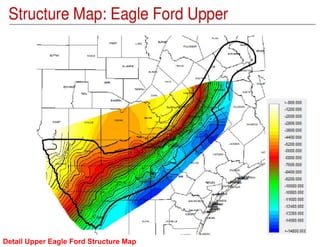
- 5. Detail Upper Eagle Ford Structure Map
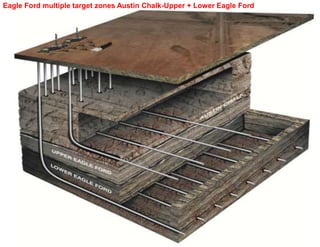
- 6. Eagle Ford multiple target zones Austin Chalk-Upper + Lower Eagle Ford
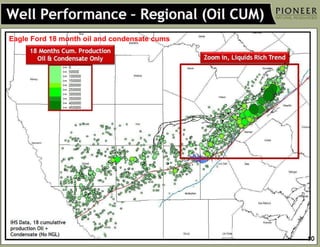
- 7. Eagle Ford 18 month oil and condensate cums
- 8. Eagle Ford oil-condensate EUR map
- 10. Eagle Ford Shale Surface Faults
- 11. interval isopach Eagle Ford shale
- 12. Eagle Ford thickness and oil-gas condensate-dry gas windows
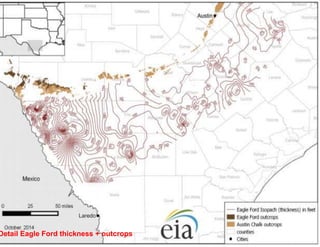
- 13. Detail Eagle Ford thickness + outcrops
- 14. Eagle Ford oil-condensate gas-gas windows
- 15. Eagle Ford Shale Oil Gravity
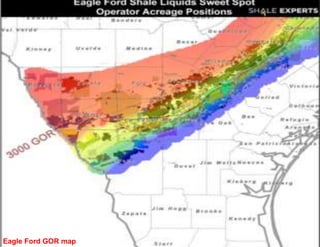
- 16. Eagle Ford GOR map
- 17. Eagle Ford players since 6-1-2008
- 18. Eagle Ford lease costs
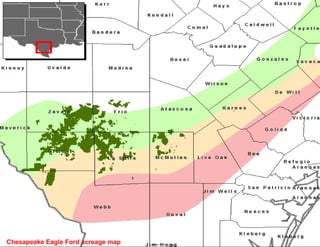
- 19. Chesapeake Eagle Ford acreage map
- 20. map of Sanchez Eagle Ford acreage sold to Carrizo
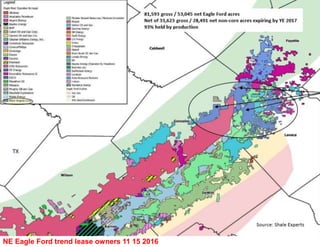
- 21. NE Eagle Ford trend lease owners 11 15 2016
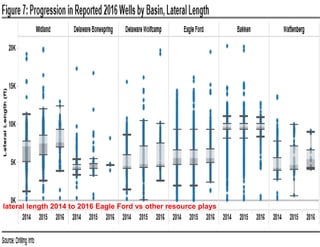
- 22. lateral length 2014 to 2016 Eagle Ford vs other resource plays
- 23. 30 day rate 2014 to 2016 Eagle Ford vs other resource plays
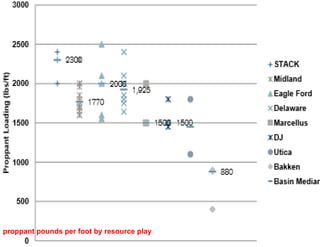
- 24. proppant pounds per foot by resource play
- 25. Wood Mackenzie average millions of pounds of proppant per well for resource plays 2012-2016
- 26. Eagle Ford proppant pounds per foot vs fluid pounds per foot
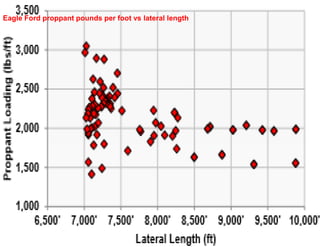
- 27. Eagle Ford proppant pounds per foot vs lateral length
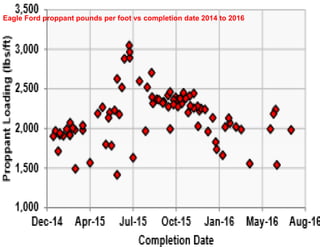
- 28. Eagle Ford proppant pounds per foot vs completion date 2014 to 2016
- 29. Eagle Ford frac fluid barrels per foot vs lateral length
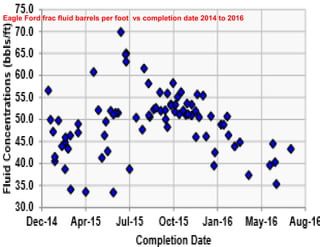
- 30. Eagle Ford frac fluid barrels per foot vs completion date 2014 to 2016
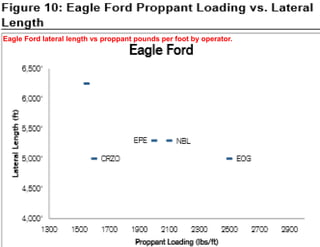
- 31. Eagle Ford lateral length vs proppant pounds per foot by operator.
- 32. Eagle Ford west vs east MBO vs days producing 2012 to 2016 EOG
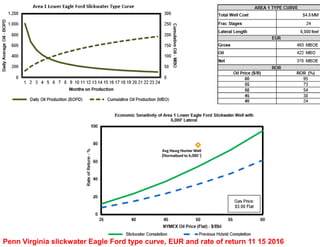
- 33. Penn Virginia slickwater Eagle Ford type curve, EUR and rate of return 11 15 2016
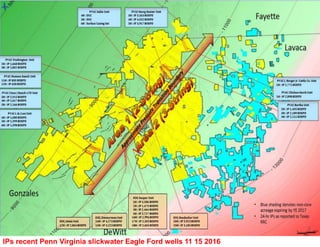
- 34. IPs recent Penn Virginia slickwater Eagle Ford wells 11 15 2016
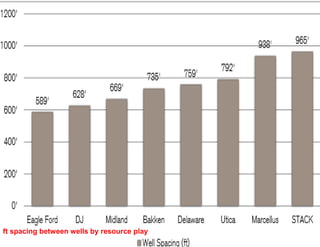
- 35. ft spacing between wells by resource play
- 37. break even oil price resource plays
- 38. mean and range in break even price various oil plays
- 39. Diamondback break even price various oil plays
- 40. breakeven price resource plays Rystad 2013 to 2016
- 41. resource play oil prod 2002 to 2016
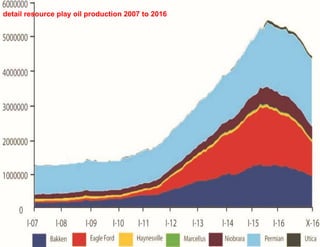
- 42. detail resource play oil production 2007 to 2016
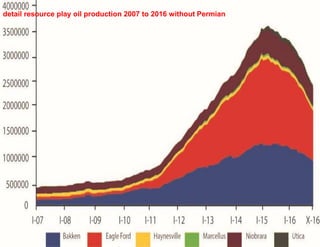
- 43. detail resource play oil production 2007 to 2016 without Permian
- 44. detail Eagle Ford oil production 2007 to 2016
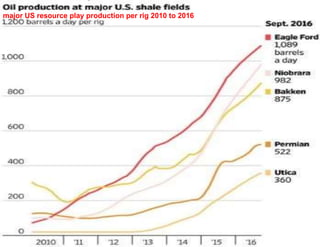
- 45. major US resource play production per rig 2010 to 2016
- 46. SPRE + IHS US oil prod forecast by resource play to end 2018
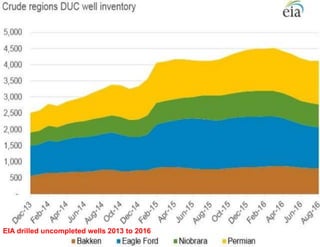
- 47. EIA drilled uncompleted wells 2013 to 2016
- 48. resource play gas prod 2000 to 2016
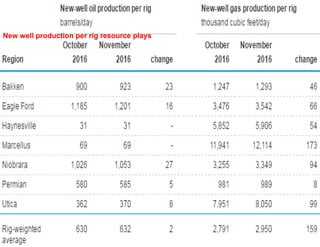
- 49. New well production per rig resource plays
- 50. 2014 to 2016 rig count Permian=red Eagle Ford=green TX rigs=gold Total US rigs=blue


