Utica, New York Submit your own pictures of this city and show them to the world
OSM Map
General Map
Google Map
MSN Map
OSM Map
General Map
Google Map
MSN Map
OSM Map
General Map
Google Map
MSN Map
OSM Map
General Map
Google Map
MSN Map
Please wait while loading the map...
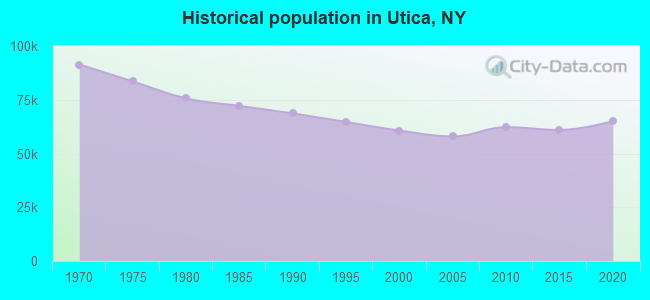
Population in 2022: 64,081 (100% urban, 0% rural). Population change since 2000: +5.7%Males: 32,014 Females: 32,067
March 2022 cost of living index in Utica: 99.8 (near average, U.S. average is 100) Percentage of residents living in poverty in 2022: 28.2%for White Non-Hispanic residents , 52.1% for Black residents , 28.1% for Hispanic or Latino residents , 31.2% for American Indian residents , 27.7% for other race residents , 35.1% for two or more races residents )
Profiles of local businesses
Business Search - 14 Million verified businesses
Data:
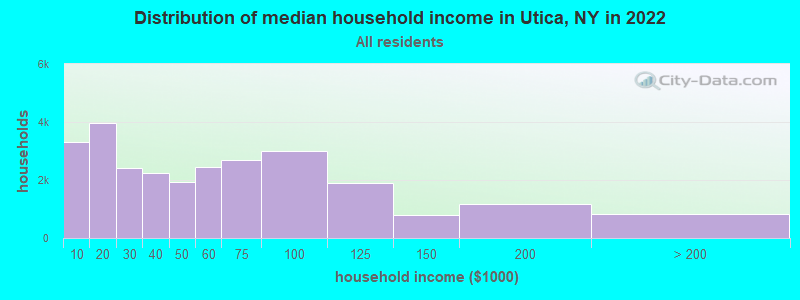
Median household income ($)
Median household income (% change since 2000)
Household income diversity
Ratio of average income to average house value (%)
Ratio of average income to average rent
Median household income ($) - White
Median household income ($) - Black or African American
Median household income ($) - Asian
Median household income ($) - Hispanic or Latino
Median household income ($) - American Indian and Alaska Native
Median household income ($) - Multirace
Median household income ($) - Other Race
Median household income for houses/condos with a mortgage ($)
Median household income for apartments without a mortgage ($)
Races - White alone (%)
Races - White alone (% change since 2000)
Races - Black alone (%)
Races - Black alone (% change since 2000)
Races - American Indian alone (%)
Races - American Indian alone (% change since 2000)
Races - Asian alone (%)
Races - Asian alone (% change since 2000)
Races - Hispanic (%)
Races - Hispanic (% change since 2000)
Races - Native Hawaiian and Other Pacific Islander alone (%)
Races - Native Hawaiian and Other Pacific Islander alone (% change since 2000)
Races - Two or more races (%)
Races - Two or more races (% change since 2000)
Races - Other race alone (%)
Races - Other race alone (% change since 2000)
Racial diversity
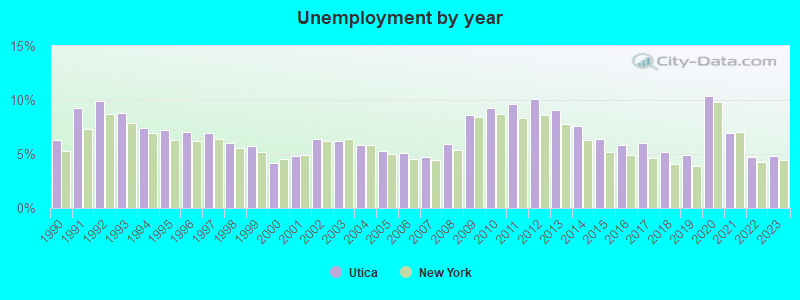
Unemployment (%)
Unemployment (% change since 2000)
Unemployment (%) - White
Unemployment (%) - Black or African American
Unemployment (%) - Asian
Unemployment (%) - Hispanic or Latino
Unemployment (%) - American Indian and Alaska Native
Unemployment (%) - Multirace
Unemployment (%) - Other Race
Population density (people per square mile)
Population - Males (%)
Population - Females (%)
Population - Males (%) - White
Population - Males (%) - Black or African American
Population - Males (%) - Asian
Population - Males (%) - Hispanic or Latino
Population - Males (%) - American Indian and Alaska Native
Population - Males (%) - Multirace
Population - Males (%) - Other Race
Population - Females (%) - White
Population - Females (%) - Black or African American
Population - Females (%) - Asian
Population - Females (%) - Hispanic or Latino
Population - Females (%) - American Indian and Alaska Native
Population - Females (%) - Multirace
Population - Females (%) - Other Race
Coronavirus confirmed cases (Feb 02, 2025)
Deaths caused by coronavirus (Feb 02, 2025)
Coronavirus confirmed cases (per 100k population) (Feb 02, 2025)
Deaths caused by coronavirus (per 100k population) (Feb 02, 2025)
Daily increase in number of cases (Feb 02, 2025)
Weekly increase in number of cases (Feb 02, 2025)
Cases doubled (in days) (Feb 02, 2025)
Hospitalized patients (Apr 18, 2022)
Negative test results (Apr 18, 2022)
Total test results (Apr 18, 2022)
COVID Vaccine doses distributed (per 100k population) (Sep 19, 2023)
COVID Vaccine doses administered (per 100k population) (Sep 19, 2023)
COVID Vaccine doses distributed (Sep 19, 2023)
COVID Vaccine doses administered (Sep 19, 2023)
Likely homosexual households (%)
Likely homosexual households (% change since 2000)
Likely homosexual households - Lesbian couples (%)
Likely homosexual households - Lesbian couples (% change since 2000)
Likely homosexual households - Gay men (%)
Likely homosexual households - Gay men (% change since 2000)
Cost of living index
Median gross rent ($)
Median contract rent ($)
Median monthly housing costs ($)
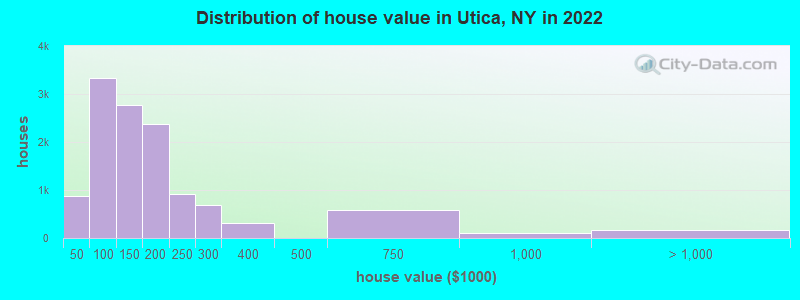
Median house or condo value ($)
Median house or condo value ($ change since 2000)
Mean house or condo value by units in structure - 1, detached ($)
Mean house or condo value by units in structure - 1, attached ($)
Mean house or condo value by units in structure - 2 ($)
Mean house or condo value by units in structure by units in structure - 3 or 4 ($)
Mean house or condo value by units in structure - 5 or more ($)
Mean house or condo value by units in structure - Boat, RV, van, etc. ($)
Mean house or condo value by units in structure - Mobile home ($)
Median house or condo value ($) - White
Median house or condo value ($) - Black or African American
Median house or condo value ($) - Asian
Median house or condo value ($) - Hispanic or Latino
Median house or condo value ($) - American Indian and Alaska Native
Median house or condo value ($) - Multirace
Median house or condo value ($) - Other Race
Median resident age
Resident age diversity
Median resident age - Males
Median resident age - Females
Median resident age - White
Median resident age - Black or African American
Median resident age - Asian
Median resident age - Hispanic or Latino
Median resident age - American Indian and Alaska Native
Median resident age - Multirace
Median resident age - Other Race
Median resident age - Males - White
Median resident age - Males - Black or African American
Median resident age - Males - Asian
Median resident age - Males - Hispanic or Latino
Median resident age - Males - American Indian and Alaska Native
Median resident age - Males - Multirace
Median resident age - Males - Other Race
Median resident age - Females - White
Median resident age - Females - Black or African American
Median resident age - Females - Asian
Median resident age - Females - Hispanic or Latino
Median resident age - Females - American Indian and Alaska Native
Median resident age - Females - Multirace
Median resident age - Females - Other Race
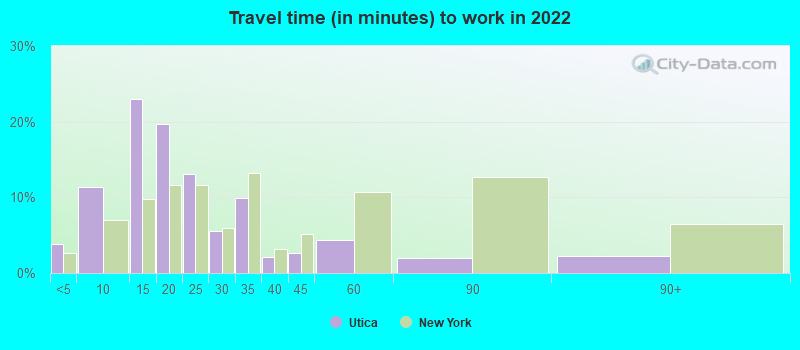
Commute - mean travel time to work (minutes)
Travel time to work - Less than 5 minutes (%)
Travel time to work - Less than 5 minutes (% change since 2000)
Travel time to work - 5 to 9 minutes (%)
Travel time to work - 5 to 9 minutes (% change since 2000)
Travel time to work - 10 to 19 minutes (%)
Travel time to work - 10 to 19 minutes (% change since 2000)
Travel time to work - 20 to 29 minutes (%)
Travel time to work - 20 to 29 minutes (% change since 2000)
Travel time to work - 30 to 39 minutes (%)
Travel time to work - 30 to 39 minutes (% change since 2000)
Travel time to work - 40 to 59 minutes (%)
Travel time to work - 40 to 59 minutes (% change since 2000)
Travel time to work - 60 to 89 minutes (%)
Travel time to work - 60 to 89 minutes (% change since 2000)
Travel time to work - 90 or more minutes (%)
Travel time to work - 90 or more minutes (% change since 2000)
Marital status - Never married (%)
Marital status - Now married (%)
Marital status - Separated (%)
Marital status - Widowed (%)
Marital status - Divorced (%)
Median family income ($)
Median family income (% change since 2000)
Median non-family income ($)
Median non-family income (% change since 2000)
Median per capita income ($)
Median per capita income (% change since 2000)
Median family income ($) - White
Median family income ($) - Black or African American
Median family income ($) - Asian
Median family income ($) - Hispanic or Latino
Median family income ($) - American Indian and Alaska Native
Median family income ($) - Multirace
Median family income ($) - Other Race
Median year house/condo built
Median year apartment built
Year house built - Built 2005 or later (%)
Year house built - Built 2000 to 2004 (%)
Year house built - Built 1990 to 1999 (%)
Year house built - Built 1980 to 1989 (%)
Year house built - Built 1970 to 1979 (%)
Year house built - Built 1960 to 1969 (%)
Year house built - Built 1950 to 1959 (%)
Year house built - Built 1940 to 1949 (%)
Year house built - Built 1939 or earlier (%)
Average household size
Household density (households per square mile)
Average household size - White
Average household size - Black or African American
Average household size - Asian
Average household size - Hispanic or Latino
Average household size - American Indian and Alaska Native
Average household size - Multirace
Average household size - Other Race
Occupied housing units (%)
Vacant housing units (%)
Owner occupied housing units (%)
Renter occupied housing units (%)
Vacancy status - For rent (%)
Vacancy status - For sale only (%)
Vacancy status - Rented or sold, not occupied (%)
Vacancy status - For seasonal, recreational, or occasional use (%)
Vacancy status - For migrant workers (%)
Vacancy status - Other vacant (%)
Residents with income below the poverty level (%)
Residents with income below 50% of the poverty level (%)
Children below poverty level (%)
Poor families by family type - Married-couple family (%)
Poor families by family type - Male, no wife present (%)
Poor families by family type - Female, no husband present (%)
Poverty status for native-born residents (%)
Poverty status for foreign-born residents (%)
Poverty among high school graduates not in families (%)
Poverty among people who did not graduate high school not in families (%)
Residents with income below the poverty level (%) - White
Residents with income below the poverty level (%) - Black or African American
Residents with income below the poverty level (%) - Asian
Residents with income below the poverty level (%) - Hispanic or Latino
Residents with income below the poverty level (%) - American Indian and Alaska Native
Residents with income below the poverty level (%) - Multirace
Residents with income below the poverty level (%) - Other Race
Air pollution - Air Quality Index (AQI)
Air pollution - CO
Air pollution - NO2
Air pollution - SO2
Air pollution - Ozone
Air pollution - PM10
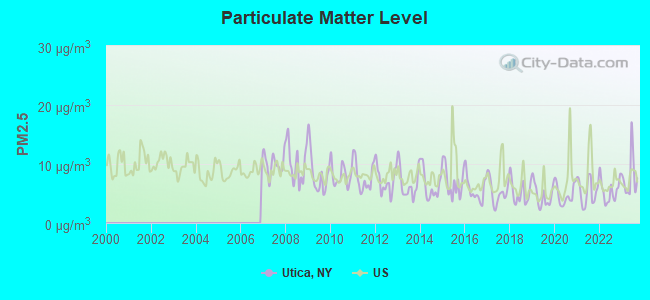
Air pollution - PM25
Air pollution - Pb
Crime - Murders per 100,000 population
Crime - Rapes per 100,000 population
Crime - Robberies per 100,000 population
Crime - Assaults per 100,000 population
Crime - Burglaries per 100,000 population
Crime - Thefts per 100,000 population
Crime - Auto thefts per 100,000 population
Crime - Arson per 100,000 population
Crime - City-data.com crime index
Crime - Violent crime index
Crime - Property crime index
Crime - Murders per 100,000 population (5 year average)
Crime - Rapes per 100,000 population (5 year average)
Crime - Robberies per 100,000 population (5 year average)
Crime - Assaults per 100,000 population (5 year average)
Crime - Burglaries per 100,000 population (5 year average)
Crime - Thefts per 100,000 population (5 year average)
Crime - Auto thefts per 100,000 population (5 year average)
Crime - Arson per 100,000 population (5 year average)
Crime - City-data.com crime index (5 year average)
Crime - Violent crime index (5 year average)
Crime - Property crime index (5 year average)
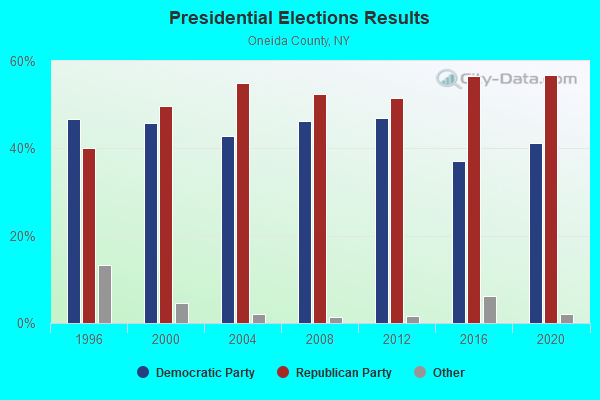
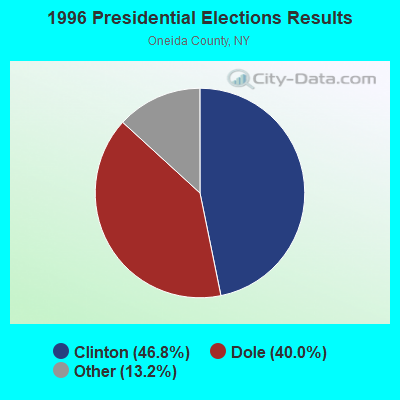
1996 Presidential Elections Results (%) - Democratic Party (Clinton)
1996 Presidential Elections Results (%) - Republican Party (Dole)
1996 Presidential Elections Results (%) - Other
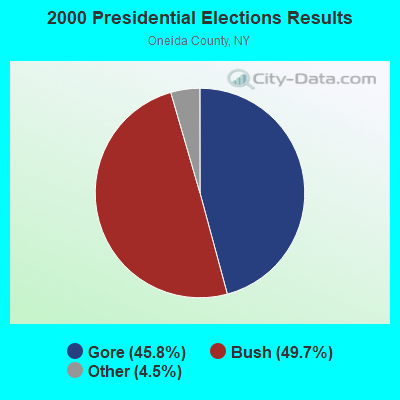
2000 Presidential Elections Results (%) - Democratic Party (Gore)
2000 Presidential Elections Results (%) - Republican Party (Bush)
2000 Presidential Elections Results (%) - Other
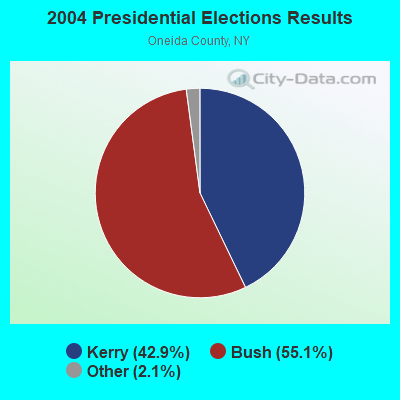
2004 Presidential Elections Results (%) - Democratic Party (Kerry)
2004 Presidential Elections Results (%) - Republican Party (Bush)
2004 Presidential Elections Results (%) - Other
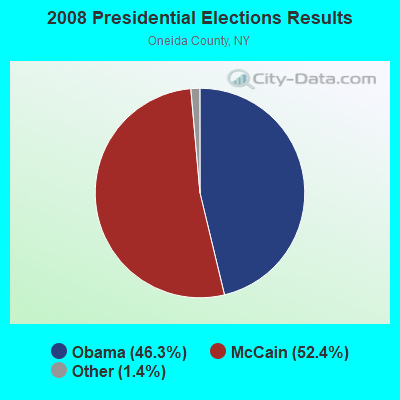
2008 Presidential Elections Results (%) - Democratic Party (Obama)
2008 Presidential Elections Results (%) - Republican Party (McCain)
2008 Presidential Elections Results (%) - Other
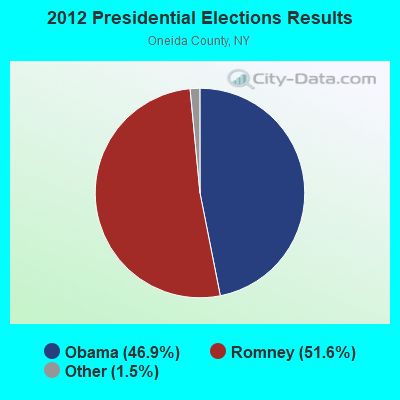
2012 Presidential Elections Results (%) - Democratic Party (Obama)
2012 Presidential Elections Results (%) - Republican Party (Romney)
2012 Presidential Elections Results (%) - Other
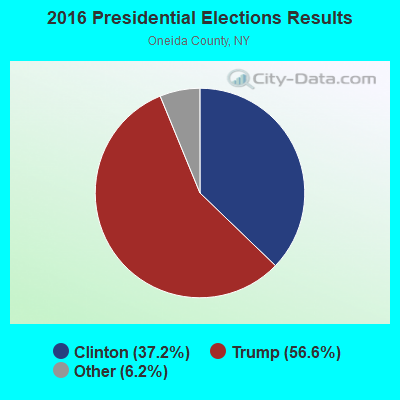
2016 Presidential Elections Results (%) - Democratic Party (Clinton)
2016 Presidential Elections Results (%) - Republican Party (Trump)
2016 Presidential Elections Results (%) - Other
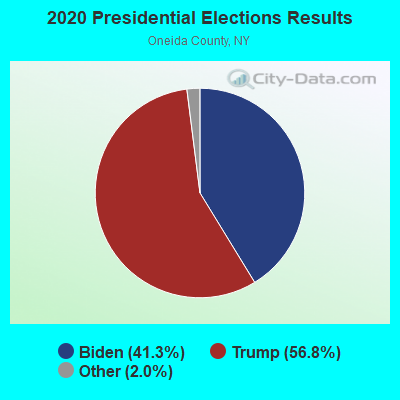
2020 Presidential Elections Results (%) - Democratic Party (Biden)
2020 Presidential Elections Results (%) - Republican Party (Trump)
2020 Presidential Elections Results (%) - Other
Ancestries Reported - Arab (%)
Ancestries Reported - Czech (%)
Ancestries Reported - Danish (%)
Ancestries Reported - Dutch (%)
Ancestries Reported - English (%)
Ancestries Reported - French (%)
Ancestries Reported - French Canadian (%)
Ancestries Reported - German (%)
Ancestries Reported - Greek (%)
Ancestries Reported - Hungarian (%)
Ancestries Reported - Irish (%)
Ancestries Reported - Italian (%)
Ancestries Reported - Lithuanian (%)
Ancestries Reported - Norwegian (%)
Ancestries Reported - Polish (%)
Ancestries Reported - Portuguese (%)
Ancestries Reported - Russian (%)
Ancestries Reported - Scotch-Irish (%)
Ancestries Reported - Scottish (%)
Ancestries Reported - Slovak (%)
Ancestries Reported - Subsaharan African (%)
Ancestries Reported - Swedish (%)
Ancestries Reported - Swiss (%)
Ancestries Reported - Ukrainian (%)
Ancestries Reported - United States (%)
Ancestries Reported - Welsh (%)
Ancestries Reported - West Indian (%)
Ancestries Reported - Other (%)
Educational Attainment - No schooling completed (%)
Educational Attainment - Less than high school (%)
Educational Attainment - High school or equivalent (%)
Educational Attainment - Less than 1 year of college (%)
Educational Attainment - 1 or more years of college (%)
Educational Attainment - Associate degree (%)
Educational Attainment - Bachelor's degree (%)
Educational Attainment - Master's degree (%)
Educational Attainment - Professional school degree (%)
Educational Attainment - Doctorate degree (%)
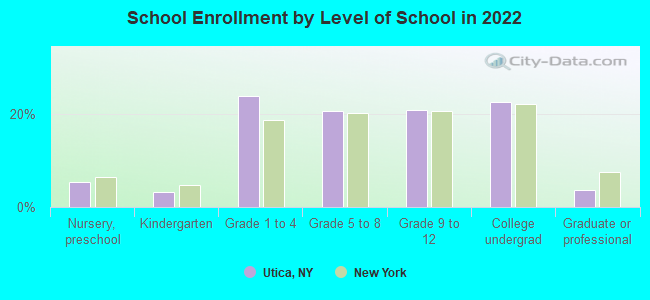
School Enrollment - Nursery, preschool (%)
School Enrollment - Kindergarten (%)
School Enrollment - Grade 1 to 4 (%)
School Enrollment - Grade 5 to 8 (%)
School Enrollment - Grade 9 to 12 (%)
School Enrollment - College undergrad (%)
School Enrollment - Graduate or professional (%)
School Enrollment - Not enrolled in school (%)
School enrollment - Public schools (%)
School enrollment - Private schools (%)
School enrollment - Not enrolled (%)
Median number of rooms in houses and condos
Median number of rooms in apartments
Housing units lacking complete plumbing facilities (%)
Housing units lacking complete kitchen facilities (%)
Density of houses
Urban houses (%)
Rural houses (%)
Households with people 60 years and over (%)
Households with people 65 years and over (%)
Households with people 75 years and over (%)
Households with one or more nonrelatives (%)
Households with no nonrelatives (%)
Population in households (%)
Family households (%)
Nonfamily households (%)
Population in families (%)
Family households with own children (%)
Median number of bedrooms in owner occupied houses
Mean number of bedrooms in owner occupied houses
Median number of bedrooms in renter occupied houses
Mean number of bedrooms in renter occupied houses
Median number of vehichles in owner occupied houses
Mean number of vehichles in owner occupied houses
Median number of vehichles in renter occupied houses
Mean number of vehichles in renter occupied houses
Mortgage status - with mortgage (%)
Mortgage status - with second mortgage (%)
Mortgage status - with home equity loan (%)
Mortgage status - with both second mortgage and home equity loan (%)
Mortgage status - without a mortgage (%)
Average family size
Average family size - White
Average family size - Black or African American
Average family size - Asian
Average family size - Hispanic or Latino
Average family size - American Indian and Alaska Native
Average family size - Multirace
Average family size - Other Race
Geographical mobility - Same house 1 year ago (%)
Geographical mobility - Moved within same county (%)
Geographical mobility - Moved from different county within same state (%)
Geographical mobility - Moved from different state (%)
Geographical mobility - Moved from abroad (%)
Place of birth - Born in state of residence (%)
Place of birth - Born in other state (%)
Place of birth - Native, outside of US (%)
Place of birth - Foreign born (%)
Housing units in structures - 1, detached (%)
Housing units in structures - 1, attached (%)
Housing units in structures - 2 (%)
Housing units in structures - 3 or 4 (%)
Housing units in structures - 5 to 9 (%)
Housing units in structures - 10 to 19 (%)
Housing units in structures - 20 to 49 (%)
Housing units in structures - 50 or more (%)
Housing units in structures - Mobile home (%)
Housing units in structures - Boat, RV, van, etc. (%)
House/condo owner moved in on average (years ago)
Renter moved in on average (years ago)
Year householder moved into unit - Moved in 1999 to March 2000 (%)
Year householder moved into unit - Moved in 1995 to 1998 (%)
Year householder moved into unit - Moved in 1990 to 1994 (%)
Year householder moved into unit - Moved in 1980 to 1989 (%)
Year householder moved into unit - Moved in 1970 to 1979 (%)
Year householder moved into unit - Moved in 1969 or earlier (%)
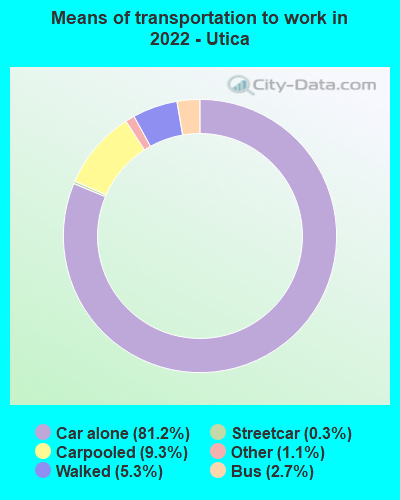
Means of transportation to work - Drove car alone (%)
Means of transportation to work - Carpooled (%)
Means of transportation to work - Public transportation (%)
Means of transportation to work - Bus or trolley bus (%)
Means of transportation to work - Streetcar or trolley car (%)
Means of transportation to work - Subway or elevated (%)
Means of transportation to work - Railroad (%)
Means of transportation to work - Ferryboat (%)
Means of transportation to work - Taxicab (%)
Means of transportation to work - Motorcycle (%)
Means of transportation to work - Bicycle (%)
Means of transportation to work - Walked (%)
Means of transportation to work - Other means (%)
Working at home (%)
Industry diversity
Most Common Industries - Agriculture, forestry, fishing and hunting, and mining (%)
Most Common Industries - Agriculture, forestry, fishing and hunting (%)
Most Common Industries - Mining, quarrying, and oil and gas extraction (%)
Most Common Industries - Construction (%)
Most Common Industries - Manufacturing (%)
Most Common Industries - Wholesale trade (%)
Most Common Industries - Retail trade (%)
Most Common Industries - Transportation and warehousing, and utilities (%)
Most Common Industries - Transportation and warehousing (%)
Most Common Industries - Utilities (%)
Most Common Industries - Information (%)
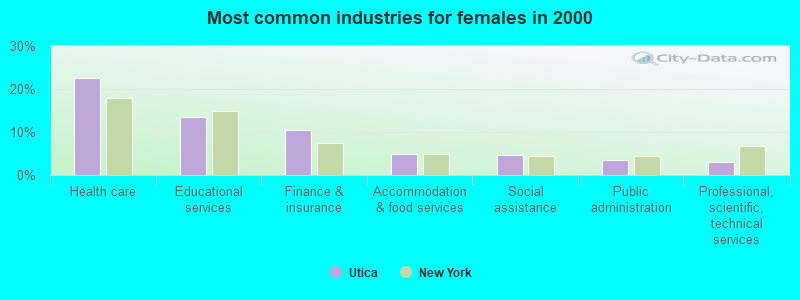
Most Common Industries - Finance and insurance, and real estate and rental and leasing (%)
Most Common Industries - Finance and insurance (%)
Most Common Industries - Real estate and rental and leasing (%)
Most Common Industries - Professional, scientific, and management, and administrative and waste management services (%)
Most Common Industries - Professional, scientific, and technical services (%)
Most Common Industries - Management of companies and enterprises (%)
Most Common Industries - Administrative and support and waste management services (%)
Most Common Industries - Educational services, and health care and social assistance (%)
Most Common Industries - Educational services (%)
Most Common Industries - Health care and social assistance (%)
Most Common Industries - Arts, entertainment, and recreation, and accommodation and food services (%)
Most Common Industries - Arts, entertainment, and recreation (%)
Most Common Industries - Accommodation and food services (%)
Most Common Industries - Other services, except public administration (%)
Most Common Industries - Public administration (%)
Occupation diversity
Most Common Occupations - Management, business, science, and arts occupations (%)
Most Common Occupations - Management, business, and financial occupations (%)
Most Common Occupations - Management occupations (%)
Most Common Occupations - Business and financial operations occupations (%)
Most Common Occupations - Computer, engineering, and science occupations (%)
Most Common Occupations - Computer and mathematical occupations (%)
Most Common Occupations - Architecture and engineering occupations (%)
Most Common Occupations - Life, physical, and social science occupations (%)
Most Common Occupations - Education, legal, community service, arts, and media occupations (%)
Most Common Occupations - Community and social service occupations (%)
Most Common Occupations - Legal occupations (%)
Most Common Occupations - Education, training, and library occupations (%)
Most Common Occupations - Arts, design, entertainment, sports, and media occupations (%)
Most Common Occupations - Healthcare practitioners and technical occupations (%)
Most Common Occupations - Health diagnosing and treating practitioners and other technical occupations (%)
Most Common Occupations - Health technologists and technicians (%)
Most Common Occupations - Service occupations (%)
Most Common Occupations - Healthcare support occupations (%)
Most Common Occupations - Protective service occupations (%)
Most Common Occupations - Fire fighting and prevention, and other protective service workers including supervisors (%)
Most Common Occupations - Law enforcement workers including supervisors (%)
Most Common Occupations - Food preparation and serving related occupations (%)
Most Common Occupations - Building and grounds cleaning and maintenance occupations (%)
Most Common Occupations - Personal care and service occupations (%)
Most Common Occupations - Sales and office occupations (%)
Most Common Occupations - Sales and related occupations (%)
Most Common Occupations - Office and administrative support occupations (%)
Most Common Occupations - Natural resources, construction, and maintenance occupations (%)
Most Common Occupations - Farming, fishing, and forestry occupations (%)
Most Common Occupations - Construction and extraction occupations (%)
Most Common Occupations - Installation, maintenance, and repair occupations (%)
Most Common Occupations - Production, transportation, and material moving occupations (%)
Most Common Occupations - Production occupations (%)
Most Common Occupations - Transportation occupations (%)
Most Common Occupations - Material moving occupations (%)
People in Group quarters - Institutionalized population (%)
People in Group quarters - Correctional institutions (%)
People in Group quarters - Federal prisons and detention centers (%)
People in Group quarters - Halfway houses (%)
People in Group quarters - Local jails and other confinement facilities (including police lockups) (%)
People in Group quarters - Military disciplinary barracks (%)
People in Group quarters - State prisons (%)
People in Group quarters - Other types of correctional institutions (%)
People in Group quarters - Nursing homes (%)
People in Group quarters - Hospitals/wards, hospices, and schools for the handicapped (%)
People in Group quarters - Hospitals/wards and hospices for chronically ill (%)
People in Group quarters - Hospices or homes for chronically ill (%)
People in Group quarters - Military hospitals or wards for chronically ill (%)
People in Group quarters - Other hospitals or wards for chronically ill (%)
People in Group quarters - Hospitals or wards for drug/alcohol abuse (%)
People in Group quarters - Mental (Psychiatric) hospitals or wards (%)
People in Group quarters - Schools, hospitals, or wards for the mentally retarded (%)
People in Group quarters - Schools, hospitals, or wards for the physically handicapped (%)
People in Group quarters - Institutions for the deaf (%)
People in Group quarters - Institutions for the blind (%)
People in Group quarters - Orthopedic wards and institutions for the physically handicapped (%)
People in Group quarters - Wards in general hospitals for patients who have no usual home elsewhere (%)
People in Group quarters - Wards in military hospitals for patients who have no usual home elsewhere (%)
People in Group quarters - Juvenile institutions (%)
People in Group quarters - Long-term care (%)
People in Group quarters - Homes for abused, dependent, and neglected children (%)
People in Group quarters - Residential treatment centers for emotionally disturbed children (%)
People in Group quarters - Training schools for juvenile delinquents (%)
People in Group quarters - Short-term care, detention or diagnostic centers for delinquent children (%)
People in Group quarters - Type of juvenile institution unknown (%)
People in Group quarters - Noninstitutionalized population (%)
People in Group quarters - College dormitories (includes college quarters off campus) (%)
People in Group quarters - Military quarters (%)
People in Group quarters - On base (%)
People in Group quarters - Barracks, unaccompanied personnel housing (UPH), (Enlisted/Officer), ;and similar group living quarters for military personnel (%)
People in Group quarters - Transient quarters for temporary residents (%)
People in Group quarters - Military ships (%)
People in Group quarters - Group homes (%)
People in Group quarters - Homes or halfway houses for drug/alcohol abuse (%)
People in Group quarters - Homes for the mentally ill (%)
People in Group quarters - Homes for the mentally retarded (%)
People in Group quarters - Homes for the physically handicapped (%)
People in Group quarters - Other group homes (%)
People in Group quarters - Religious group quarters (%)
People in Group quarters - Dormitories (%)
People in Group quarters - Agriculture workers' dormitories on farms (%)
People in Group quarters - Job Corps and vocational training facilities (%)
People in Group quarters - Other workers' dormitories (%)
People in Group quarters - Crews of maritime vessels (%)
People in Group quarters - Other nonhousehold living situations (%)
People in Group quarters - Other noninstitutional group quarters (%)
Residents speaking English at home (%)
Residents speaking English at home - Born in the United States (%)
Residents speaking English at home - Native, born elsewhere (%)
Residents speaking English at home - Foreign born (%)
Residents speaking Spanish at home (%)
Residents speaking Spanish at home - Born in the United States (%)
Residents speaking Spanish at home - Native, born elsewhere (%)
Residents speaking Spanish at home - Foreign born (%)
Residents speaking other language at home (%)
Residents speaking other language at home - Born in the United States (%)
Residents speaking other language at home - Native, born elsewhere (%)
Residents speaking other language at home - Foreign born (%)
Class of Workers - Employee of private company (%)
Class of Workers - Self-employed in own incorporated business (%)
Class of Workers - Private not-for-profit wage and salary workers (%)
Class of Workers - Local government workers (%)
Class of Workers - State government workers (%)
Class of Workers - Federal government workers (%)
Class of Workers - Self-employed workers in own not incorporated business and Unpaid family workers (%)
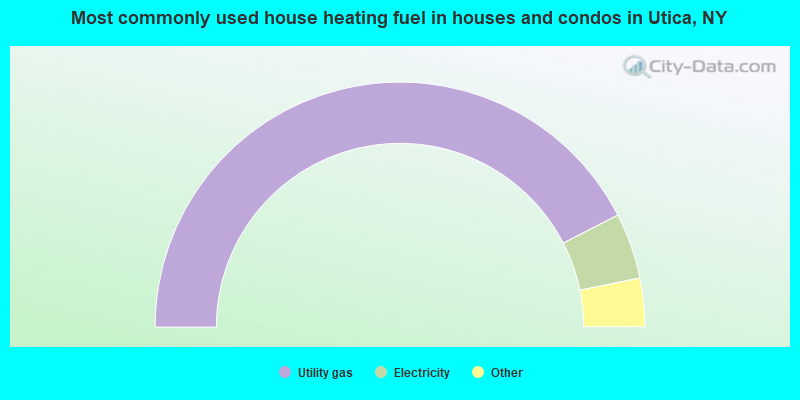
House heating fuel used in houses and condos - Utility gas (%)
House heating fuel used in houses and condos - Bottled, tank, or LP gas (%)
House heating fuel used in houses and condos - Electricity (%)
House heating fuel used in houses and condos - Fuel oil, kerosene, etc. (%)
House heating fuel used in houses and condos - Coal or coke (%)
House heating fuel used in houses and condos - Wood (%)
House heating fuel used in houses and condos - Solar energy (%)
House heating fuel used in houses and condos - Other fuel (%)
House heating fuel used in houses and condos - No fuel used (%)
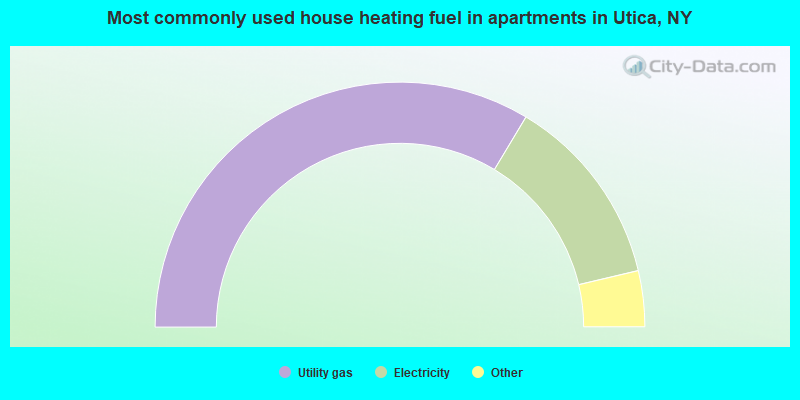
House heating fuel used in apartments - Utility gas (%)
House heating fuel used in apartments - Bottled, tank, or LP gas (%)
House heating fuel used in apartments - Electricity (%)
House heating fuel used in apartments - Fuel oil, kerosene, etc. (%)
House heating fuel used in apartments - Coal or coke (%)
House heating fuel used in apartments - Wood (%)
House heating fuel used in apartments - Solar energy (%)
House heating fuel used in apartments - Other fuel (%)
House heating fuel used in apartments - No fuel used (%)
Armed forces status - In Armed Forces (%)
Armed forces status - Civilian (%)
Armed forces status - Civilian - Veteran (%)
Armed forces status - Civilian - Nonveteran (%)
Read more: https://www.city-data.com/accidents/acc-Addison-Illinois.html
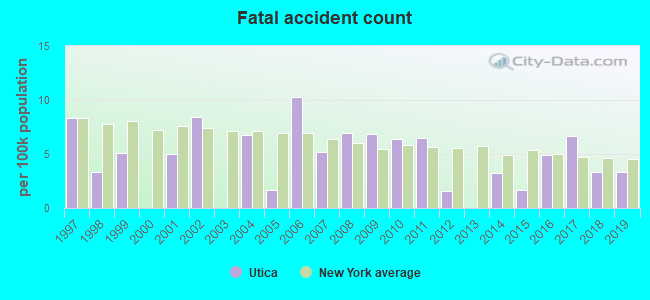
Fatal accidents locations in years 2005-2022
Fatal accidents locations in 2022
Fatal accidents locations in 2021
Fatal accidents locations in 2020
Fatal accidents locations in 2019
Fatal accidents locations in 2018
Fatal accidents locations in 2017
Fatal accidents locations in 2016
Fatal accidents locations in 2015
Fatal accidents locations in 2014
Fatal accidents locations in 2013
Fatal accidents locations in 2012
Fatal accidents locations in 2011
Fatal accidents locations in 2010
Fatal accidents locations in 2009
Fatal accidents locations in 2008
Fatal accidents locations in 2007
Fatal accidents locations in 2006
Fatal accidents locations in 2005
Alcohol use - People drinking some alcohol every month (%)
Alcohol use - People not drinking at all (%)
Alcohol use - Average days/month drinking alcohol
Alcohol use - Average drinks/week
Alcohol use - Average days/year people drink much
Audiometry - Average condition of hearing (%)
Audiometry - People that can hear a whisper from across a quiet room (%)
Audiometry - People that can hear normal voice from across a quiet room (%)
Audiometry - Ears ringing, roaring, buzzing (%)
Audiometry - Had a job exposure to loud noise (%)
Audiometry - Had off-work exposure to loud noise (%)
Blood Pressure & Cholesterol - Has high blood pressure (%)
Blood Pressure & Cholesterol - Checking blood pressure at home (%)
Blood Pressure & Cholesterol - Frequently checking blood cholesterol (%)
Blood Pressure & Cholesterol - Has high cholesterol level (%)
Consumer Behavior - Money monthly spent on food at supermarket/grocery store
Consumer Behavior - Money monthly spent on food at other stores
Consumer Behavior - Money monthly spent on eating out
Consumer Behavior - Money monthly spent on carryout/delivered foods
Consumer Behavior - Income spent on food at supermarket/grocery store (%)
Consumer Behavior - Income spent on food at other stores (%)
Consumer Behavior - Income spent on eating out (%)
Consumer Behavior - Income spent on carryout/delivered foods (%)
Current Health Status - General health condition (%)
Current Health Status - Blood donors (%)
Current Health Status - Has blood ever tested for HIV virus (%)
Current Health Status - Left-handed people (%)
Dermatology - People using sunscreen (%)
Diabetes - Diabetics (%)
Diabetes - Had a blood test for high blood sugar (%)
Diabetes - People taking insulin (%)
Diet Behavior & Nutrition - Diet health (%)
Diet Behavior & Nutrition - Milk product consumption (# of products/month)
Diet Behavior & Nutrition - Meals not home prepared (#/week)
Diet Behavior & Nutrition - Meals from fast food or pizza place (#/week)
Diet Behavior & Nutrition - Ready-to-eat foods (#/month)
Diet Behavior & Nutrition - Frozen meals/pizza (#/month)
Drug Use - People that ever used marijuana or hashish (%)
Drug Use - Ever used hard drugs (%)
Drug Use - Ever used any form of cocaine (%)
Drug Use - Ever used heroin (%)
Drug Use - Ever used methamphetamine (%)
Health Insurance - People covered by health insurance (%)
Kidney Conditions-Urology - Avg. # of times urinating at night
Medical Conditions - People with asthma (%)
Medical Conditions - People with anemia (%)
Medical Conditions - People with psoriasis (%)
Medical Conditions - People with overweight (%)
Medical Conditions - Elderly people having difficulties in thinking or remembering (%)
Medical Conditions - People who ever received blood transfusion (%)
Medical Conditions - People having trouble seeing even with glass/contacts (%)
Medical Conditions - People with arthritis (%)
Medical Conditions - People with gout (%)
Medical Conditions - People with congestive heart failure (%)
Medical Conditions - People with coronary heart disease (%)
Medical Conditions - People with angina pectoris (%)
Medical Conditions - People who ever had heart attack (%)
Medical Conditions - People who ever had stroke (%)
Medical Conditions - People with emphysema (%)
Medical Conditions - People with thyroid problem (%)
Medical Conditions - People with chronic bronchitis (%)
Medical Conditions - People with any liver condition (%)
Medical Conditions - People who ever had cancer or malignancy (%)
Mental Health - People who have little interest in doing things (%)
Mental Health - People feeling down, depressed, or hopeless (%)
Mental Health - People who have trouble sleeping or sleeping too much (%)
Mental Health - People feeling tired or having little energy (%)
Mental Health - People with poor appetite or overeating (%)
Mental Health - People feeling bad about themself (%)
Mental Health - People who have trouble concentrating on things (%)
Mental Health - People moving or speaking slowly or too fast (%)
Mental Health - People having thoughts they would be better off dead (%)
Oral Health - Average years since last visit a dentist
Oral Health - People embarrassed because of mouth (%)
Oral Health - People with gum disease (%)
Oral Health - General health of teeth and gums (%)
Oral Health - Average days a week using dental floss/device
Oral Health - Average days a week using mouthwash for dental problem
Oral Health - Average number of teeth
Pesticide Use - Households using pesticides to control insects (%)
Pesticide Use - Households using pesticides to kill weeds (%)
Physical Activity - People doing vigorous-intensity work activities (%)
Physical Activity - People doing moderate-intensity work activities (%)
Physical Activity - People walking or bicycling (%)
Physical Activity - People doing vigorous-intensity recreational activities (%)
Physical Activity - People doing moderate-intensity recreational activities (%)
Physical Activity - Average hours a day doing sedentary activities
Physical Activity - Average hours a day watching TV or videos
Physical Activity - Average hours a day using computer
Physical Functioning - People having limitations keeping them from working (%)
Physical Functioning - People limited in amount of work they can do (%)
Physical Functioning - People that need special equipment to walk (%)
Physical Functioning - People experiencing confusion/memory problems (%)
Physical Functioning - People requiring special healthcare equipment (%)
Prescription Medications - Average number of prescription medicines taking
Preventive Aspirin Use - Adults 40+ taking low-dose aspirin (%)
Reproductive Health - Vaginal deliveries (%)
Reproductive Health - Cesarean deliveries (%)
Reproductive Health - Deliveries resulted in a live birth (%)
Reproductive Health - Pregnancies resulted in a delivery (%)
Reproductive Health - Women breastfeeding newborns (%)
Reproductive Health - Women that had a hysterectomy (%)
Reproductive Health - Women that had both ovaries removed (%)
Reproductive Health - Women that have ever taken birth control pills (%)
Reproductive Health - Women taking birth control pills (%)
Reproductive Health - Women that have ever used Depo-Provera or injectables (%)
Reproductive Health - Women that have ever used female hormones (%)
Sexual Behavior - People 18+ that ever had sex (vaginal, anal, or oral) (%)
Sexual Behavior - Males 18+ that ever had vaginal sex with a woman (%)
Sexual Behavior - Males 18+ that ever performed oral sex on a woman (%)
Sexual Behavior - Males 18+ that ever had anal sex with a woman (%)
Sexual Behavior - Males 18+ that ever had any sex with a man (%)
Sexual Behavior - Females 18+ that ever had vaginal sex with a man (%)
Sexual Behavior - Females 18+ that ever performed oral sex on a man (%)
Sexual Behavior - Females 18+ that ever had anal sex with a man (%)
Sexual Behavior - Females 18+ that ever had any kind of sex with a woman (%)
Sexual Behavior - Average age people first had sex
Sexual Behavior - Average number of female sex partners in lifetime (males 18+)
Sexual Behavior - Average number of female vaginal sex partners in lifetime (males 18+)
Sexual Behavior - Average age people first performed oral sex on a woman (18+)
Sexual Behavior - Average number of woman performed oral sex on in lifetime (18+)
Sexual Behavior - Average number of male sex partners in lifetime (males 18+)
Sexual Behavior - Average number of male anal sex partners in lifetime (males 18+)
Sexual Behavior - Average age people first performed oral sex on a man (18+)
Sexual Behavior - Average number of male oral sex partners in lifetime (18+)
Sexual Behavior - People using protection when performing oral sex (%)
Sexual Behavior - Average number of times people have vaginal or anal sex a year
Sexual Behavior - People having sex without condom (%)
Sexual Behavior - Average number of male sex partners in lifetime (females 18+)
Sexual Behavior - Average number of male vaginal sex partners in lifetime (females 18+)
Sexual Behavior - Average number of female sex partners in lifetime (females 18+)
Sexual Behavior - Circumcised males 18+ (%)
Sleep Disorders - Average hours sleeping at night
Sleep Disorders - People that has trouble sleeping (%)
Smoking-Cigarette Use - People smoking cigarettes (%)
Taste & Smell - People 40+ having problems with smell (%)
Taste & Smell - People 40+ having problems with taste (%)
Taste & Smell - People 40+ that ever had wisdom teeth removed (%)
Taste & Smell - People 40+ that ever had tonsils teeth removed (%)
Taste & Smell - People 40+ that ever had a loss of consciousness because of a head injury (%)
Taste & Smell - People 40+ that ever had a broken nose or other serious injury to face or skull (%)
Taste & Smell - People 40+ that ever had two or more sinus infections (%)
Weight - Average height (inches)
Weight - Average weight (pounds)
Weight - Average BMI
Weight - People that are obese (%)
Weight - People that ever were obese (%)
Weight - People trying to lose weight (%)
The City-Data.com crime index weighs serious crimes and violent crimes more heavily. Higher means more crime, U.S. average is 246.1. It adjusts for the number of visitors and daily workers commuting into cities.
- means the value is smaller than the state average.
- means the value is bigger than the state average.
- means the value is much bigger than the state average.
Crime rate in Utica detailed stats: murders, rapes, robberies, assaults, burglaries, thefts, arson Officers per 1,000 residents here:
2.76New York average:
3.28
Latest news from Utica, NY collected exclusively by city-data.com from local newspapers, TV, and radio stations
Ancestries: Italian (12.8%), Yugoslavian (9.5%), American (8.0%), Irish (3.0%), Polish (2.8%), German (2.6%).
Current Local Time:
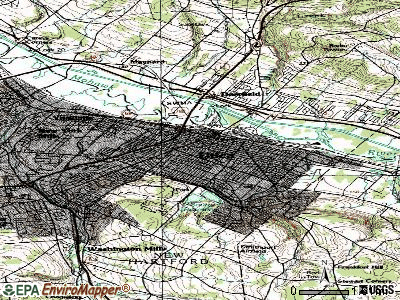
Land area: 16.3 square miles.
Population density: 3,920 people per square mile (average).
14,225 residents are foreign born (9.8% Asia , 7.1% Europe , 4.1% Latin America ).
This city:
22.2%New York:
22.6%
Median real estate property taxes paid for housing units with mortgages in 2022: $3,406 (2.3%)Median real estate property taxes paid for housing units with no mortgage in 2022: $2,638 (2.3%)
Nearest city with pop. 200,000+: Rochester, NY
Nearest city with pop. 1,000,000+: Bronx, NY
Nearest cities:
Latitude: 43.10 N, Longitude: 75.23 W
Daytime population change due to commuting: +5,959 (+9.3%)Workers who live and work in this city: 12,249 (50.0%)
Utica tourist attractions:
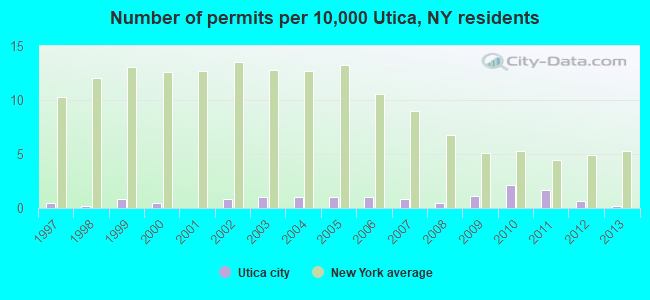
Single-family new house construction building permits:
2013: 1 building , cost: $65,0002012: 4 buildings , average cost: $124,5002011: 10 buildings , average cost: $175,0002010: 13 buildings , average cost: $173,0002009: 7 buildings , average cost: $165,8002008: 3 buildings , average cost: $62,4002007: 5 buildings , average cost: $62,4002006: 6 buildings , average cost: $62,4002005: 6 buildings , average cost: $62,4002004: 6 buildings , average cost: $62,4002003: 6 buildings , average cost: $62,4002002: 5 buildings , average cost: $62,4002000: 3 buildings , average cost: $61,7001999: 5 buildings , average cost: $202,4001998: 1 building , cost: $199,0001997: 3 buildings , average cost: $37,600Unemployment in December 2023:
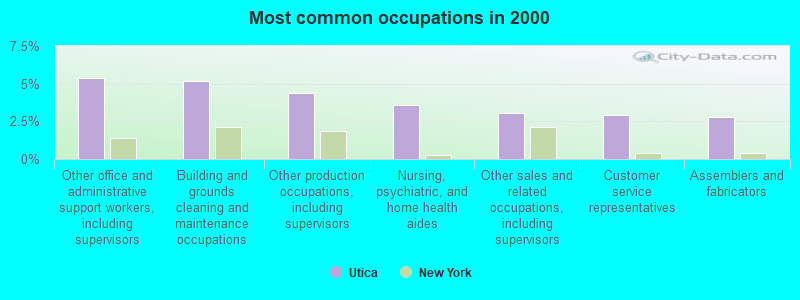
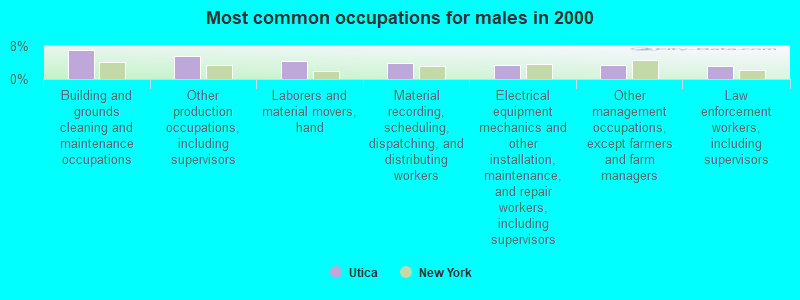
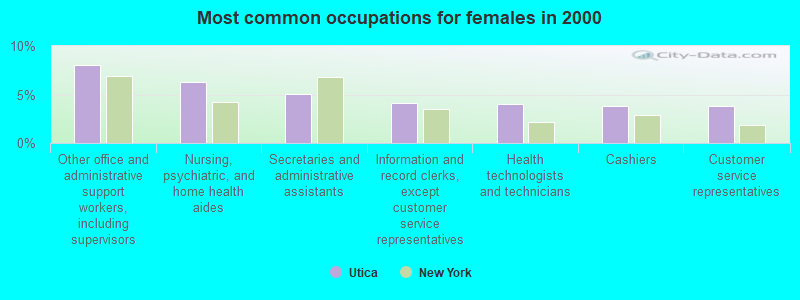
Most common occupations in Utica, NY (%)
Both Males Females
Other office and administrative support workers, including supervisors (5.3%)
Building and grounds cleaning and maintenance occupations (5.2%)
Other production occupations, including supervisors (4.4%)
Nursing, psychiatric, and home health aides (3.6%)
Other sales and related occupations, including supervisors (3.0%)
Customer service representatives (2.9%)
Assemblers and fabricators (2.8%)
Building and grounds cleaning and maintenance occupations (6.9%)
Other production occupations, including supervisors (5.6%)
Laborers and material movers, hand (4.3%)
Material recording, scheduling, dispatching, and distributing workers (3.8%)
Electrical equipment mechanics and other installation, maintenance, and repair workers, including supervisors (3.4%)
Other management occupations, except farmers and farm managers (3.4%)
Law enforcement workers, including supervisors (3.3%)
Other office and administrative support workers, including supervisors (8.0%)
Nursing, psychiatric, and home health aides (6.3%)
Secretaries and administrative assistants (5.0%)
Information and record clerks, except customer service representatives (4.1%)
Health technologists and technicians (4.0%)
Cashiers (3.9%)
Customer service representatives (3.8%)
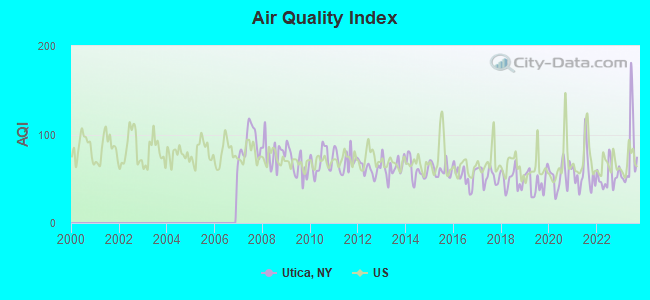
Air pollution and air quality trends(lower is better)
AQI PM2.5
Tornado activity:
Utica-area historical tornado activity is below New York state average. It is 74% smaller than the overall U.S. average.
On 7/10/1989, a category F4 (max. wind speeds 207-260 mph) tornado 40.0 miles away from the Utica city center injured 20 people and caused between $5,000,000 and $50,000,000 in damages.
On 5/2/1983, a category F3 (max. wind speeds 158-206 mph) tornado 26.7 miles away from the city center caused between $5,000,000 and $50,000,000 in damages.
Earthquake activity:
Utica-area historical earthquake activity is significantly above New York state average. It is 68% smaller than the overall U.S. average. On 10/7/1983 at 10:18:46, a magnitude 5.3 (5.1 MB, 5.3 LG, 5.1 ML, Class: Moderate, Intensity: VI - VII) earthquake occurred 74.2 miles away from Utica center On 4/20/2002 at 10:50:47, a magnitude 5.3 (5.3 ML, Depth: 3.0 mi) earthquake occurred 124.3 miles away from Utica center On 4/20/2002 at 10:50:47, a magnitude 5.2 (5.2 MB, 4.2 MS, 5.2 MW, 5.0 MW) earthquake occurred 122.3 miles away from Utica center On 6/17/1991 at 08:53:16, a magnitude 4.1 (4.0 MB, 4.0 LG, Depth: 3.1 mi, Class: Light, Intensity: IV - V) earthquake occurred 42.8 miles away from the city center On 8/23/2011 at 17:51:04, a magnitude 5.8 (5.8 MW, Depth: 3.7 mi) earthquake occurred 385.9 miles away from Utica center On 1/19/1982 at 00:14:42, a magnitude 4.7 (4.5 MB, 4.7 MD, 4.5 LG) earthquake occurred 184.9 miles away from the city center Magnitude types: regional Lg-wave magnitude (LG), body-wave magnitude (MB), duration magnitude (MD), local magnitude (ML), surface-wave magnitude (MS), moment magnitude (MW) Natural disasters: The number of natural disasters in Oneida County (23) is greater than the US average (15).Major Disasters (Presidential) Declared: 12Emergencies Declared: 9Storms: 9, Floods: 7, Tropical Storms: 3, Hurricanes: 2, Snows: 2, Snowstorms: 2, Winds: 2, Blizzard: 1, Ice Storm: 1, Power Outage: 1, Tornado: 1, Winter Storm: 1, Other: 2 (Note: some incidents may be assigned to more than one category). Main business address for: CONMED CORP ELECTROMEDICAL & ELECTROTHERAPEUTIC APPARATUS ).
Hospitals in Utica: CHILDREN'S HOSP REHAB CENTER (provides emergency services, 1675 BENNETT ST) FAXTON - CHILDRENS HOSPITAL (provides emergency services, 1676 SUNSET AVE) FAXTON-ST LUKE'S HEALTHCARE (Voluntary non-profit - Private, 1656 CHAMPLIN AVENUE) ST ELIZABETH MEDICAL CENTER (Voluntary non-profit - Private, 2209 GENESEE STREET) UCPA OF THE UTICA AREA (1237 TILDEN AVENUE) UCPA OF THE UTICA AREA (6340 TRENTON RD) UCPA OF THE UTICA AREA (320 NIAGARA ST) UTICA PYSCHIATRIC CENTER (1213 COURT ST) Nursing Homes in Utica: BROADACRES CLOSED (WALKER RD) FAXTON - ST LUKES HEALTHCARE ALLEN CALDER (1656 CHAMPLIN AVENUE) FOCUS REHABILITATION AND NURSING CENTER AT UTICA (1445 KEMBLE STREET) HERITAGE HEALTH CARE CENTER (1657 SUNSET AVE) MASONIC CARE COMMUNITY OF NEW YORK (2150 BLEECKER STREET) ST JOSEPH NURSING HOME (2535 GENESEE STREET) ST LUKES HOME (1650 CHAMPLIN AVENUE) THE PINES AT UTICA CENTER FOR NRSG AND REHAB (1800 BUTTERFIELD AVE) Dialysis Facilities in Utica: FAXTON ST. LUKE'S HEALTHCARE - MASONIC (2150 BLEEKER STREET) Home Health Centers in Utica: ACACIA CERTIFIED HOME CARE CO (2150 BLEECKER STREET) ST ELIZABETH CERTIFIED HOME CARE (14 FOERY DRIVE) ST REGIS HOME HEALTH CARE INC (233 ELIZABETH STREET) VNA UTICA AND ONEIDA CO CHHA (2608 GENESEE ST) Amtrak station: UTICA (321 MAIN ST.)
.
Services: ticket office, partially wheelchair accessible, enclosed waiting area, public restrooms, public payphones, snack bar, free short-term parking, call for car rental service, taxi stand, intercity bus service, public transit connection.
Colleges/Universities in Utica: Mohawk Valley Community College Full-time enrollment: 5,693; Location: 1101 Sherman Dr; Public; Website: www.mvcc.edu)
Utica College Full-time enrollment: 2,952; Location: 1600 Burrstone Rd; Private, not-for-profit; Website: www.utica.edu/; Offers Doctor's degree )
SUNY Institute of Technology at Utica-Rome Full-time enrollment: 1,829; Location: 100 Seymour Rd; Public; Website: www.sunyit.edu; Offers Master's degree )
Utica School of Commerce Full-time enrollment: 367; Location: 201 Bleecker St; Private, for-profit; Website: www.uscny.edu)
Saint Elizabeth College of Nursing Full-time enrollment: 137; Location: 2215 Genessee St; Private, not-for-profit; Website: www.secon.edu)
Saint Elizabeth Medical Center School of Radiography Full-time enrollment: 25; Location: 2209 Genesee Street; Private, not-for-profit; Website: www.stemc.org)
Faxton-St Luke's Healthcare School of Radiologic Technology Location: Champlin Rd; Private, not-for-profit; Website: www.mvnhealth.com)
Other colleges/universities with over 2000 students near Utica:
Herkimer County Community College (about 13 miles; Herkimer, NY ; Full-time enrollment: 2,774)
Morrisville State College (about 24 miles; Morrisville, NY ; FT enrollment: 2,823)
Colgate University (about 25 miles; Hamilton, NY ; FT enrollment: 3,094)
Le Moyne College (about 44 miles; Syracuse, NY ; FT enrollment: 3,041)
SUNY Oneonta (about 45 miles; Oneonta, NY ; FT enrollment: 6,081)
Syracuse University (about 46 miles; Syracuse, NY ; FT enrollment: 20,717)
SUNY College of Environmental Science and Forestry (about 47 miles; Syracuse, NY ; FT enrollment: 2,044)
Public high schools in Utica: THOMAS R PROCTOR HIGH SCHOOL Students: 2,670, Location: 1203 HILTON AVE, Grades: 9-12)MOHAWK VALLEY PSYCHIATRIC CENTER FOR CHILDREN & YO Location: 1400 NOYES ST, Grades: KG-12)
UTICA ACADEMY OF SCIENCE CHARTER SCHOOL Location: 1214 LINCOLN AVE, Grades: 6-10, Charter school )
Private high schools in Utica:
Biggest public elementary/middle schools in Utica: JOHN F KENNEDY MIDDLE SCHOOL Students: 1,109, Location: 500 DEERFIELD DR E, Grades: 7-8)SENATOR JAMES H DONOVAN MIDDLE SCHOOL Students: 1,005, Location: 1701 NOYES ST, Grades: 7-8)CHRISTOPHER COLUMBUS ELEMENTARY SCHOOL Students: 718, Location: 934 ARMORY DR, Grades: KG-6)GENERAL HERKIMER ELEMENTARY SCHOOL Students: 616, Location: 420 KEYES RD, Grades: KG-6)KERNAN ELEMENTARY SCHOOL Students: 596, Location: 929 YORK ST, Grades: KG-6)WATSON WILLIAMS ELEMENTARY SCHOOL Students: 544, Location: 107 ELMWOOD PL, Grades: KG-6)ALBANY ELEMENTARY SCHOOL Students: 510, Location: 1151 ALBANY ST, Grades: KG-6)HUGH R JONES ELEMENTARY SCHOOL Students: 475, Location: 2630 REMINGTON RD, Grades: KG-6)THOMAS JEFFERSON ELEMENTARY SCHOOL Students: 456, Location: 190 BOOTH ST, Grades: KG-6)JOHN F HUGHES ELEMENTARY SCHOOL Students: 418, Location: 24 PROSPECT ST, Grades: KG-6)Private elementary/middle schools in Utica:
See full list of schools located in Utica Library in Utica: UTICA PUBLIC LIBRARY Operating income: $1,520,718; Location: 303 GENESEE STREET; 164,894 books ; 13,581 audio materials ; 4,745 video materials ; 14 state licensed databases ; 10 other licensed databases ; 77 print serial subscriptions )
User-submitted facts and corrections:
Please add a link to The Children's Museum, 311 Main Street, Utica, NY 13501 www.museum4kids.net
New Fac, College: Pratt U at Munson Williams Proctor Institute (Art) State St.
Notable locations in Utica: (A) , Niagara-Mohawk Power Corporation Cornelia Street Sub-Station (B) , Lafayette Square (C) , Oneida Square (D) , Charles A Gaetano Stadium (E) , Girl Scout Camp (F) , Val Bialas Ski Area (G) , Valley View Golf (H) , Chancellor Square (I) , Victor A Perretta Twin Towers (J) , Rocco Deperno Benefit Center (K) , Strand Theatre (L) , Saint Pauls Day Care Center (M) , Utica Public Library (N) , Pulaski Hall (O) , Boys Club of Utica (P) , Utica City Court And Police Station (Q) , Utica Memorial Auditorium (R) , Uptown Theatre (S) , Utica City Hall (T) . Display/hide their locations on the map
Shopping Centers: (1) , North Utica Shopping Center (2) , Riverside Mall Shopping Center (3) , Grand Union Plaza Shopping Center (4) . Display/hide their locations on the map
Churches in Utica include: (A) , Saint Basils Melkite Catholic Church (B) , Church of the Nazarene (C) , United Church of Christ (D) , Christian and Missionary Alliance Church (E) , Saint Mary Blessed Sacrament Church (F) , Kingdom Hall of Jehovahs Witnesses (G) , All Saints Episcopal Church (H) , Beth-El Congregation Temple House (I) . Display/hide their locations on the map
Cemeteries: (1) , Saint Marys Cemetery (2) , Burton Cemetery (3) , Saint Peters Cemetery (4) , Forest Hill Cemetery (5) , New Forest Cemetery (6) , Sherman Cemetery (7) . Display/hide their locations on the map
Creeks: (A) , Ballou Creek (B) , Starch Factory Creek (C) , Nail Creek (D) . Display/hide their locations on the map
Parks in Utica include: (1) , Johnson Park (2) , Horatio Seymour Park (3) , Roscoe Conkling Park (4) , Proctor Park (5) , Pixley Park (6) , Edward J Hirt Playground (7) , North Utica Park (8) , Richard P Conner Park (9) . Display/hide their locations on the map
Tourist attraction: (1) . Display/hide its approximate location on the map
Hotels: (1) , Passport Inn (2243 State Route 5) (2) , Best Western Gateway Inn (175 North Genesee Street) (3) , Country Motel (1477 Herkimer Road) (4) , Arc Oneida-Lewis Chapter Nysarc - Four Seasons Day Services (925 Stark Street) (5) , Davis Motel (1516 Herkimer Road) (6) . Display/hide their approximate locations on the map
Courts: (1) , Oneida-County - Courts-Supreme- Office Of Supreme Court Judge Anthony F Sha (Elizabeth) (2) , Oneida-County - Appellate Division- Office Of The Supreme Court Judge John T Buckley- Courts-Sup (800 Park Avenue) (3) . Display/hide their approximate locations on the map
Birthplace of: James S. Sherman - (1855-1912), Vice President of the United States, Scott C. Despres - Wrestler, E. Fuller Torrey - Activist, Richard Henry Savage - Soilder, James Dwight Dana - Geologist, Tyler Newton - JBL Basketball player, Annette Funicello - (born 1952), actress, John Zogby - Political pollster, Mark Danner - Newspaper reporter, James A. Mulligan - Union Army general.
Oneida County has a predicted average indoor radon screening level between 2 and 4 pCi/L (pico curies per liter) - Moderate Potential Drinking water stations with addresses in Utica and their reported violations in the past:
CLEARFORK MHP PWS (Serves OH, Population served: 389, Groundwater):
Past monitoring violations:
4 routine major monitoring violations
Population served: 150, Groundwater):
Past monitoring violations:
One routine major monitoring violation
Address: 821 JAMES STREET Population served: 55, Groundwater):
Past monitoring violations:
5 routine major monitoring violations
One regular monitoring violation
Average household size: This city:
2.4 peopleNew York:
2.6 people
Percentage of family households: This city:
56.4%Whole state:
63.5%
Percentage of households with unmarried partners: This city:
8.6%Whole state:
6.8%
Likely homosexual households (counted as self-reported same-sex unmarried-partner households)
Lesbian couples: 0.4% of all households Gay men: 0.3% of all households
People in group quarters in Utica in 2010:
1,348 people in college/university student housing
983 people in nursing facilities/skilled-nursing facilities
234 people in residential treatment centers for adults
162 people in group homes intended for adults
100 people in emergency and transitional shelters (with sleeping facilities) for people experiencing homelessness
91 people in mental (psychiatric) hospitals and psychiatric units in other hospitals
54 people in other noninstitutional facilities
49 people in group homes for juveniles (non-correctional)
40 people in in-patient hospice facilities
8 people in correctional facilities intended for juveniles
7 people in workers' group living quarters and job corps centers
People in group quarters in Utica in 2000:
1,151 people in nursing homes
995 people in college dormitories (includes college quarters off campus)
397 people in mental (psychiatric) hospitals or wards
263 people in homes for the mentally retarded
174 people in other noninstitutional group quarters
148 people in wards in general hospitals for patients who have no usual home elsewhere
114 people in homes for the mentally ill
72 people in homes or halfway houses for drug/alcohol abuse
43 people in other nonhousehold living situations
29 people in other group homes
8 people in homes for abused, dependent, and neglected children
7 people in short-term care, detention or diagnostic centers for delinquent children
3 people in schools, hospitals, or wards for the intellectually disabled
Banks with most branches in Utica (2011 data):
Bank of America, National Association: 268 Genessee St Drive-Up Branch, 268 Genesee Street Branch, East Utica Branch, North Utica Branch. Info updated 2009/11/18: Bank assets: $1,451,969.3 mil, Deposits: $1,077,176.8 mil, headquarters in Charlotte, NC, positive income , 5782 total offices , Holding Company: Bank Of America Corporation
Adirondack Bank: Utica Branch, Charlotte Street Branch, at 185 Genesee Street. Info updated 2006/11/03: Bank assets: $580.7 mil, Deposits: $477.2 mil, local headquarters , positive income , Commercial Lending Specialization, 17 total offices , Holding Company: Adirondack Bancorp, Inc.
Manufacturers and Traders Trust Company: Herkimer Road Branch at 1 Herkimer Road, branch established on 2001/11/19; Partners Trust Bank Branch at 233 Genesee Street, branch established on 1839/04/26. Info updated 2011/08/08: Bank assets: $76,887.1 mil, Deposits: $60,064.2 mil, headquarters in Buffalo, NY, positive income , Commercial Lending Specialization, 808 total offices , Holding Company: M&T Bank Corporation
RBS Citizens, National Association: Utica/Walmart Branch at 710 Horatio Street, branch established on 2004/11/14; Utica Downtown at 266 Genesee Street, branch established on 1987/10/31. Info updated 2007/09/19: Bank assets: $106,940.6 mil, Deposits: $75,690.2 mil, headquarters in Providence, RI, positive income , 1135 total offices , Holding Company: Uk Financial Investments Limited
NBT Bank, National Association: Utica Financial Center Branch at 270 Genesee Street, branch established on 2011/09/26. Info updated 2012/02/02: Bank assets: $5,558.5 mil, Deposits: $4,381.4 mil, headquarters in Norwich, NY, positive income , Commercial Lending Specialization, 133 total offices , Holding Company: Nbt Bancorp Inc.
First Niagara Bank, National Association: Utica Branch at 50 Auert Avenue, branch established on 1884/01/01. Info updated 2011/06/09: Bank assets: $32,750.6 mil, Deposits: $19,595.4 mil, headquarters in Buffalo, NY, positive income , Commercial Lending Specialization, 351 total offices , Holding Company: First Niagara Financial Group, Inc.
Bank of Utica: Bank Of Utica at 222 Genesee Street, branch established on 1927/04/23. Info updated 2006/11/03: Bank assets: $878.1 mil, Deposits: $728.7 mil, local headquarters , positive income , 1 total offices
KeyBank National Association: Utica Branch at 255 Genesee Street, branch established on 1973/02/16. Info updated 2008/03/03: Bank assets: $86,198.8 mil, Deposits: $64,214.8 mil, headquarters in Cleveland, OH, positive income , Commercial Lending Specialization, 1067 total offices , Holding Company: Keycorp
HSBC Bank USA, National Association: East Utica Branch at 1125 Mohawk Street, branch established on 1969/04/01. Info updated 2010/11/30: Bank assets: $206,009.7 mil, Deposits: $149,026.8 mil, headquarters in Mc Lean, VA, positive income , 474 total offices , Holding Company: Hsbc Holdings Plc
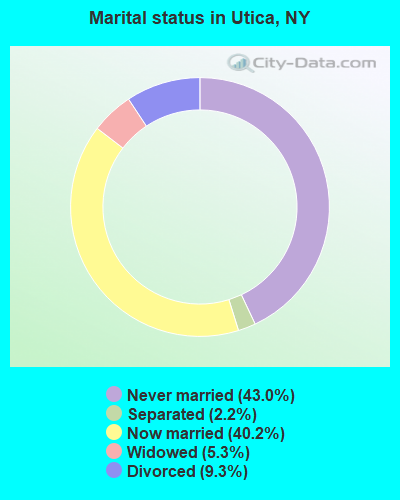
For population 15 years and over in Utica:
Never married: 43.0%Now married: 40.2%Separated: 2.2%Widowed: 5.3%Divorced: 9.3% For population 25 years and over in Utica:
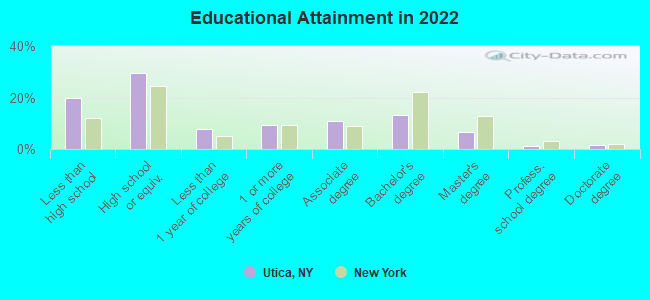
High school or higher: 80.8%Bachelor's degree or higher: 20.6%Graduate or professional degree: 8.4%Unemployed: 8.4%Mean travel time to work (commute): 17.2 minutes
Education Gini index (Inequality in education) Here:
17.4New York average:
13.9
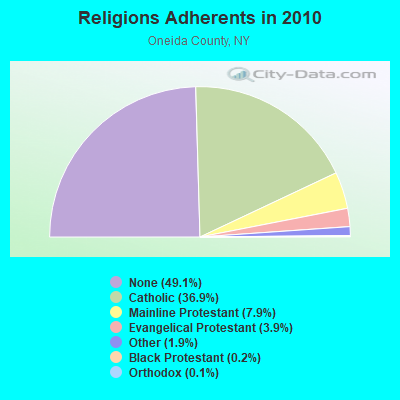
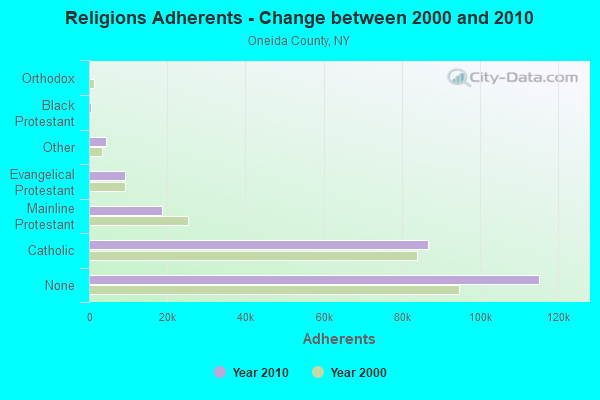
Religion statistics for Utica, NY (based on Oneida County data)
Religion Adherents Congregations Catholic 86,750 51 Mainline Protestant 18,610 95 Evangelical Protestant 9,119 75 Other 4,416 16 Black Protestant 504 4 Orthodox 270 3 None 115,209 -
Source: Clifford Grammich, Kirk Hadaway, Richard Houseal, Dale E.Jones, Alexei Krindatch, Richie Stanley and Richard H.Taylor. 2012. 2010 U.S.Religion Census: Religious Congregations & Membership Study. Association of Statisticians of American Religious Bodies. Jones, Dale E., et al. 2002. Congregations and Membership in the United States 2000. Nashville, TN: Glenmary Research Center. Graphs represent county-level data
Food Environment Statistics: Number of grocery stores : 49Oneida County :
2.12 / 10,000 pop.New York :
4.13 / 10,000 pop.
Number of supercenters and club stores : 3Oneida County :
0.13 / 10,000 pop.New York :
0.06 / 10,000 pop.
Number of convenience stores (no gas) : 11Here :
0.47 / 10,000 pop.State :
0.92 / 10,000 pop.
Number of convenience stores (with gas) : 75This county :
3.24 / 10,000 pop.New York :
1.68 / 10,000 pop.
Number of full-service restaurants : 205Oneida County :
8.85 / 10,000 pop.New York :
8.82 / 10,000 pop.
Adult diabetes rate : This county :
8.8%New York :
8.2%
Adult obesity rate : Oneida County :
24.4%New York :
23.8%
Low-income preschool obesity rate : This county :
15.0%New York :
15.6%
Health and Nutrition:
Average overall health of teeth and gums : This city:
45.4%New York:
48.1%
People feeling badly about themselves : Utica:
21.0%New York:
20.3%
People not drinking alcohol at all : This city:
11.8%New York:
11.1%
Average hours sleeping at night : Overweight people : Utica:
33.3%New York:
33.4%
General health condition : Utica:
54.6%New York:
56.5%
Average condition of hearing : This city:
77.4%State:
80.2%
More about Health and Nutrition of Utica, NY Residents
Local government employment and payroll (March 2022)
Function
Full-time employees
Monthly full-time payroll
Average yearly full-time wage
Part-time employees
Monthly part-time payroll
Police Protection - Officers
144 $1,193,777 $99,481 0 $0 Firefighters
122 $892,450 $87,782 0 $0 Housing and Community Development (Local)
71 $301,224 $50,911 9 $10,545 Police - Other
32 $220,085 $82,532 5 $5,536 Parks and Recreation
26 $95,250 $43,962 11 $7,785 Solid Waste Management
25 $153,849 $73,848 0 $0 Streets and Highways
24 $123,500 $61,750 2 $709 Other and Unallocable
21 $88,935 $50,820 1 $354 Financial Administration
20 $102,869 $61,721 0 $0 Other Government Administration
12 $57,149 $57,149 23 $14,915 Sewerage
10 $63,202 $75,842 0 $0 Welfare
9 $34,992 $46,656 1 $2,181 Judicial and Legal
5 $30,734 $73,762 4 $11,667 Fire - Other
2 $15,912 $95,472 0 $0
Totals for Government
523 $3,373,927 $77,413 56 $53,692
Utica government finances - Expenditure in 2021 (per resident):
Assistance and Subsidies - Public Welfare, Cash Assistance Programs - Other: $6,552,000 ($102.25)
Construction - Electric Utilities: $10,216,000 ($159.42)
General - Other: $4,864,000 ($75.90)Regular Highways: $3,034,000 ($47.35)Parks and Recreation: $225,000 ($3.51)Local Fire Protection: $196,000 ($3.06)Sewerage: $169,000 ($2.64)Current Operations - General - Other: $24,756,000 ($386.32)
Police Protection: $16,872,000 ($263.29)Local Fire Protection: $11,115,000 ($173.45)Parks and Recreation: $2,272,000 ($35.46)Housing and Community Development: $1,976,000 ($30.84)Regular Highways: $1,863,000 ($29.07)Central Staff Services: $1,745,000 ($27.23)Solid Waste Management: $1,634,000 ($25.50)Sewerage: $1,232,000 ($19.23)Financial Administration: $1,213,000 ($18.93)Health - Other: $944,000 ($14.73)Natural Resources - Other: $702,000 ($10.95)Judicial and Legal Services: $668,000 ($10.42)Protective Inspection and Regulation - Other: $587,000 ($9.16)General Public Buildings: $417,000 ($6.51)Parking Facilities: $235,000 ($3.67)General - Interest on Debt: $3,211,000 ($50.11)
Other Capital Outlay - Police Protection: $440,000 ($6.87)
Housing and Community Development: $299,000 ($4.67)General - Other: $161,000 ($2.51)Local Fire Protection: $157,000 ($2.45)Regular Highways: $62,000 ($0.97)General Public Building: $44,000 ($0.69)Parks and Recreation: $21,000 ($0.33)Financial Administration: $18,000 ($0.28)Protective Inspection and Regulation - Other: $10,000 ($0.16)Health - Other: $9,000 ($0.14)Judicial and Legal Services: $7,000 ($0.11)Public Welfare - Other: $6,000 ($0.09)Solid Waste Management: $5,000 ($0.08)Central Staff Services: $1,000 ($0.02)Total Salaries and Wages: $35,109,000 ($547.88)
Utica government finances - Revenue in 2021 (per resident):
Charges - Sewerage: $3,827,000 ($59.72)
Other: $2,967,000 ($46.30)Parks and Recreation: $447,000 ($6.98)Parking Facilities: $296,000 ($4.62)Federal Intergovernmental - Housing and Community Development: $10,303,000 ($160.78)
Other: $904,000 ($14.11)Local Intergovernmental - Other: $25,000 ($0.39)
Miscellaneous - General Revenue - Other: $2,216,000 ($34.58)
Fines and Forfeits: $250,000 ($3.90)Rents: $172,000 ($2.68)Interest Earnings: $45,000 ($0.70)Sale of Property: $19,000 ($0.30)State Intergovernmental - General Local Government Support: $16,110,000 ($251.40)
Other: $3,730,000 ($58.21)Highways: $1,448,000 ($22.60)Tax - Property: $31,473,000 ($491.14)
General Sales and Gross Receipts: $15,325,000 ($239.15)Public Utilities Sales: $1,289,000 ($20.12)Other License: $1,114,000 ($17.38)Other: $74,000 ($1.15)Occupation and Business License - Other: $1,000 ($0.02)Amusements License: $1,000 ($0.02)Other Selective Sales: $1,000 ($0.02)
Utica government finances - Debt in 2021 (per resident):
Long Term Debt - Outstanding Unspecified Public Purpose: $54,600,000 ($852.05)
Beginning Outstanding - Unspecified Public Purpose: $47,652,000 ($743.62)Issue, Unspecified Public Purpose: $22,045,000 ($344.02)Retired Unspecified Public Purpose: $15,097,000 ($235.59)Short Term Debt Outstanding - Beginning: $20,966,000 ($327.18)
End of Fiscal Year: $8,474,000 ($132.24)
Utica government finances - Cash and Securities in 2021 (per resident):
Bond Funds - Cash and Securities: $3,478,000 ($54.28)
Other Funds - Cash and Securities: $20,253,000 ($316.05)
Sinking Funds - Cash and Securities: $911,000 ($14.22)
Businesses in Utica, NY
Name Count Name Count
AMF Bowling 1 KFC 1 AT&T 1 Lane Furniture 1 Advance Auto Parts 1 Little Caesars Pizza 1 Applebee's 1 Lowe's 1 Arby's 1 MasterBrand Cabinets 2 Ascend Collection 1 McDonald's 4 AutoZone 1 New Balance 2 BMW 1 Pizza Hut 1 Best Western 1 Red Roof Inn 1 Burger King 1 Rite Aid 5 Burlington Coat Factory 1 Subaru 1 Curves 1 Subway 4 DHL 2 Super 8 1 Days Inn 1 T-Mobile 1 Dennys 1 Taco Bell 1 Domino's Pizza 1 The Room Place 1 Dunkin Donuts 5 U-Haul 4 FedEx 9 UPS 9 Firestone Complete Auto Care 1 Verizon Wireless 2 Ford 1 Walgreens 1 GNC 1 Walmart 1 H&R Block 2 Wendy's 1 Hilton 1
Strongest AM radio stations in Utica:
WTLB (1310 AM; 5 kW; UTICA, NY; Owner: GALAXY COMMUNICATIONS, L.P.)
WUTQ (1550 AM; 1 kW; UTICA, NY)
WIBX (950 AM; 5 kW; UTICA, NY; Owner: REGENT LICENSEE OF UTICA/ROME, INC.)
WRUN (1150 AM; 5 kW; UTICA, NY)
WGY (810 AM; 50 kW; SCHENECTADY, NY; Owner: CLEAR CHANNEL BROADCASTING LICENSES, INC.)
WADR (1480 AM; 5 kW; REMSEN, NY; Owner: CLEAR CHANNEL BROADCASTING LICENSES, INC.)
WNRS (1420 AM; 1 kW; HERKIMER, NY; Owner: ARJUNA BROADCASTING CORP.)
WPTR (1540 AM; 50 kW; ALBANY, NY; Owner: KIMTRON, INC.)
WNNZ (640 AM; 50 kW; WESTFIELD, MA; Owner: CLEAR CHANNEL BROADCASTING LICENSES, INC.)
WSYR (570 AM; 5 kW; SYRACUSE, NY; Owner: CLEAR CHANNEL BROADCASTING LICENSES, INC.)
WHEN (620 AM; 5 kW; SYRACUSE, NY; Owner: CLEAR CHANNEL BROADCASTING LICENSES, INC.)
WMCA (570 AM; 50 kW; NEW YORK, NY; Owner: SALEM MEDIA OF NEW YORK, LLC)
WHAM (1180 AM; 50 kW; ROCHESTER, NY; Owner: CITICASTERS LICENSES, L.P.)
Strongest FM radio stations in Utica:
WKVU (100.7 FM; UTICA, NY; Owner: EDUCATIONAL MEDIA FOUNDATION)
WUNY (89.5 FM; UTICA, NY; Owner: PUBLIC BC COUNCIL OF CENTRAL NY, INC)
WOUR (96.9 FM; UTICA, NY; Owner: CLEAR CHANNEL BROADCASTING LICENSES, INC.)
W256AJ (99.1 FM; UTICA, NY; Owner: CHRISTIAN BROADCASTING SYSTEM, LTD.)
WLZW (98.7 FM; UTICA, NY; Owner: REGENT LICENSEE OF UTICA/ROME, INC.)
WKLL (94.9 FM; FRANKFORT, NY; Owner: GALAXY COMMUNICATIONS, L.P.)
WRCK (107.3 FM; UTICA, NY; Owner: GALAXY COMMUNICATIONS, L.P.)
WBGK (99.7 FM; NEWPORT VILLAGE, NY; Owner: ROSER COMMUNICATIONS NETWORK, INC.)
WSKS (97.9 FM; WHITESBORO, NY; Owner: CLEAR CHANNEL BROADCASTING LICENSES, INC.)
WRBY (102.5 FM; ROME, NY; Owner: CLEAR CHANNEL BROADCASTING LICENSES, INC.)
WFRG-FM (104.3 FM; UTICA, NY; Owner: REGENT LICENSEE OF UTICA/ROME, INC.)
WODZ-FM (96.1 FM; ROME, NY; Owner: REGENT LICENSEE OF UTICA/ROME, INC.)
WUCL (93.5 FM; REMSEN, NY; Owner: CLEAR CHANNEL BROADCASTING LICENSES, INC.)
WXUR (92.7 FM; HERKIMER, NY; Owner: ARJUNA BROADCASTING CORP.)
WPNR-FM (90.7 FM; UTICA, NY; Owner: UTICA COLLEGE)
WMCR-FM (106.3 FM; ONEIDA, NY; Owner: WARREN BROADCASTING CO. INC.)
WSKU (105.5 FM; LITTLE FALLS, NY; Owner: CLEAR CHANNEL BROADCASTING LICENSES, INC.)
WJIV (101.9 FM; CHERRY VALLEY, NY; Owner: CHRISTIAN BROADCASTING SYSTEM, LTD.)
WRVN (91.9 FM; UTICA, NY; Owner: STATE UNIVERSITY OF NEW YORK)
WWDG (105.1 FM; DERUYTER, NY; Owner: CLEAR CHANNEL BROADCASTING LICENSES, INC.)
TV broadcast stations around Utica:
W59AU (Channel 59; UTICA, NY; Owner: PUBLIC B/CING.COUNCIL,CENTRAL N. Y.)
WUTR (Channel 20; UTICA, NY; Owner: CENTRAL NY NEWS, INC.)
WPNY-LP (Channel 11; UTICA, ETC., NY; Owner: QUORUM OF UTICA LICENSE, LLC)
W53AM (Channel 53; UTICA, NY; Owner: QUORUM OF UTICA LICENSE, LLC)
WFXV (Channel 33; UTICA, NY; Owner: QUORUM OF UTICA LICENSE, LLC)
WKTV (Channel 2; UTICA, NY; Owner: SMITH TELEVISION OF NEW YORK LICENSE HOLDINGS, INC.)
W51CV (Channel 51; UTICA, NY; Owner: TRINITY BROADCASTING NETWORK)
W27BJ (Channel 27; UTICA, NY; Owner: SOUL'S HARBOR PENTECOSTAL CHURCH)
WIXT-TV (Channel 9; SYRACUSE, NY; Owner: CENTRAL NY NEWS, INC.)
W12BZ (Channel 12; ROME, NY; Owner: KEVIN O'KANE)
WSPX-TV (Channel 56; SYRACUSE, NY; Owner: PAXSON SYRACUSE LICENSE, INC.)
WCNY-TV (Channel 24; SYRACUSE, NY; Owner: PUBLIC BROADCASTING COUNCIL OF CENTRAL NEW YORK)
WNYS-TV (Channel 43; SYRACUSE, NY; Owner: RKM MEDIA, INC.)
Medal of Honor Recipients
Medal of Honor Recipients born in Utica: Daniel Butterfield, Oscar F. Long.
National Bridge Inventory (NBI) Statistics 122 Number of bridges1,608ft / 490m Total length $239,612,000 Total costs1,219,282 Total average daily traffic64,574 Total average daily truck traffic
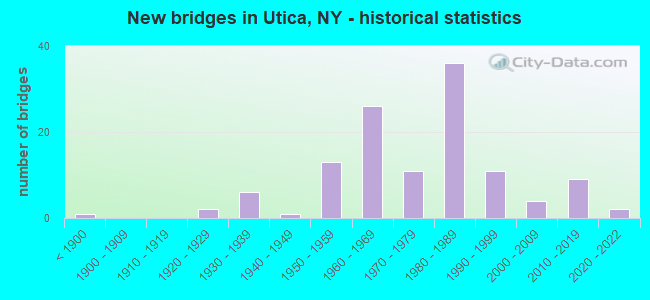
New bridges - historical statistics
1 Before 1900 2 1920-1929 6 1930-1939 1 1940-1949 13 1950-1959 26 1960-1969 11 1970-1979 36 1980-1989 11 1990-1999 4 2000-2009 9 2010-2019 2 2020-2022
See full National Bridge Inventory statistics for Utica, NY
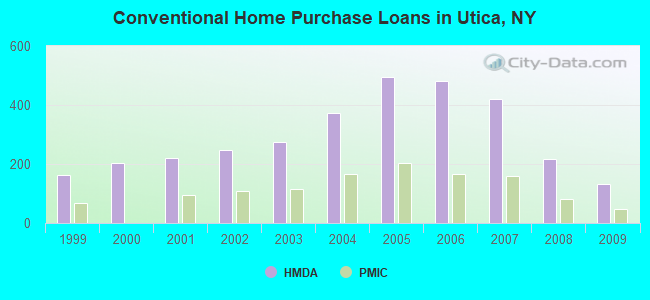
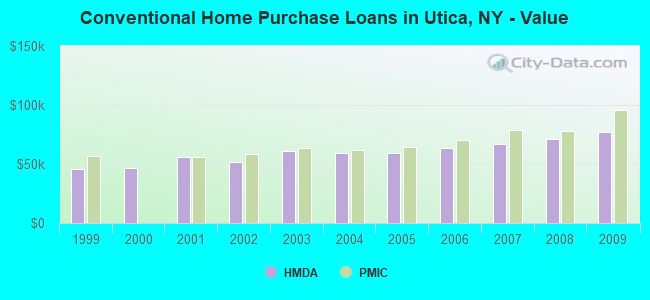
Home Mortgage Disclosure Act Aggregated Statistics For Year 2009(Based on 24 full tracts) A) FHA, FSA/RHS & VA B) Conventional C) Refinancings D) Home Improvement Loans E) Loans on Dwellings For 5+ Families F) Non-occupant Loans on G) Loans On Manufactured Number Average Value Number Average Value Number Average Value Number Average Value Number Average Value Number Average Value Number Average Value
LOANS ORIGINATED 181 $78,204 133 $77,075 271 $71,668 117 $19,248 0 $0 30 $57,733 1 $82,000 APPLICATIONS APPROVED, NOT ACCEPTED 1 $68,000 7 $87,143 37 $80,919 15 $39,933 1 $18,000 2 $34,000 1 $43,000 APPLICATIONS DENIED 36 $60,778 30 $56,733 186 $80,349 170 $14,806 3 $111,667 32 $47,500 1 $43,000 APPLICATIONS WITHDRAWN 11 $81,455 15 $161,000 111 $87,207 10 $39,900 0 $0 5 $38,800 0 $0 FILES CLOSED FOR INCOMPLETENESS 2 $80,000 5 $60,000 21 $74,524 0 $0 0 $0 2 $19,000 0 $0
Aggregated Statistics For Year 2008(Based on 23 full tracts) A) FHA, FSA/RHS & VA B) Conventional C) Refinancings D) Home Improvement Loans E) Loans on Dwellings For 5+ Families F) Non-occupant Loans on G) Loans On Manufactured Number Average Value Number Average Value Number Average Value Number Average Value Number Average Value Number Average Value Number Average Value
LOANS ORIGINATED 162 $77,617 218 $71,477 271 $72,878 209 $18,995 5 $80,200 42 $62,929 2 $40,000 APPLICATIONS APPROVED, NOT ACCEPTED 2 $102,500 24 $78,292 38 $78,026 20 $14,850 0 $0 6 $48,333 4 $75,250 APPLICATIONS DENIED 25 $77,280 82 $56,037 303 $80,535 322 $20,037 8 $441,500 66 $53,621 6 $39,167 APPLICATIONS WITHDRAWN 13 $89,308 20 $92,750 83 $86,494 18 $40,667 1 $200,000 6 $53,333 2 $50,000 FILES CLOSED FOR INCOMPLETENESS 10 $67,200 10 $73,400 16 $66,688 5 $23,600 0 $0 5 $38,000 0 $0
Aggregated Statistics For Year 2007(Based on 23 full tracts) A) FHA, FSA/RHS & VA B) Conventional C) Refinancings D) Home Improvement Loans E) Loans on Dwellings For 5+ Families F) Non-occupant Loans on G) Loans On Manufactured Number Average Value Number Average Value Number Average Value Number Average Value Number Average Value Number Average Value Number Average Value
LOANS ORIGINATED 138 $78,761 419 $67,105 334 $65,578 317 $21,940 7 $164,429 100 $54,290 0 $0 APPLICATIONS APPROVED, NOT ACCEPTED 7 $64,429 80 $61,762 77 $71,584 47 $26,426 1 $200,000 32 $56,000 3 $51,667 APPLICATIONS DENIED 10 $89,000 146 $63,815 433 $71,238 464 $24,450 3 $1,328,000 100 $51,900 7 $29,429 APPLICATIONS WITHDRAWN 13 $80,538 44 $85,955 221 $74,109 31 $54,419 1 $240,000 22 $48,364 0 $0 FILES CLOSED FOR INCOMPLETENESS 3 $74,333 18 $108,833 34 $80,265 6 $46,333 1 $775,000 9 $57,333 0 $0
Aggregated Statistics For Year 2006(Based on 24 full tracts) A) FHA, FSA/RHS & VA B) Conventional C) Refinancings D) Home Improvement Loans E) Loans on Dwellings For 5+ Families F) Non-occupant Loans on G) Loans On Manufactured Number Average Value Number Average Value Number Average Value Number Average Value Number Average Value Number Average Value Number Average Value
LOANS ORIGINATED 136 $77,118 483 $63,936 367 $62,681 461 $18,716 3 $54,000 161 $55,130 2 $51,500 APPLICATIONS APPROVED, NOT ACCEPTED 7 $76,143 87 $61,563 103 $66,427 48 $21,000 1 $64,000 48 $53,979 1 $55,000 APPLICATIONS DENIED 17 $77,765 161 $59,696 543 $69,878 563 $21,375 5 $112,200 127 $44,228 11 $32,273 APPLICATIONS WITHDRAWN 9 $77,556 64 $71,547 301 $70,618 41 $48,976 0 $0 41 $70,073 1 $68,000 FILES CLOSED FOR INCOMPLETENESS 0 $0 35 $73,714 80 $84,338 12 $28,583 1 $25,000 15 $72,800 0 $0
Aggregated Statistics For Year 2005(Based on 24 full tracts) A) FHA, FSA/RHS & VA B) Conventional C) Refinancings D) Home Improvement Loans E) Loans on Dwellings For 5+ Families F) Non-occupant Loans on G) Loans On Manufactured Number Average Value Number Average Value Number Average Value Number Average Value Number Average Value Number Average Value Number Average Value
LOANS ORIGINATED 133 $66,617 495 $59,667 476 $59,210 278 $21,766 3 $60,333 174 $47,126 2 $47,000 APPLICATIONS APPROVED, NOT ACCEPTED 7 $60,143 66 $55,182 134 $57,590 49 $29,347 0 $0 35 $43,257 6 $50,000 APPLICATIONS DENIED 12 $69,750 116 $55,241 647 $66,711 441 $21,499 3 $1,653,333 134 $30,127 8 $35,875 APPLICATIONS WITHDRAWN 8 $60,500 56 $62,339 437 $72,423 47 $53,979 1 $60,000 32 $73,062 4 $54,000 FILES CLOSED FOR INCOMPLETENESS 1 $73,000 29 $88,655 75 $78,467 5 $42,000 0 $0 6 $60,000 0 $0
Aggregated Statistics For Year 2004(Based on 24 full tracts) A) FHA, FSA/RHS & VA B) Conventional C) Refinancings D) Home Improvement Loans E) Loans on Dwellings For 5+ Families F) Non-occupant Loans on G) Loans On Manufactured Number Average Value Number Average Value Number Average Value Number Average Value Number Average Value Number Average Value Number Average Value
LOANS ORIGINATED 166 $63,271 374 $59,655 480 $61,188 264 $17,345 4 $738,750 116 $43,534 1 $3,000 APPLICATIONS APPROVED, NOT ACCEPTED 2 $46,500 36 $57,889 133 $64,955 17 $28,471 0 $0 9 $58,111 7 $66,143 APPLICATIONS DENIED 18 $52,333 91 $49,604 617 $63,141 270 $22,230 3 $606,667 66 $46,864 14 $30,143 APPLICATIONS WITHDRAWN 14 $46,214 36 $51,833 474 $70,631 49 $40,245 2 $740,000 26 $55,923 2 $49,500 FILES CLOSED FOR INCOMPLETENESS 3 $61,333 26 $57,077 68 $63,618 8 $63,125 1 $1,500,000 8 $49,125 0 $0
Aggregated Statistics For Year 2003(Based on 24 full tracts) A) FHA, FSA/RHS & VA B) Conventional C) Refinancings D) Home Improvement Loans E) Loans on Dwellings For 5+ Families F) Non-occupant Loans on Number Average Value Number Average Value Number Average Value Number Average Value Number Average Value Number Average Value
LOANS ORIGINATED 227 $53,480 274 $60,923 815 $54,747 180 $16,106 10 $304,700 73 $43,795 APPLICATIONS APPROVED, NOT ACCEPTED 2 $69,000 24 $49,083 160 $51,825 12 $33,917 0 $0 13 $42,462 APPLICATIONS DENIED 18 $55,944 70 $51,057 582 $53,880 191 $17,560 1 $52,000 48 $60,896 APPLICATIONS WITHDRAWN 11 $42,091 27 $50,148 362 $61,773 26 $27,731 0 $0 18 $39,111 FILES CLOSED FOR INCOMPLETENESS 1 $62,000 12 $51,250 37 $60,892 4 $27,750 0 $0 4 $38,000
Aggregated Statistics For Year 2002(Based on 24 full tracts) A) FHA, FSA/RHS & VA B) Conventional C) Refinancings D) Home Improvement Loans E) Loans on Dwellings For 5+ Families F) Non-occupant Loans on Number Average Value Number Average Value Number Average Value Number Average Value Number Average Value Number Average Value
LOANS ORIGINATED 205 $50,180 247 $52,117 497 $53,328 226 $14,358 1 $35,000 73 $36,192 APPLICATIONS APPROVED, NOT ACCEPTED 2 $56,500 19 $42,895 145 $47,669 14 $19,571 1 $41,000 10 $35,100 APPLICATIONS DENIED 22 $50,273 81 $49,679 568 $50,688 191 $13,230 0 $0 41 $38,707 APPLICATIONS WITHDRAWN 7 $44,571 35 $63,286 356 $55,438 28 $19,357 0 $0 19 $49,316 FILES CLOSED FOR INCOMPLETENESS 1 $24,000 14 $66,929 56 $58,893 2 $18,000 0 $0 5 $50,000
Aggregated Statistics For Year 2001(Based on 24 full tracts) A) FHA, FSA/RHS & VA B) Conventional C) Refinancings D) Home Improvement Loans E) Loans on Dwellings For 5+ Families F) Non-occupant Loans on Number Average Value Number Average Value Number Average Value Number Average Value Number Average Value Number Average Value
LOANS ORIGINATED 208 $49,688 222 $56,122 425 $49,115 231 $10,680 2 $491,500 61 $39,754 APPLICATIONS APPROVED, NOT ACCEPTED 6 $69,333 26 $35,846 62 $49,403 35 $15,314 0 $0 14 $46,786 APPLICATIONS DENIED 30 $47,000 86 $41,349 485 $47,880 241 $14,983 0 $0 37 $43,027 APPLICATIONS WITHDRAWN 7 $46,286 28 $51,821 332 $51,292 43 $22,209 0 $0 18 $38,111 FILES CLOSED FOR INCOMPLETENESS 2 $43,500 4 $29,500 33 $42,455 6 $24,333 0 $0 9 $43,000
Aggregated Statistics For Year 2000(Based on 24 full tracts) A) FHA, FSA/RHS & VA B) Conventional C) Refinancings D) Home Improvement Loans E) Loans on Dwellings For 5+ Families F) Non-occupant Loans on Number Average Value Number Average Value Number Average Value Number Average Value Number Average Value Number Average Value
LOANS ORIGINATED 201 $43,463 203 $46,739 204 $42,897 201 $16,816 0 $0 47 $41,106 APPLICATIONS APPROVED, NOT ACCEPTED 5 $38,600 31 $35,387 47 $32,319 52 $19,500 0 $0 14 $26,000 APPLICATIONS DENIED 12 $37,333 113 $36,637 362 $40,110 221 $18,285 0 $0 32 $36,562 APPLICATIONS WITHDRAWN 12 $41,750 15 $48,533 207 $40,415 32 $27,938 1 $50,000 15 $33,933 FILES CLOSED FOR INCOMPLETENESS 6 $36,000 9 $44,556 61 $52,721 5 $22,800 0 $0 8 $32,625
Aggregated Statistics For Year 1999(Based on 29 full and 2 partial tracts) A) FHA, FSA/RHS & VA B) Conventional C) Refinancings D) Home Improvement Loans E) Loans on Dwellings For 5+ Families F) Non-occupant Loans on Number Average Value Number Average Value Number Average Value Number Average Value Number Average Value Number Average Value
LOANS ORIGINATED 158 $45,551 164 $45,453 348 $46,195 190 $12,364 2 $316,800 50 $33,381 APPLICATIONS APPROVED, NOT ACCEPTED 5 $52,742 38 $45,319 115 $42,262 49 $19,499 0 $0 20 $36,227 APPLICATIONS DENIED 17 $43,028 120 $35,398 408 $41,587 277 $13,850 2 $33,225 41 $38,799 APPLICATIONS WITHDRAWN 7 $53,877 28 $47,723 264 $43,846 37 $30,688 0 $0 15 $43,753 FILES CLOSED FOR INCOMPLETENESS 2 $33,055 2 $30,000 54 $45,717 1 $15,000 0 $0 4 $25,750
Detailed mortgage data for all 24 tracts in Utica, NY
Private Mortgage Insurance Companies Aggregated Statistics For Year 2009(Based on 16 full tracts) A) Conventional B) Refinancings C) Non-occupant Loans on Number Average Value Number Average Value Number Average Value
LOANS ORIGINATED 47 $96,085 4 $121,250 1 $76,000 APPLICATIONS APPROVED, NOT ACCEPTED 12 $66,833 3 $100,333 0 $0 APPLICATIONS DENIED 6 $59,833 0 $0 0 $0 APPLICATIONS WITHDRAWN 4 $93,750 0 $0 0 $0 FILES CLOSED FOR INCOMPLETENESS 0 $0 0 $0 0 $0
Aggregated Statistics For Year 2008(Based on 19 full tracts) A) Conventional B) Refinancings C) Non-occupant Loans on Number Average Value Number Average Value Number Average Value
LOANS ORIGINATED 83 $77,807 10 $104,300 10 $58,500 APPLICATIONS APPROVED, NOT ACCEPTED 25 $100,000 11 $99,182 2 $41,000 APPLICATIONS DENIED 7 $83,857 2 $365,000 3 $62,000 APPLICATIONS WITHDRAWN 8 $87,000 1 $83,000 2 $29,000 FILES CLOSED FOR INCOMPLETENESS 2 $90,000 0 $0 0 $0
Aggregated Statistics For Year 2007(Based on 21 full tracts) A) Conventional B) Refinancings C) Non-occupant Loans on Number Average Value Number Average Value Number Average Value
LOANS ORIGINATED 158 $79,051 22 $97,455 26 $57,962 APPLICATIONS APPROVED, NOT ACCEPTED 31 $69,097 7 $94,286 7 $40,857 APPLICATIONS DENIED 8 $96,750 1 $96,000 0 $0 APPLICATIONS WITHDRAWN 10 $82,000 1 $64,000 4 $59,250 FILES CLOSED FOR INCOMPLETENESS 1 $39,000 1 $80,000 0 $0
Aggregated Statistics For Year 2006(Based on 22 full tracts) A) Conventional B) Refinancings C) Non-occupant Loans on Number Average Value Number Average Value Number Average Value
LOANS ORIGINATED 167 $70,240 21 $71,857 29 $53,552 APPLICATIONS APPROVED, NOT ACCEPTED 38 $75,526 8 $76,375 8 $41,375 APPLICATIONS DENIED 3 $56,333 1 $54,000 2 $52,500 APPLICATIONS WITHDRAWN 9 $116,778 4 $69,000 2 $56,500 FILES CLOSED FOR INCOMPLETENESS 2 $58,000 0 $0 0 $0
Aggregated Statistics For Year 2005(Based on 21 full tracts) A) Conventional B) Refinancings C) Non-occupant Loans on Number Average Value Number Average Value Number Average Value
LOANS ORIGINATED 205 $64,288 25 $72,440 48 $48,062 APPLICATIONS APPROVED, NOT ACCEPTED 35 $74,800 20 $74,800 4 $50,500 APPLICATIONS DENIED 3 $52,000 2 $63,500 1 $40,000 APPLICATIONS WITHDRAWN 2 $84,500 4 $71,500 0 $0 FILES CLOSED FOR INCOMPLETENESS 1 $68,000 1 $64,000 1 $64,000
Aggregated Statistics For Year 2004(Based on 19 full tracts) A) Conventional B) Refinancings C) Non-occupant Loans on Number Average Value Number Average Value Number Average Value
LOANS ORIGINATED 166 $61,867 34 $84,294 25 $52,960 APPLICATIONS APPROVED, NOT ACCEPTED 30 $69,833 14 $78,143 5 $47,600 APPLICATIONS DENIED 0 $0 2 $64,000 0 $0 APPLICATIONS WITHDRAWN 8 $58,500 2 $96,000 0 $0 FILES CLOSED FOR INCOMPLETENESS 0 $0 0 $0 0 $0
Aggregated Statistics For Year 2003(Based on 20 full tracts) A) Conventional B) Refinancings C) Non-occupant Loans on Number Average Value Number Average Value Number Average Value
LOANS ORIGINATED 115 $63,791 90 $66,733 14 $49,429 APPLICATIONS APPROVED, NOT ACCEPTED 15 $62,733 24 $64,708 6 $46,667 APPLICATIONS DENIED 3 $79,000 1 $101,000 0 $0 APPLICATIONS WITHDRAWN 4 $44,000 4 $76,250 0 $0 FILES CLOSED FOR INCOMPLETENESS 0 $0 1 $86,000 0 $0
Aggregated Statistics For Year 2002(Based on 20 full tracts) A) Conventional B) Refinancings C) Non-occupant Loans on Number Average Value Number Average Value Number Average Value
LOANS ORIGINATED 110 $58,655 53 $66,830 16 $41,562 APPLICATIONS APPROVED, NOT ACCEPTED 18 $64,944 8 $59,500 2 $38,500 APPLICATIONS DENIED 4 $51,500 3 $80,000 3 $50,000 APPLICATIONS WITHDRAWN 1 $95,000 4 $71,000 1 $45,000 FILES CLOSED FOR INCOMPLETENESS 0 $0 0 $0 0 $0
Aggregated Statistics For Year 2001(Based on 21 full tracts) A) Conventional B) Refinancings C) Non-occupant Loans on Number Average Value Number Average Value Number Average Value
LOANS ORIGINATED 95 $55,516 44 $62,955 10 $46,900 APPLICATIONS APPROVED, NOT ACCEPTED 25 $63,240 5 $83,000 7 $55,571 APPLICATIONS DENIED 7 $51,857 0 $0 1 $67,000 APPLICATIONS WITHDRAWN 1 $67,000 2 $58,500 1 $67,000 FILES CLOSED FOR INCOMPLETENESS 0 $0 0 $0 0 $0
Aggregated Statistics For Year 1999(Based on 20 full and 1 partial tracts) A) Conventional B) Refinancings C) Non-occupant Loans on Number Average Value Number Average Value Number Average Value
LOANS ORIGINATED 67 $56,571 31 $62,776 3 $32,500 APPLICATIONS APPROVED, NOT ACCEPTED 9 $58,678 7 $57,264 0 $0 APPLICATIONS DENIED 1 $55,000 1 $164,030 0 $0 APPLICATIONS WITHDRAWN 1 $35,630 0 $0 0 $0 FILES CLOSED FOR INCOMPLETENESS 0 $0 0 $0 0 $0
Fire-safe hotels and motels in Utica, New York:
Red Roof Inn #180, 20 Weaver St, Utica, New York 13502 Phone: (315) 724-7128, Fax: (315) 724-7158
Days Inn, 150 N Genesee St, Utica, New York 13502 Phone: (315) 797-8743, Fax: (315) 797-1500
Super 8 Motel, 309 N Genesee St, Utica, New York 13502 Phone: (315) 797-0964, Fax: (315) 797-0964
Hotel Utica, 102 Lafayette St, Utica, New York 13502 Phone: (877) 906-1912, Fax: (315) 733-7621
Best Western Gateway, 175 N Genesee St, Utica, New York 13502 Phone: (315) 732-4121, Fax: (315) 797-8265
Hampton Inn, 172-180 N Genesee St, Utica, New York 13502 Phone: (315) 733-1200
Holiday Inn Express & Suites, 23 Wells Ave, Utica, New York 13502 Phone: (315) 724-2726, Fax: (315) 732-0125
Fairfield Inn & Suites, 71 N Genesee St, Utica, New York 13502 Phone: (315) 798-9600, Fax: (315) 798-9601
Delta Hotels by Marriott Utica Centre, 200 Genessee St, Utica, New York 13502 Phone: (315) 797-8010, Fax: (315) 930-3890
All 9 fire-safe hotels and motels in Utica, New York
Most common first names in Utica, NY among deceased individuals Name Count Lived (average)
Mary 1,565 80.9 years John 1,309 75.6 years Joseph 1,064 75.0 years William 745 76.2 years Frank 655 77.1 years Helen 587 80.0 years Anna 571 82.1 years Margaret 516 81.4 years James 516 72.9 years Charles 510 77.0 years
Most common last names in Utica, NY among deceased individuals Last name Count Lived (average)
Jones 331 78.3 years Williams 239 77.3 years Smith 233 76.3 years Roberts 171 77.4 years Brown 156 75.0 years Miller 127 79.7 years Davis 103 73.2 years Johnson 102 73.8 years Evans 95 77.5 years Clark 88 77.9 years
Utica compared to New York state average:
Median household income below state average. Median house value significantly below state average. Unemployed percentage below state average. Median age below state average. Length of stay since moving in above state average.
#7 on the list of "Top 101 cities with largest percentage population decreases in the 1990s) (population 50,000+)"
#8 on the list of "Top 101 cities with the most residents born in Bosnia and Herzegovina (population 500+)"
#12 on the list of "Top 100 cities with oldest houses (pop. 50,000+)"
#13 on the list of "Top 100 cities with old houses but young residents (pop. 50,000+)"
#25 on the list of "Top 101 cities with largest percentage of males in occupations: healthcare support occupations (population 50,000+)"
#25 on the list of "Top 101 cities with largest percentage of females in industries: health care and social assistance (population 50,000+)"
#26 on the list of "Top 101 cities with the most residents born in Belarus (population 500+)"
#30 on the list of "Top 101 cities with the least cars per house, population 50,000+"
#31 on the list of "Top 101 cities with the lowest average sunshine amount (population 50,000+)"
#31 on the list of "Top 100 cities with shortest commuting times (pop. 50,000+)"
#33 on the list of "Top 101 cities with largest percentage of females in occupations: healthcare support occupations (population 50,000+)"
#40 on the list of "Top 101 cities with the lowest average temperatures (population 50,000+)"
#45 on the list of "Top 101 cities with the most residents born in Thailand (population 500+)"
#49 on the list of "Top 101 cities with the coldest winters (population 50,000+)"
#51 on the list of "Top 101 cities with largest percentage of males in occupations: personal care and service occupations (population 50,000+)"
#54 on the list of "Top 101 cities with largest percentage of males in occupations: fire fighting and prevention workers including supervisors (population 50,000+)"
#57 on the list of "Top 101 cities with the lowest minimum monthly sunshine amount (population 50,000+)"
#58 on the list of "Top 101 cities with largest percentage of males in occupations: office and administrative support occupations (population 50,000+)"
#58 on the list of "Top 101 cities with largest percentage of males in industries: health care and social assistance (population 50,000+)"
#58 on the list of "Top 101 cities with the lowest daily low temperatures (population 50,000+)"
#20 on the list of "Top 101 counties with the largest increase in the number of births per 1000 residents 2000-2006 to 2007-2013 (pop 50,000+)"
#24 on the list of "Top 101 counties with the lowest percentage of residents relocating from other counties between 2010 and 2011"
#35 on the list of "Top 101 counties with the lowest percentage of residents relocating to other counties in 2011"
#57 on the list of "Top 101 counties with the largest number of people moving out compared to moving in (pop. 50,000+)"
#65 on the list of "Top 101 counties with the most Catholic congregations"
Top Patent Applicants
Michael C. Wicks (5)
Paul Antonik (4)
Andrew C Putrello (2)
Zhiqiang Lin (2)
Frank H. Boehm (2)
Qianqing Ren (1)
Marie Blackshear-Smith (1)
Andrew Stemmer (1)
Ernest Joseph Critelli (1)
Steve Licht (1)
Total of 47 patent applications in 2008-2025.


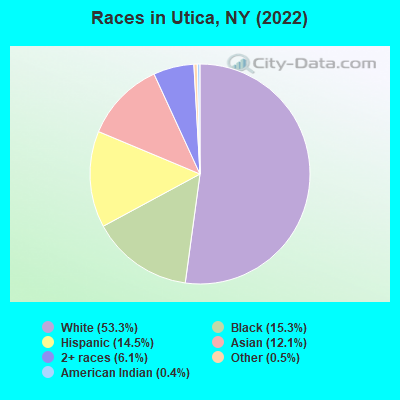
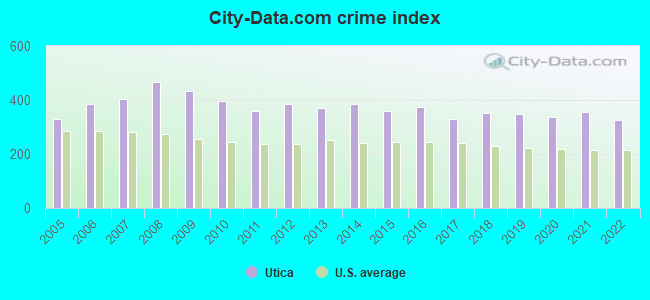
 Recent articles from our blog. Our writers, many of them Ph.D. graduates or candidates, create easy-to-read articles on a wide variety of topics.