Nothing Special   »   [go: up one dir, main page]

CERN Accelerating science

 
New Higgs Inflation in a No-Scale Supersymmetric SU(5) GUT - Ellis, John et al - arXiv:1411.5537KCL-PH-TH-2014-48LCTS-2014-49CERN-PH-TH-2014-230
 
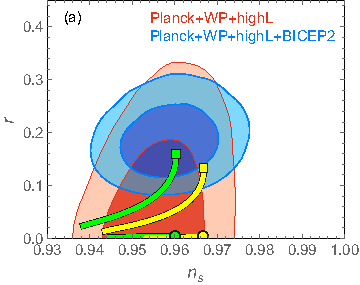
\it The predictions of our no-scale SUSY GUT model of Higgs inflation for the spectral index $\,n_s^{}$ and tensor-to-scalar ratio $\,r\,$.\, The green (yellow) dots and curves represent predictions with 50\,(60) $e$-foldings. In plot (a), the condition $\,\be_2^{}=\fr{1}{3}\be_1^{}(1-\zeta)u^2$\, is imposed and the round (square) dots correspond to $\,\zeta =0~(\zeta =1)$.\, The horizontal strips attached to the lower round dots correspond to the effect of varying $\,\zeta\in [0, 0.1]\,$ (from right to left), while the upper strips attached to the square dots depict the effect of varying $\,\zeta\in [0.9, 1]\,$ (from left to right). In plot (b), the three pairs of dots from top to bottom correspond to $\,\zeta =(1,\,0.98,\,0.95)$\, and $\,\de=0\,$.\, The strip attached to each round dot describes the effect of varying $\,\de\,$ over the range $\,\pm \, (1.2 \!\times\! 10^{-3})\,$,\, via the shifted relation $\,\be_2^{}=\fr{1}{3}\be_1^{}(1-\zeta+\de )u^2$.\, In each plot, the shaded red and blue (pink and light-blue) contours represent the observational limits at 68\% (\,95\%\,) confidence level as given by Ref.\,\cite{cmb2}.